Espacios. Espacios. Vol. 30 (2) 2009. Pág. 17
Mauricio Uriona Maldonado, Norberto Dias y Gregorio Varvakis
The methodology uses two concepts for the establishment of comparison parameters, the Practice index and the Performance Index. The practice index is related to the management and technological tools and techniques in the productive system. The performance index measures the company’s performance through the practices implanted (Mazo, 2003).
For Innovation Management benchmarking the Benchstar uses two different graphs to present the results, the first one is the Radar Graph, and the second one is the X-Y Plot, called the Practice and Performance Graph.
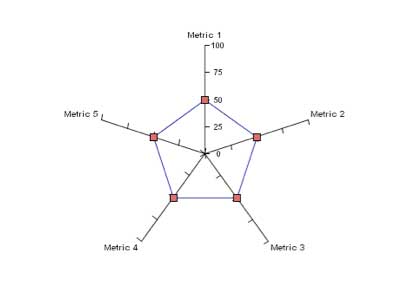
The radar graph is composed by five axis, each one with a scale from 0-100%, the position of the company in a specific aspect is represented with a point, linking them with a line, forming a closed polygon of five faces, the corners of the polygon represent the aspects that were measured: Innovation, Innovation Organization, Competitive Intelligence (CI), Monitoring and New Product Development (NPD).
Figure 1
Radar Graph
Source: Mazo (2003)
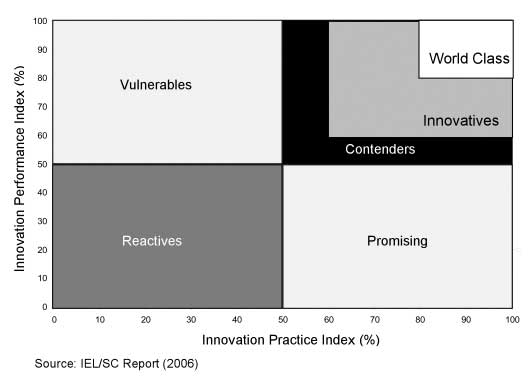
The second graph uses a boxing analogy (Hanson & Voos, 1995; Mazo, 2003; IEL/SC, 2006) (See Figure 2). The basic test of validity of the model is to correlate the use of Best Practice versus Performance, the designated areas in the graph are (IEL/SC, 2006):
Figure 2
Practice vs. Performance Graph
The Benchstar methodology was applied in a Small Business Enterprise from the Electro-Electronic Sector called Cianet Inc. between November-2005 and June-2006 as an initiative taken for the company’s shareholders and Instituto Euvaldo Lodi IEL/SC.
Cianet Inc. provides digital communication solutions for global markets, by developing and incorporating technologies in a convergent and flexible way. It has over 12 years in the market, and its headquarters are located in the city of Florianópolis, State of Santa Catarina, Brazil.
Cianet Inc. evolved from being part of electronic development projects’ design and consulting operations for other companies in its early years, to solid R&D, NPD, sales and OEM operations with Taiwan nowadays.
In this sense, Cianet Inc. was invited by IEL/SC to participate in the Benchstar pilot project, innovative per se in Brazil, along with other four companies. The company was invited due to its focus on technology and product development, for having quality and technological programmes implemented, and for being the winner of several Brazilian prizes in R&D.
This paper shows how the Benchstar application helped the company to identify key factors that needed to be strenghten, in Cianet’s Innovation Management system. Specifically, the Benchstar helped to identify:
For the process of application a committee was designated internally, composed with managers, supervisors, and technical staff, which had as a primary function to sensitize the company’s workers about the importance of the activities being developed, approximately, 90% of the committee was designated from the already existing Quality Committee. The sensitization process was smooth due to the committee’s past experience in similar activities.
After the first phase, the data collection phase was strongly supported on the documentation related to the company’s ISO 9000:2000 system, thus, the staff didn’t have major difficulties in collecting the relevant information. This information was then analyzed and compared with the IEL/SC database.
The results obtained are presented in Table 1, containing the areas: Innovation Organization, Competitive Intelligence, Product Development, Monitoring; and the indexes: Innovation Practice and Innovation Performance.
Table 1
Results obtained per area
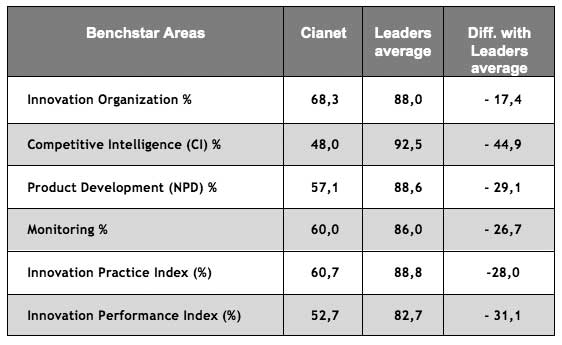
Source: Authors
Both indexes had values lesser than the leaders average. The Innovation Practice Index obtained by Cianet was 60,7%, below 28,0% of the world leaders average considered in the IEL/SC Database. On the other hand, the Innovation Performance Index was 52,7%, below 31,1% of the world leaders average.
In the Practice vs. Performance graph, both indexes gave Cianet Inc. the Contender position (Figure 3), meaning that the company uses some of best practices in Innovation Management and its results on performance are adequate.
Figure 3
Cianet Practice vs Performance graph
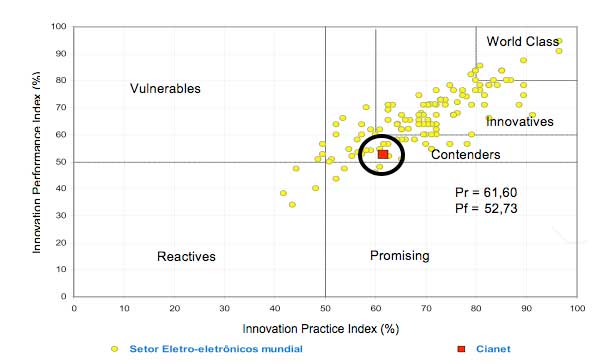
Source: IEL-SC Report (2006)
The indicators measured for the Radar graph (Figure 4) showed that Organization for Innovation is the one that gets closer to the Leaders’ level, this was sustained by the natural focus on R&D that Cianet has, due to the expertise of its shareholders in this matter.
Figure 4
Cianet Radar graph
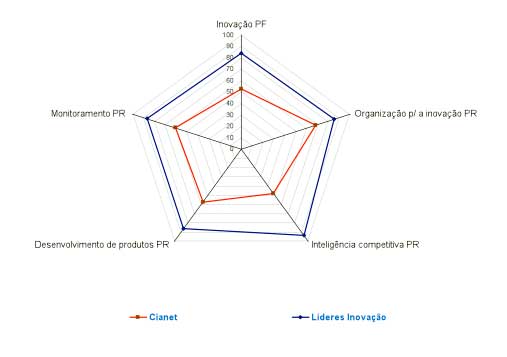
Fonte: Relatório IEL-SC, 2006
The benchmarking methodology applied in Cianet Inc., namely Benchstar, brought some interesting results regarding aspects such as Production and Operations Management in general and Innovation Management practices and performance.
After the presentation of the final report by IEL/SC in 2006 to Cianet’s managers and a meeting held in August 2007, some aspects were discussed and analyzed, in order to identify some of the causes that contributed to obtain those values in Practice and performance indexes.
First of all, it was determined that the methodology didn’t consider explicitly the situational context of the companies studied, in the sense that some of the weaknesses identified by the benchmarking methodology were known to Cianet’s managers, however because of the unavailability of more own financial resources, more public policies, etc., these actions (e.g. specialized product testing equipments, ERP system implementation, extra quality management staff, etc.) weren’t executed.
These characteristics could inevitably affect the performance and practice indexes, since benchmarking companies of different contexts, like the Latin American SME’s and European world class companies, present exogenous variables, that sometimes are determinant factors for producing biased values.
This also means, that unlike when the state-of-the-art practices are unknown to SME’s scenario, where mentoring, tutoring and training could help to solve this kind of problems; in some of Cianet’s experiences, managers knew the problems, the causes to these problems, and the actions that needed to be taken for improving performance, however with a more complex problem solving process, that is, to surpass the financial obstacle, common to MPE’s in Latin America, the lack of Government policies for MPE’s development, etc.
Second of all, these measurement system feeding the IEL/SC Database, could present inconsistencies between the companies benchmarked, due to the aspects considered above. Thus, the performance and practice indexes should need to have a additional weighted procedure for insuring that context aspects are also considered.
In 2006, after the presentation of the results by IEL/SC, an improvement plan was designed, facilitating future measurements of Production and Innovation practices and performance; and the inclusion of innovation initiatives in Cianet’s Strategic Plan. The shareholders also concluded that through the implementation of Innovation Management tools and techniques like Competitive Intelligence and Business Intelligence softwares, SWOT strategic analysis, Quality Function Deployment, among others, Cianet’s innovative potential could be greatly increased. In August, 2007 a meeting was held with the companies that participated in the first initiative and some other courses of action were defined.