1. Introduction
Brazilian imports have grown considerably, leading Brazilian companies to seek measures to expand their international competitiveness, particularly with products of known technology. If, on the one hand, manufacturing contributes little to a company’s success in the market, on the other hand it offers an important source of competitive advantage. Some authors point out that the operation function may become a weapon of attack and defense for the company to face the market (HAYES et al., 2004).
Kaplan & Norton (2004) stated that 70% of failures in organizations cannot be attributed to poor strategy, but to poor execution. The inability of manufacturing to translate a competitive strategy is one of the greatest frustrations that companies experience (SLACK, 1993). Hill (2000) ascribed these inefficiencies to the failure of companies to bring together the functional contributions in order to understand, solve and achieve established goals due to the noninvolvement of the production area.
In this context, operational policies on the functional level must be explicitly a part of the company’s strategy. The strategic alignment between corporate objectives and manufacturing depends on the means available to achieve these objectives and on the variables actually measured at the operational levels.
These different aspects are sustained by different people, departments and sectors, all of whom will meet at the level of production work situations, in which production operators and supervisors will interact with these various logics.
These logics, which may or may not be aligned with the manufacturing strategies, are necessary for the company’s economic efficacy, but they are partially contradictory and therefore require daily management. The intermediation of these logics results in direct negotiations among the various actors in the process. However, the idea of contradiction among the various factors at play is rarely recognized in the company. What are usually prioritized are short-term issues, in which the economic logic predominates.
According to Guérin (1997), analyses of situations of collaboration in which various logics are confronted often indicate that the difficulties attending such collaboration lie in the fact that the different actors ignore the restrictions of their interlocutors while assuming that the latter can easily take into account the constraints (in the sense expressed by Francophonic ergonomics) to which they are subjected (Table 1).
Table 1 – Points of view of the different actors in the company
Social Agent |
Interests |
Top management |
Innovation, capital returns |
Workers |
Knowledge, salary, career |
Trade unions |
Jobs, wages, working conditions |
Work Safety and Health |
Health, prevention of the work force |
Human Resources |
Qualifications, social assistance |
Times and Methods |
Performance, productivity |
Supervision |
Stocks, deliveries, quality, cost |
Source: Guérin et al. (2001)
In the opinion of Duraffourg (apud LIMA, 2000), the social actors and their points of view which claim legitimacy inside an organization correspond to a partial function (production, quality, maintenance, purchasing, sales, finance, safety, etc.), where the viewpoint of the activity is presented as a privileged position, albeit rarely recognized as such. For the author, the standpoint of the activity is the only one that can possibly be universalized, and capable of establishing a satisfactory compromise between the objectives of production and the conflicting logics of its realization.
The work activity is the central element that organizes and structures the components of the work situation and, in this sense, the integration of the different dimensions must be considered when it comes to performance in the organization. The recognition of these elements by the organization is important insofar as it can expand the spaces of regulation of the operator, ensuring that the task is performed without posing risks to health or productivity. For this to be possible requires a modification in the company’s organizational structure to open a space for discussion among the agents.
Thus, the company’s success in executing its strategy is related to the efficacy of the work and, therefore, depends on the operator’s creative action, i.e., the realization of the task. The objectives of efficacy, quality, etc., depend on the contribution of the operators themselves (or on the operators collectively), for they spontaneously build new instruments or knowledge that contribute toward the transformation of the production system (FALZON, 1996). However, in the development of operational indicators, the logic of top management traditionally prevails at the tactical and operational levels.
The modern conditions in which organizations conduct their business therefore invite a broadening of the definition of performance, integrating a plurality of reputedly social dimensions and a plurality of actors, with the necessary interaction among these dimensions. The workers’ participation would thus take on a more strategic dimension with their intervention in the definition and content of performance.
Based on this understanding, a performance diffusion and measuring model is constructed for a manufacturer of school and office supplies. This performance management model enables the company to disseminate the strategy and measure its performance at the operational level.
The objective of this work was therefore to build a production operations performance evaluation model based on an understanding of the work activity and on the systematization of technical and organizational variables on the shop floor. One of the assumptions of the model was to establish measure variables of the output of operations and to establish a system of indicators that would be applicable particularly to the company’s operational level.
The work presupposes the involvement of different areas of the company for the generation of shared information (sources of data, measures and procedures) and the involvement of shop floor operators in the process of the project in order to bring to light the complexity of the problems to be studied and the feasibility of proposed solutions for the indicators.
2. Methodology
Action research, as a technique of social research, guided the development of the project because it is a method oriented toward problem solving and transformation (THIOLLENT, 1998). In addition to participation, action research involves a form of planned action of a social, educational and technical nature, which was fundamental in the execution of the project. It is an action that serves as the basis of a project in which the researcher and the actors are involved in bringing about a change, an innovation, a transformation of a given set of problems (ANDALOUSSI, 2004).
For the members of the organization, the establishment of an action research process is an opportunity to speak up, think for themselves, and get together to analyze the problems encountered at work. Knowledge is sought by obtaining information that would otherwise be difficult to discover by other means. The purpose of the action is to contribute to the best possible assessment of the problem under consideration as the center of the research, proposing actions to help the agent (THIOLLENT, 1998).
In a joint project, the various partners (actors) have the opportunity to differentiate their representation and their values, enhancing their diversity and complementarity. Through the game of differentiation, the partners can discover new elements in the system and modify their representation of the whole (ANDALOUSSI, 2004).
The participative nature of the analysis allows for a broad approach within the organizational context. For this reason, many companies are seeking the solution to technical and organizational problems in various fields by analyzing the activity.
Thus, the analysis of the activity (GUÉRIN, 1997), together with action research, counterposes the activity of real work with the work prescribed by the organization, placing them at the core of the analysis and showing the deficiencies of this interface. The work activity is the central element that organizes and structured the components of the work situation. The integration of the different dimensions must be considered when speaking of performance in the organization (LOPES, 2004).
Because he is present at the moment the product materializes, the worker has the chance to detect and eliminate inefficiencies in the process, such as those that affect the efficiency of time and quality.
3. Operational Strategy
When one reflects on the theme of strategy, one finds it is a theme frequently discussed in organizations, principally after World War II, when Japanese companies threatened the market leaders in some sectors. The article “Manufacturing – missing link in corporate strategy”, written by Skinner and published in the Harvard Business Review (SKINNER, 1969), opened the discussion on the theme, both at academic institutions and in organizations. In that paper, the author points out the importance of an operational strategy to complement corporate and business strategies.
Among the various definitions of the theme, Mintzberg (1996) proposes five formal definitions of strategy: as a plan, maneuver, standard, position and perspective. The author states that the fact that the word strategy in practice is used in different ways means that several definitions are implicitly accepted.
For Mintzberg, the definitions of strategy as plan and standard may be independent of each other, i.e., plans may or may not be carried out, while an action standard can be achieved without necessarily having been planned. Figure 1 illustrates this observation. Intentions that are carried out in full can be called a “deliberate strategy”, while a standard developed without prior intention can be called an “emergent strategy”.
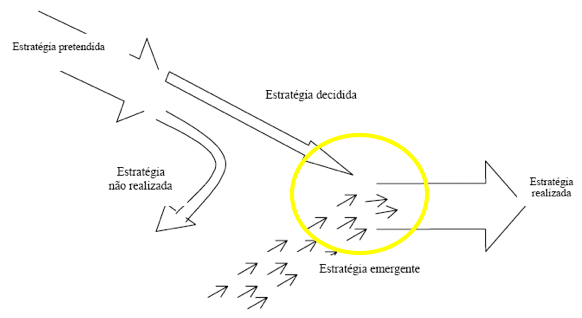
Figure 1 – Deliberate and emergent strategies
Source: MINTZBERG (1996, p. 12).
Drawing a parallel with the work discussed in this paper, we can place the issue in the execution of the realized strategy, achieving a greater alignment between the deliberate and emergent strategies pinpointed in the yellow circle in Figure 1.
Manufacturing strategy is guided by competitive priorities, which are defined by the strategy itself. According to Hayes & Wheelwright (1988), a competitive strategy can unfold into priorities or tasks that the production function must carry out. These tasks can be expressed by five performance indicators: cost, quality, flexibility, delivery and service. The manufacturing tasks, or the indicators, should be used as guidelines for the decisions to be made in the structural and infrastructural areas.
To deal with this subject, we consulted Garvin (1993), who presents the theme in great detail and proposes a division into sub-priorities, as follows:
- Cost (3): initial, operating, and maintenance costs
- Quality (8): performance, attributes, reliability, conformity, durability, utility, esthetics, and perceived quality;
- Flexibility (3):
- Volume flexibility: meet market and peak demands;
- Product changes: response to new projects and requests for customization;
- Process changes: rapid changes in production sequence and changeover.
- Delivery (3): precision, speed, easy ordering;
- Service (3): problem solving, consumer support, and supply of technical information.
In this paper, the competitive priorities to be pursued involve mainly cost, quality and delivery.
4. Performance Indicators
In the implementation of the strategy, the organization should monitor the production system continually to ensure the success of strategic planning. Monitoring is done by means of performance-measuring systems that help administrators in the implementation of the business strategy, comparing current results against strategic goals and objectives (SIMONS, 2000).
In this context, performance indicators are indices that translate the business strategy to the operational level and allow for alignment between top management and shop floor operators (BITITCI et al., 1997). The main objective of these indicators is to measure how close the organization is to the goals established by the business and operational strategies.
Performance measurement can be defined as the process of quantifying the efficiency and efficacy of an action (NEELY, 1995).
Historically, several methods and techniques have been developed to monitor the performance of the business and the operations. However, these methods are implemented at the tactical and operational levels based on the same vision: that of top management.
The first step toward achieving full competitive manufacturing capacity is the selection of appropriate performance measures, while the second step is the identification of objectives at the shop floor level, such as the reduction of losses and of stocks in process.
Hayes & Clark (1986) state that evaluation systems, if not properly formulated, can even obscure the main developments and distort the perspective of administrators. In the case of successful companies, performance assessment and commitment to ongoing improvement are inherent elements of the strategy.
According to Bandeira (1997), “Measuring performance is, in fact, only justified when the objective is to improve it.”
Hayes & Clark (1986) discuss the importance of the commitment to ongoing improvement (“learning”). To maintain the capacity of the plant’s operations, administrators must pay attention and actively plan for “learning”.
Bititci et al., (2006) talk about the importance of recognizing the difference between measuring performance and managing performance. The difficulty of developing a collaborative culture and of developing proper performance measures were identified as major barriers to the implementation of performance management systems.
Organizations seek their goals through the customer’s satisfaction with better efficiency and efficacy than their competitors. Efficacy is related to meeting customer demands, while efficiency is the measure of how economically the company utilizes its resources to satisfy the market (NEELY et al., 1995).
According to Neely et al. (1997), 70% of the attempts to implement performance measurement systems (PMSs) fail.
When the indicators reach the shop floor, the variables that are measured are indirect, i.e., the performance to which the operator must work is not under his control. When they are posted on bulletin boards, the indices used by top management are not understood by the people working on the shop floor.
Some of the limitations of traditional performance evaluation systems cited by Dixon (1990) and by Kaplan & Norton (1997) are as follows:
- The measure is threatening, i.e., measurements that are not very clear to all those involved will cause discomfort.
- Precision is essential for useful measurements. Current evaluations aim to macro-evaluate the course the company has followed in search of consolidation.
- Focus on a single indicator. The complexity of organizations requires multiple and combines indicators.
- Excessive emphasis on accounting and financial productivity.
- Measures that are exclusively objective and quantitative. There is a need to measure less objective dimensions such as employee morale, level of knowledge acquired about processes and products, etc.
- The standards work as the upper limit of performance by establishing goals – usually financial – which, when achieved, are considered to have met the performance goal.
- Short-term syndromes, not strategy-focused, local optimization of resources, focus on the minimization of standard variations, do not consider the internal variabilities.
- Traditional performance measurement and evaluation systems are based on bookkeeping systems, usually involving internal costs, which are difficult for people in the company to understand. They are based on past results, i.e., past productivity, costs or profits.
Another characteristic of measuring systems is that the indicators interfere in behavior inside the organization (NEELY et al.).
Organizational culture and management style interfere in the way PMSs are implemented and used, resulting in their success or failure (BITITCI et al, 2004). On the other hand, PMSs can influence management styles and, to a certain extent, organizational culture.
Boune (2001) identified two factors that promote (drivers) and four factors that block (blockers) success in the implementation of PMSs.
Table 2 – Blockers and drivers in the implementation of PMSs
Drivers |
Blockers |
|
|
Source: Bititci et al. (2004)
Bourne considers Organizational Culture one of the critical factors to support strategic performance measures. The literature discusses two major approaches:
- The need for a culture that supports work teams, property and initiative; and
- The importance of a culture focused on continuous improvement and on strategic performance measuring systems.
Bititci states that successful implementations of PMSs led to more participative management styles. Once they have been implemented and put into practice, supported by consulting management, performance measuring systems lead to greater acceptance (buy) at every level.
Tushman & O’Reilly III (1996) assert that the key to the success of high performance in organizations lies in the congruence among the elements of the organization, particularly among its strategy, structure, people and culture.
In operations, it is important for indicators to be understood and handled easily. Moreover, visual communication should be prioritized.
Hall (1987) defines visual communication as communication “without words, voiceless”, not only of the conditions of the shop floor for the workers, but also serving as a real map of the conditions of the company for all those who can read physical signs.
5. Demand
The company where the project was developed has a plant located in the interior of the state of São Paulo and is part of a group acting globally in the sectors of writing materials, paints and cosmetics.
The production chain under study is responsible for the manufacture of the company’s principal product line, and is the largest worldwide manufacturer in its sector, exporting to over 70 countries. Annual production amounts to approximately 1,8 billion parts, produced by a work force of 1,400 employees. The volumes produced here represent 80.5% of the domestic production and 66.7% of the worldwide production.
The demand for indicators came from the top management of the industrial division, which felt the need to develop operational indicators aimed at placing its operators as the central element in the execution of the strategy.
In response to this demand, the company approached the SimuCAD Group at the Federal University of São Carlos Department of Production Engineering, which carried out the project.
The main questions that had to be answered in the project were:
- How does the company work costs, quality and stock and how does it control these dimensions at the tactical and, particularly, the operational levels?
- How does the company evaluate its results, and who participates in this evaluation?
The model to be developed had to be simple and operational and have operational modes that would not make it bureaucratic. Allied to the development of the indicators, the mission was to change the attitude towards those indicators, clearly indicating who would be responsible for each action.
Another function of the indicators had to be the promotion of communication at the operational level. The visual communication system of the indicators had to be easy to understand and accessible so that it could be disseminated throughout the plant’s sectors.
One of the expectations of top management was to have a system that would be self-sustainable after the project was concluded.
One of the main difficulties was to make the language uniform and understandable at every hierarchical level. To this end, the indicators were to be standardized.
The cost dimension, which was one of the priorities, was to be the domain of the operators. One of the main premises was the moment of cutoff: “whatever we cannot interfere with does not interest us”. In other words, it only makes sense to have an indicator for a variable in which I can interfere, upon which I can act.
The major expectation was to have the assembly line operator presenting his indicators within one year.
Part of the project was also the development of competencies for a group of professionals from the company’s production, administration and human resources areas to carry out the process of dissemination of the model, forming a permanent committee of validation of the indicators.
A premise was the involvement of operational personnel, leaders, supervisors and department heads in the process of construction of the model, based on the real activities taking place in each sector studied. These people were responsible for updating and evaluating the indicators.
The project was expected to achieve the following goals:
- Bring together different areas of the company to generate shared information (sources, measures and procedures)
- Establish uniform levels of knowledge
- Link operations to strategic objectives
- Integrate financial and nonfinancial information
- Identify and eliminate waste
- Redirect the company’s focus from bureaucratic to operational systems
- Speed up organization and functional learning to enable flexibility
- Translate flexibility into specific indicators
- Be easy to understand on the shop floor and accessible to all the employees
- Cause visual impact
- Focus on improvement rather than on variation of the process.
The part of the chain in which the project was developed is divided into three sectors:
Sector 1 – supply of raw material – Batch process
Sector 2 – assembly – line flow process
Sector 3 – finishing and packinging – job shop and cellular layout process
The manufacturing sector of supply and the assembly line are located in one plant (called plant 2) and the finishing and packaging sectors are situated in another plant (called plant 1) located 1.5 km from plant 1.
6. Phases of the project’s process
The phases of development of the indicators were as follows:
- Modeling of the flow (materials and information) and characterization of the work situation;
- Mapping of the competitive priorities;
- Analysis of the activity;
- Creation of the performance measuring system;
- Prototyping and implementation of the measuring system;
- Dissemination of the model.
A training course was held in parallel for a group of professionals from the company in order to homogenize concepts of action research, activity analysis, competitive strategy and value flow mapping.
6.1 Modeling of the flow and characterization of the work situation
The first phase of the project consists of collecting the data on the flow of materials and information about the work situation under study. The work method in the variables identification phase consists of directly observing the work, collecting formal production documents and conducting individual semi-structured interviews with the people of the operational, tactical and strategic levels of the company.
6.1.1 Characterization of the work situation
The first step consisted of drawing the flowcharts of the process in the sectors of Supply “X”, Assembly, and Finishing and Packaging.
With the flowcharts in hand, the next step was to draw up charts characterizing the operations in each manufacturing stage. The objectives of the characterization charts were as follows:
- Compile a set of information about the workings of the company;
- Format the information that will support later decision-making;
- Ensure sufficient mastery of the technical data of the work situation;
- Provide support for communication among the various interlocutors;
- Build a reference tool for the description and interpretation of data that will be produced by the analysis of the activity.
Prior to drawing up the characterization chart, the work is observed and the workstation to be analyzed is defined.
After defining the workstation, a description is made of the activities carried out at that workstation, illustrating the description with photographs and films. The information is collected by observing the work at the workstation and interviewing the operators, leaders and heads of each sector. Annotations are made using ordinary shop floor language. Figure X illustrated the first page of a characterization chart. Each chart contains the following information:
- The technical name of each process and a description of the operation, identifying the sequence of transformation of the materials (input and output);
- The equipment utilized in each phase of the sequence;
- The transformations the materials undergo;
- Mean process times and set-up times;
- Availability and number of pieces of equipment, and
- The process parameters, which are the variables that explain it (temperature, time, pressure, chemical reaction, velocity, quantity);
- The controls used by the operator and the automatic controls (machine-controlled).
A chart is drawn up for each input material and each process output, containing information about each material/component. This chart contains all the necessary information for mapping the flow. The items are quantified and qualified, explaining the conditioning factors of each one (see example in Figure X).
- Supplier and client;
- Form of presentation (unitizer);
- Quality parameters;
- Input and output lot size;
- Frequency of lot replenishment;
- Current input and output stock.
An analysis was also made of the process control systems and charts produced describing the manufacturing operations focusing on the control activities and the parameters of each process/operation, in order to check how the controls respond to the requirements of quality, costs, time and stocks.
A survey was also made of the stages of the process that are critical to quality. The records, evaluation, monitoring and control systems were characterized, identifying the items and the form of inspection, the rejects and the forms of rework.
To visualize the stocks and lead-time, a Value Stream Map (VSM) was drawn up (WOMACK & JONES, 1998). The VSM (ROTHER & SHOOK, 1998) is a graphic qualitative/quantitative technique utilized to represent material and information flows along the value flow of a family of products. The stocks and transportation of material, in particular, are shown on the map, but quantified temporally. The VSM also shows the times of the intervals of delivery and receipt, and process and cycle times, among others.
6.1.2 View of heads of departments and managers
In this phase, a survey was made of the expressions at the tactical level of the organization. Initially, an in-house seminar was held to discuss the fabrication process, quality systems, costs and planning. Subsequently, meetings were held to identify the manager’s opinions about the production strategy, strategic dimensions, stock systems, cost system, manufacturing times, and performance.
Slack’s importance/performance matrix was used to identify the emergent strategies and map the competitive priorities.
A questionnaire was drawn up and applied (ZANON, 2005) to several hierarchical levels of the organization: technicians, sector heads, middle level managers and top management. A Slack (1993) importance/performance matrix was then drawn up based on the questionnaire.
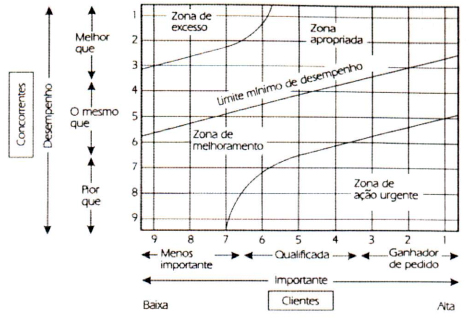
Figure 2 – Importance/Performance Matrix (SLACK, 1993)
Quality (performance in use) and flexibility (of the technological resources) are the two order winners within the zone of urgent action.
Within the zone of improvements, we found mainly order winners such as delivery (completeness, time, punctuality, and reliability), quality (conformity), and flexibility (new products, in delivery).
The qualifying objectives identified within the zone of improvement were speed (service, information, cycle of operations), quality with respect to esthetics, and, once again, flexibility in terms of fabrication and supply routes.
6.2 Modeling
This phase consisted of modeling the principal determinants of each competitive factor, such as expression on the shop floor, through mapping of the conditioning and determining factors of the work. This mapping was done using two main tools: a Perception Questionnaire and Focal Groups.
On the first level, the objective is to establish a language about the work performance which is intelligible to all the managerial, technical and operational levels.
An essential requirement in this phase was to understand the individual ways in which the operators see the dimensions of quality (or work, product and process), cost and stock at the workstation. This meant understanding the operators’ perception about the origin and linkage of the yield in the processes, which mechanisms used by the operators ensure the operation is carried out as expected, and what their viewpoint is regarding the current indicators. Elements of the organization of the real work were also identified.
6.2.1 Perception Questionnaire
The purpose of the individual questionnaire is to identify the operators’ viewpoints about the process activities, focusing on their interpretations of quality, costs, stocks and times. The operators were questioned about the current situation and invited to suggest changes.
6.2.2 Focal Groups
In work situations, it is very common for one operator’s work to be linked to that of his co-workers. The collective aspect of the activity takes on different forms. To determine the collective perception, we used the focal group technique.
Based on these instruments, the real parameters used at the workstations in critical operations were determined to express the indicators of quality, time, costs and stocks, from raw materials and process operations to the end product. This analysis was compared with the formal management model (production, accounting, planning, commercial, etc.).
6.3 Creation of a performance measuring system
Several premises were considered during the project:
- The performance criteria should be chosen according to the company’s objectives
- It must be possible to compare the organization to other companies in the sector
- The purpose of each criterion must be clear
- The collection of data and methods of calculation should be clearly defined
- Quotients are preferable to absolute numbers
- The performance criteria should be under the control of and evaluated by the organizational unit
- The performance criteria should be selected based on discussions among the people involved (customers, employees, administrators, etc.)
- Objective criteria are preferable to subjective ones
- The measures should be related directly to the company’s manufacturing strategy
- Non-financial measures should be adopted
- Measures can differ from one department to another
- The measures may change according to the circumstances
- They must be simple and easy to use
- They must allow for rapid feedback
- They should be designed so as to foment ongoing improvement through simple monitoring.
Based on a set of guidelines proposed by Neely (NEELY et al., 1997), the first variables to be monitored were proposed; after their validation by the operators, they would constitute the performance measures. One of the rules is never to make anyone responsible for any measurement point over which that person has no control. The chart for recording a performance measurement should contain: a Title, Purpose, Relationship with the performance objective, Goal, Formula, Measurement frequency, Review frequency, Name of the person taking the measurement, the Source of the data, the Names of the owners of the measure and their actions, Who acts on the data and What they do.
In the process of developing this project, the seminars enabled the discussion and reflection on the hypotheses formulated during the study and validated based on quantitative and qualitative criteria, according to SCHON (1983).
6.4 Creation of a visual measuring system and communication about the indicators
The indicators were disseminated by means of notice boards in the production cells/lines. The notice boards enable alterations in the results of the work to be seen rapidly, enabling actions to be taken immediately to solve problems. The notice boards consist of 9 panels that summarize the performance indicators. Figure 3 illustrates one of the panels.
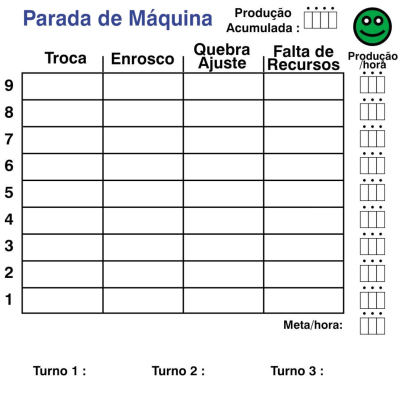
Figure 3 – Visual panel with Stoppage and Productivity indicators
An instruction manual was created for each panel to serve in making decisions. The manual also explains the function of each indicator and how the Panels should be handled. In this process, the operators are responsible for:
- Informing the values of the established indicators on the charts;
- Take the necessary actions to solve identified problems, following the instructions for each action;
- Keep the indicator charts updated and in working order;
- Inform the sector representative about problems that occurred and that may have been caused by materials originating from other sectors;
- Periodically evaluate whether the charts are helping internal communications among the operators in the line or cell, and external communications among the operators and other functions or sectors, such as programmers, mechanics, quality control, and supervisors.
6.5 Creation of an organization model of the inter-sector indicators
Together with the visual indicators, a forum of discussion had to be created to foment medium and long-term actions. To this end, a group of representatives of the indicators was set up.
Each sector has a representative from each shift, who is responsible for promoting the integration of the sectors and for helping solve problems among the sectors. This representative is chosen by his peers and plays this role for one year.
The representative’s responsibilities are to:
- Inform about problems originating in other sectors (supplier sectors) and involving the materials used or processed in his sector.
- Hold periodic meetings (every 2 weeks) with the representatives of the other sectors to exchange information about the problems between sectors; improvements in the indicators on the panels; other improvements relating to the instructions for action, performance and evaluation of goals.
- Keep all the operators in his sector informed about the results of the meetings with the other representative;
- In his own sector, find out the reasons, explanations and improvement measures taken to solve or attenuate the impact of identified problems. To this end, the representative should consult supervisors, sector heads, quality control, mechanics, programmers, etc.
- Inform the other representatives about the steps taken in his sector to solve identified problems.
7. Developed Model
The developed model proved very effective in bringing up for discussion the main conditioning factors of the work and the competitive factors prioritized by the company. This process of discussion and project (BUCHIARELLI, 1994) also promotes alignment among the different levels within the organization.
Thus, the indicators not only translate the company’s objectives into day-to-day decisions but also promote discussion. Another advantage of the approach is that it enables the operator to express his knowledge of the work and thus promote improvements in the quality of that work and improved yield for the company.
To prevent imbalances in the prioritization of the factors, the indicators were formulated considering the trade-offs to which production is subject, and they should be monitored and modified according to the company’s dynamics.
The indicators in use in manufacturing have direct implications in the daily behavior of the operation. The dynamic nature of manufacturing can be expressed by the indicators, which should be updated frequently.
An interesting fact in this sense is that the operators themselves requested that the established goals be reviewed, and have adopted a more proactive attitude toward the organization.
References
ANDALOUSSI, K. E., (2004) Pesquisas-Ações: Ciências, Desenvolvimento, Democracia, Translation by Michel Thiollent, EDUFSCar, São Carlos, SP, Brasil.
BUCHIARELLI, L. L. (1994) Designing engineers. London: MIT Press.
GARVIN, D., A. (1993) Manufacturing Strategy Planning. California Management Review, v. 35, n. 4, p. 85-106, Summer.
GUÉRIN, F., LAVILE, A., DANIELLOU, F., DURAFFOURG,J., KERGUELEN,A. (1997) Comprendre le Travail pour le Transformer - La Pratique de L'Ergonomie, Éditions de l’ ANACT, Paris.
HAYES, R. e WHEELWRIGHT, S. C. e CLARK, K. B. (1998) Dynamic Manufacturing: Creating the Learning Organization. New York: The Free Press.
HAYES, R.; PISANO, G.; UPTON, D. and WHEELWRIGHT, S. (2004) Operations, Strategy, and Technology. United State of America: John Wiley & Sons.
HILL, T. (2000) Operations Management – Strategic Context and Managerial Analysis. Great Britain, 704 p.
KAPLAN, R. S., NORTON, D. P., (2004) Mapas Estratégicos – Convertendo Ativos Intangíveis em Resultados Tangíveis, Editora Campos, Rio de Janeiro.
LOPES, M. T. R., CAMAROTTO, J. A. (2004) Organização Prescrita do Trabalho e Organização do Trabalho Real em uma Linha de Montagem: Um Estudo de Caso, XI SIMPEP, Bauru, Brasil, 2004.
MAHONEY, R. M., (1997) High-Mix Low-Volume Manufacturing, Prentice Hall.
MINTZBERG, H. (1996) Five Ps for Strategy. In: MINTZBERG, H. e QUINN, J. B. The Strategy Process – Concepts, Contexts, Case. 3rd ed. New Jersey: Prentice Hall.
NEELY, A., RICHARDS, H., MILLS, J., PLATTS, K., BOURNE, M., (1997) Designing performance measures: a structured approach. International Journal of Operations & Production Management, v. 17, n.11, pp. 1131 – 1152.
PUGH, S. (1991). Total design: integrated methods for successful product engineering. Wokinghan: Addison-Wesley.
ROTHER, M.; SHOOK, J. (1998) Aprendendo a Enxergar: Mapeando o Fluxo de Valor para Agregar Valor e Eliminar o Desperdício. São Paulo: Lean Institute Brasil.
SCHON, D. A. (1998). The reflective practitioners: how professionals think in action. United States of America: Basic Books.
SKINNER, W. (1969) Manufacturing – missing link in corporate strategy. Harvard Business Review, Boston, v. 47, n. 3, p. 136-145, May/June.
SLACK, N. (1993) Vantagem Competitiva em Manufatura. São Paulo: Atlas.
THIOLLENT, M., (1996) Metodologia de Pesquisa-Ação. Editora Cortez. 8.ed..
WHEELWRIGHT, S. C. e HAYES, R. H. (1985) Competing through manufacturing. Harvard Business Review, Boston, v. 63, n. 1, p. 99-109, Jan./Feb.
WOMACK, J. P.; JONES, D. T. (1998) A Mentalidade Enxuta nas Empresas: Elimine o Desperdício e Crie Riqueza. Translated from the original “Lean Thinking”, Simon & Schuster, 1996. Translation by Rodrigues, A.B; Celeste, P.M.. Rio de Janeiro: Campus, 428p.
ZILBOVICIUS, M. (1999). Modelos para a produção, produção de modelos. Editora Annablume, São Paulo.