1. Introduction
With the globalization of the economy, new investment borders and consumer markets were opened, becoming the competition more and more intense and making the companies feel more and more pressured to take a position in advance to the market trends. In this context, levels of productivity and quality each time better are the target of the companies to become lucrative.
The electric sector is not different. The electric energy suppliers, for example, to keep themselves lucrative need an effective management for their process, in order to keep the continuity of the electric power supply in satisfactory levels of quality, once the discontinuity is this supply leads to many loss to the company, such as: damage to the brand image, loss of income, consumer dissatisfaction, fines and financial compensation charged by the regulatory agency for violation in indicators of electric power supply continuity and judicial problems arising from losses caused in productive systems.
Facing this scenario, Abbott (2006) studied the Australian electrical sector productivity between the 80's and 90's, when occurred a substantial restructuring of the sector. The results indicate that happened a substantial improvement in the industry performance. In fact, the electric power suppliers should always seek to improve the operational management in order to reach better levels of productivity to face the new challenges in the sector and the new requirements of the society. So true, those studies are being performed in this area.
The International Labour Organization (ILO) (1996, p. 4) defines productivity briefly as "the relationship between production and input". In this way, the rational use of productive resources leads to better results of productivity. Neverthless, Singh et al. (2000) state that even the productivity improvement being considered as one of the most important activities that affect the competitiveness in a company, it is many times relegated to the second plane, and neglected or ignored by the ones who influence the production process. Furthermore, Tovar (2011), who studied the productivity in 17 companies in Brazil for eight consecutive years, concludes that the productivity is not directly related to the size of the company.
Wang (2007), for example, has studied the Energetic Productivity Management in 23 countries from OECD between 1980 and 1990, concluding that the technological change was the most important source in the seek for excellence. This result is confirmed by Estache et al (2008) who suggested which factors influenced the most in the productivity and concluding that the answer was not in the capital labor, but in the investment in new technologies, as follows: "the analysis of productivity suggest that, although the companies made significant improvements in their capital and active humans, better results are reached when better technologies are used."
Ghalayini and Noble (1996) studied only financial indicators, emphasizing that the performance measurement had two phases. In the first one, that lasted until the 80's, the focus was a measurement based in financial criteria provided by the accounting management system.
The second phase begun at the end of 1980 and is still in course. It was started due to the intensification of the competitiveness, that is, the ned to offer products with high quality at competitive prices, and according to Corrê e Corrêa (2205), by the need to have a performance measurement system which supports the desion make process of the organization, once the financial indicators reflects only the results of the past actions.
With this, the companies have focused their attention to other performance indicators such as quality, flexibility and low lead time. Moraes (2012) highlights that if the key indicators are well managed, the financial results will follow the results from these results. In addition, since this second phase, many things have changed in the performance measurement and the interest in this area has increased substantially.
Another question to be pointed out that reinforces the little concern, sometimes, given to the productivity measurement is the own incomprehension of the meaning of productivity, what is easily confused with another similar concepts like profitability and efficiency. Furthermore, Singh et al. (2000) concluded none method to measure the productivity that serve to all companies. In this case, should be know the characteristics, the inputs and outputs generated during the process to, from this, draw the project of measurement and analysis of the productivity in the process. In that sense, Johnston and Jones (2004) highlights that although the definition of productivity seems to be simple, the productivity may be hard to deal with, for three reasons.
First, because the outputs are generally expressed in different ways than inputs. For porque as saídas são normalmente expressas em formas diferentes para as entradas. For example, some outputs are normally measured in physical terms, such as units (automobiles, tons (of paper), kilowatts (electricity), or currency (Euros). However, the inputs are physically different and include measurement of people (number, skills, hours worked or costs) or materials (in tons and costs).
Second, because the reason that results in the value of produtivity itself does not say too much regarding the performance. A ratio of 0.75 is not significant if it is not compared to previous periods, or a reference point, or a productivity of operation potential. And finally, because many different relationships can be used, due to many possible variables of inputs and outputs, whether financial and nonfinancial, which may be used to created indices of productivity.
The problems are bigger when the concepts of productivity are applied to service organizations. Specifically, because the intangible nature of many services complicates the objective definition to measure the outputs from the service to be performed. The evaluation and management of inputs and outputs also are complicated by the simultaneous production and consume of many services, as well as the perishability and heterogeneity, as well as the services happen in a different way by different people or even by the same people in different circumstances. (MCLAUGHLIN, C.; COFFEY, 1990, JOHNSTON; JONES, 2004).
In the case of electric power substation maintenance, focus of this research, it is noted that there is a high diversity of maintenance services that may occur as a function of the wide amount of equipment available in a substation and the diversity of conditions that a equipment can be. It leads to outputs and inputs very varied and, this ways, becomes hard to be measured.
So, this article presents an exploratory study in the sense to provide a methodology to measure the workmanship productivity, assuming a specific approach to the electric power substations maintenance. However, the study also represents a important practical contribution to other organizations, mainly the services ones, especially regarding to the procedures of performance evaluation of the workmanship productivity indices.
2. Productivity
The productivity management is indispensable to any company which is inserted in a competitive market and fo that, is necessary to know the meaning of productivity and the factor that affect it, measure it and, consequently, control the results fo this measurement.
2.1 Concept of Productivity
Productivity is a multidimensional term, which meaning can vary, depending on the context it is used (TANGEN, 2005). In this sense, Ghobadian and Husband (1990) state different concepts of productivity in three main categories:
- The technological concept: the relationship between the ratio of the outputs and inputs used in its production
- The concept of engineering: the relationship between the real and potential product of a process.
- The economist concept: the effiniency to allocate resources.
Although productivity has an easy meaning to be understood, Moraes (2012) points that a common mistake is to use the term productivity as synonym of production. With this misunderstanding, people tend to believe that when the production increases, productivity increases. This, however, is not necessarily true.
Galarneau and Maynard (2005) associates the productivity to a relationship of production with the production factor and state that its analysis is generally performed in terms of how it changes over time.
The measurement of production, therefore, considers only the result of the transformation process, and don't say anything about the effort that has been done to reach the output. There is still a confusion in the literature regarding the concepts of productivity and its relationship with profitability, efficiency, effectiveness and performance. To clarify these concepts, Tangen (2005) purposed the Triple-P model (Productivity, Profitability, Performance) to assure the well use of these terms according to their meanings.
Productivity is the central piece of the Triple-P model and has a very operational definition like the relationship between input and output – correctly produced products that meet its specifications – and the amount of input – resources consumed in the transformation process. The profitability also is seen as a relationship between input and output, but it is a monetary relationship that is influenced by the costs of inputs and the price stabilished for the outputs.
Performance is a generic term of excellence and includes profitability and productivity, as well as another with no-cost factors, such as quality, quickness to delivery and flexibility. The performance can be related wheter to a internal (inputs and process) or external (outputs) points of view of a company and activity
Effectiveness and efficiency are two terms that meet themselves with the previous three ones. They can, however, be separated from each other for a clear divergence. The first can be related to the external performance while the last one can be connected to the internal performance of a process, what results in the following definitions: effectiveness represents the degree in which the desired results are achieved and is a term to be used when the focus is on the output in the transformation process of production. Efficiency represents how well the resources of the transformation process are used. Effectiveness means the capacity to achieve a specific goal (TANGEN, 2005).
In fact, is the combination of elevated values of efficiency and effectiveness in the transformation process what lead to the high productivity, and not only one of them. So, it's is possible to have an effective but unefficient process, but also a efficient but uneffective process.
2.2 Measurement of Productivity
Within a wider context, Singh et al. (2000) state that there are three techniques to measure the productivity: the indices measurement, the Linear Programing, and the econometric measurements. However, the most common way to evaluate the productivity is through the measurement of indices and the presented article will use only this cited technique.
Singh et al. (2000) emphasizes that does not exist a method to all organization and the most important is that the productivity measurement be a source of information about trends in the process, call attention to performance issues and be useful to exchange ideas. Tangen (2004) highlights that the productivity itself has an ambiguous nature, because the general relationship of outputs to some inputs sometimes it not applied as productivity in some companies.
As can be seen in the Figure 1, almost all the transformation process inside a company is feed with many types of inputs (work, capital, materials and energy) and emits more than one output (product A, product B, etc), what in turn, makes the calculation of productivity way harder to be done. (KUROSAWA, 1991, apud TANGEN, 2004).
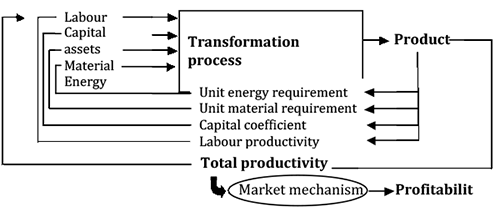
Figure 1 – Transformation Process
Source: TANGEN (2004, p.39).
It can be pointed, therefore, that many types of measurement of productivity and distinct ways to add inputs and outputs through the use of weights is possible. Smith (2003, p.5) states that a important initial step to measure the productivity is establishment of standards, which is "something developed to be used as rule or basis for comparison of quality, quantity, value, content or extension. The standards are established through information from the ones who execute the task, from evaluators and from many sources of data existing inside and outside the company. The standards change according to the changes in the labor. To Smith (2003, p. 101), "the standards form a solid basis to the measurement in any field of investigation and may be specific to the labor, person, organization or industry".
Sumanth (1994) highlights that usually there are three traditional kinds of measurements of productivity indices: partial measurements of productivity, measurements of productivity of total factor and measurements of total productivity. The advantage of measurements of partial productivity is the simplicity to understand and measure. The most common measurement of partial productivity is the labor productivity. For example, production per hour of work or production per employee. To some authors like Suh (1990), Hayes e Clark (1986), due to the total cost of the direct work be turning a small fraction of the cost of total production in the most moderns operations of production, the measurements of productivity of labor are becoming useless.
On other hand, the productivity in the labor can be an adequate measurement if the strength of work is a dominant factor of production. It can be very useful to give a feedback to the workers, once this data is easily comprehended and the workers want to know how their performance (BERNOLAK, 1997) is.
Maybe the biggest limitation of the partial measurement is that it is considered only a factor of production. It can, for example, enhance the productivity in the labor with an addition of capital and at the same time the partial productivity may be reduced. This way, partial measurements are not able to explain the increase in general costs and may be misleading if used isolated (SUMANTH, 1994). An adequate conjunct of partial measurements can, however, be useful to a company, especially in the factory, but all the limitations should be known.
Severiano Filho (2008) cites the Simple Factor Productivity (SFP) as a measurement of partial productivity, because relates measurement of production with only one input used in the productive process, such as capital, machine, energy, man, being the last one the most referenced. The total factor productivity (TFP) is the ratio of the liquid output (total production minus intermediate goods and services purchased) to the sum of the labor associated to the capital input This kind of productivity is many times referred as the productivity of value added or multi-factor productivity.
The TFP provides a good image of the global productivity or of a process or company. A great advantage of TFP is that it describes the substitution capital-work, what is not capted by the measurement of partial productivity. Another advantage is the possibility to be used to compare different companies.
The disadvantages are the difficulties to understand and measure (GROSSMAN, 2003). Due to these difficulties, are not always accurated. Tangen (2004) says that the measurements of TFP are based in some assumptions, and may produce different result duet to many different ways of weighing the factors of production. The author also highlights that is harder to control activities that enchance the productivity with the measurements from TFP and that this measurement does not capture the impact of materials and energetic inputs, what means is not adequated when a great portion of production costs is represented by materials or energy.
The measurements of total productivity are relationships of total production to the sum of all inputs factors. Are very similar to the measurements of TFP, but also include intermediate goods, like acquired materials and energy, what makes the measurements more accurate. Another kind of productivity is based in time. This measurement is recommended by Arnold (1991) when the definition of outputs and inputs is though mainly when the company is varying the models of a unique product, or even different models of a certain number of products. When this variation happens, a common unit may don't exist.
Tangen (2004) emphasizes that this issue is generally solved with the use of the monetary politic, but this strategy means measurements of productivity influenced by the factor of recuperation of prices. Arnold (1991) suggests, therefore, that the unit of time can be used in the case of many products are being produced. In this case, time is a common unit for all products. The author adds that the content of the work of a product is expressed as a necessary time (standard time) to make the product using a determined manufacturing method. In this sense, Jackson e Petersson (1999) purpose a measurement of productivity completelu based on time. They define productivity as the relationship between the time of added value and the total time available.
Tangen (2004) lists some advantages to the use of the measurement of productivity based in the time: facilitates the measurement, comprehension, comparison between workshops (independently of the structure of costs) and the comparison between the countries (independent of the currency) and in the manufacturing of the device. There is a linear relationship between time and cost. However, Tangen (2004) questions of a totally time based measurement can be classified as a real measurement of productivity, once the total time does not provide information regarding the consumed resources during the transformation process of manufacturing.
3. Methodology purposed to measure the productivity
The first step to develop the methodology to measure the productivity pass necessarilly through the presentation of the substations maintenance activity as a process, according to the Figure 2.

Figure 2 – Substations maintenance activities as a process
Source: Direct research.
It can be observed in this process, that the production output is the maintenance service performed and the inputs are the traditional resources used (workmanship, capital goods, materials and energy). As the objective of this research is to discuss the productivity of substations maintenance team, only the workmanship input was adopted.
This work used the concept of engineering within three categories which the concept of productivity is inserted (technological, of engineering and economist), as adopted by Ghobadian e Husband (1990), due to the interest in verify the relationship between production and the potential of this workmanship. The measurement technique adopted was the measurement of index, because it is the simplest way to measure the productivity and will call attention to trends of performance issues.
Finally, two types of measurements of productivity were used: the simple factor measurement of productivity, because it is only an input factor (workmanship), and the measurement of productivity based on time – relationship between value added of time (VAT) and total time available for production (TTAP). This last type of measurement is suggested by Arnold (1991) when there is a high variety in the output (production), what is the case of substation maintenance services. To these two variables (VAT and TTAP) the related resources will be allocated once. In this case, the resource is the workmanship.
The second step to develop the methodology to measure the productivity was, therefore, combine the approach to the concept of productivity (engineering approach), with the technique of measurement (measurement of indices) and with the two kinds of measurements of productivity (simple factor productivity and time-based productivity) adopted in this study. The Figure 3 presents this combination to obtain the calculation formula to measure the productivity.
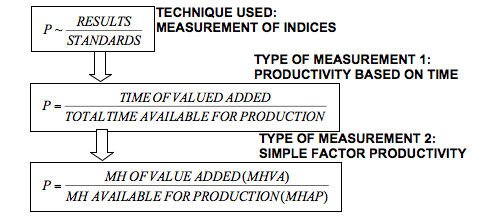
Figure 3 – Calculation formula of productivity in the research
Source: Direct reseach.
According to the Figure 3, from the technical choice of measurement of productivity through indices, is the general measurement of productivity (P) which is obtained through a relationship between the results obtained in a process( substations maintenance activities) and the results from this same process of production. The chosen technique is align to the approach of the concept adopted in this work for productivity.
Then, applying the time-based type of productivity measurement, it is obtained that the productivity is the ratio between time of value added ( time used to perform the services of maintenance – and the total time available to production.
As the goal of this research is to measure the productivity of substations maintenance teams, the concept of partial productivity was used, because only one input factor of production is considered (workmanship). In this sense, the calculation formula of productivity based on time is allocated to the workmanship, resulting in the calculation formula used in this article, given as the Man-Hour of valued added (MHVA) and the Man-Hour available for production (MHAP).
3.1. Developing the methodology to measure the productivity
The third and last step to develop the methodology to measure the productivity purposed in this article consists basically in the formulation of the following indicators: MH available for production, MH intentionally available, MH working in the maintenance, deviated MH and standard MH. The Figure 4 presents the composition of these indicators.
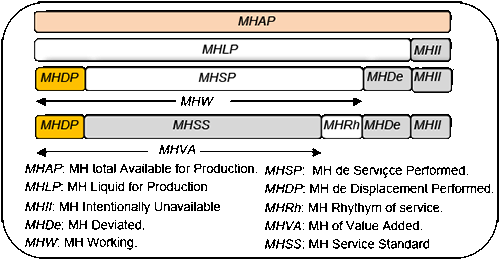
Figure 4 – Illustration of indicator associated to the productivity
Source: Direct research.
The MHAP represents the amount of hours available to work times the number of workers that compose the maintenance team. The MHII represents the gross amount of hours dedicated to other non-related to the maintenance activities times the number of workes involved. These are mandatory activities requested by the manager such as meetings, trainings, etc.
The MHLP is the amount of liquid hours available to the work times the number of workers that compose a maintenance team. This amount is obtained by the difference between the MAHP and the MHII:
MHLP = MHAP – MHII. (1)
The MHDe is the amount of hours not associated to maintenance activities or intentionally unavailable by the manager times the number of workers involved in the maintenance team. The MHDe represents the MH involved in activities that does not add value to the maintenance.
The MHSP is the amount of service performing hours times the number of workers involved on these services. However, the MHDP is the amount of hours dedicated to team displacement times the number of workers involved on the services. According to the Figure 4, the the MHW is the sum of MHSP with the MHDP, which can also be obtained byu the difference between the MHAP and the sum of MHII with MHDe:
MHW = MHAP – (MHII + MHDe). (2)
The two last variables represented in the Figure 4 are the MHSS and MHRh. The MHSS represents the product between the amount of estimated hours to perform a maintenance form and the number of workers involved in this service. This variable can also be obtained by the difference between the MHSP and MHRh:
MHSS = MHSP – MHRh. (3)
The MHRh is associated to the service performing rate. It is zero if MHSP=MHSS, what means the MH related to the service performed was equal to the estimated MH to he service.
This way, it is seen that the value of MHSS is obtained by a prediction of standard MH to perform a service. The MHRh value, however, can be obtained by the equation (3), using the determined MHW and MHSS values.
To obtain the substation maintenance teams prouctivity value, according to the established equation (see Figure 3), the MH of added value (MHVA) and the MH available for production should be found. Considering that the MHVA is associated to the MH which has generated value to the maintenance services, or in other words, the unproductive MH excluded from the MH available to production, is found:
![]() . (4)
. (4)
As the unproductive MH is composed by MHII, MHDe and MHRh, according to the Figure 4:
![]() (5)
(5)
![]() . (6)
. (6)
So, as it is seen in Figure 4, the equation (6) numeration is equal to the sum of MHDP and MHSS. Therefore, the productivity value is:
![]() . (7)
. (7)
It is important to know that, in this case, the teams must be displaced to the substations to perform their activities and, thus, the MH involved should not be despised. As it is seen in the equation (7), two parts compose the MHVA: the first one related to the displacement and the second one related to the standard MH of maintenance service. In this case, the MHVA can be defined given by:
![]() , (8)
, (8)
where:
- MHSSi is the standard MH ith service;
- MHDPk é o MH do kth displacement performed;
- n is the amount of services performed;
- m is the amount of displacement performed.
As both units in the two terms of the equation (7) are equal, the productivity value is given in %. If the MHVA is the same as the MHAP, the productivity is equal to 100%. The productivity should be monitored preferably through daily charts to identify trends.
4. Use of the purposed methodology to measure the productivity
The case study occured in the power suppliers substantions maintenance from a Brazilian company. To simplify the application of the developed methodology to measure the productivity, the research was restricted to 6 maintenance teams during 2.5 months, involving the termovision, equipment maintenance and transformers activities. Each maintenance team is normally composed by four people, but the number of staff may vary according to the type of service to be performed. The workload of each team is eight daily hours, with rest on Saturday and Sunday.
A survey of possible services to be performed was made in each component (equipment or installation) from the substation and the number of people displaced to perform it. 281 types of maintenance services in substations were counted. In the company analyzed, from all set of services in the maintenance, only the emergency services were not inclued in this verification as a result of the difficulties to establish standard times to diagnose varied situations of abnormalities in the equipments.are
The indicators related to productivity established in the Figure 4 were obtained by the use of dynamic sheets on Microsoft Excel through the data from Data Sheet Iput. The Figure 5 represents the general result accumulated from these indicators.
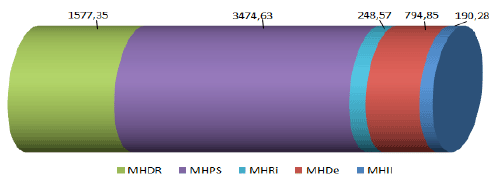
Figure 5 – General results from indicator associated to the productivity accumulated during 2.5 months
Source: Direct research.
The Figure 5 represents the practical result obtained according to the methodology used to reach these indicators, as seen in Figure 4. The sum of MHII, MHDe, MHRh, MHSS and MHDP is equal to the MHAP, which totalized 6285.68 MH during the measurement time of 2.5 months.
Actually, to explain better value of indicators related to the productivity presented in the Figure 5 and its critical analysis, it is necessary to observe these indicators and its evolution over time, what is following.
4.1. MHII and MHLP measurement.
By Figure 5, it is observed that the MHII value was 190,28 MH, representing 3.0% of MHAP. That means 3.0% from the substation maintenance team's MH were spent in intentionally unavailable imposed activities by the managers. Using the equation (1), the value of MHLO is equal to 609.4 MH, or, in other words, 97.0% of MHAP was unavailable after eliminating the intentional unavailability from the company.
The MHII refers the unavailabilities as related to the meeting, dialogues, daily security diaries and administrative activities, as shown in the Figure 6.
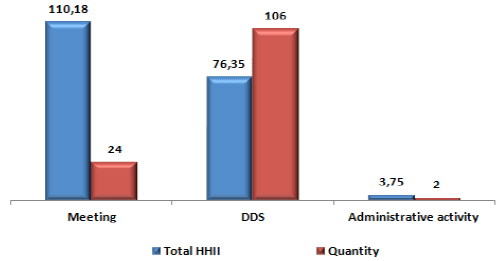
Figure 6 – Types of registered intentional unavailability during the research
Source: Direct research.
According to the blue bars in the Figure 6, meetings were responsible for 57.9% from total MHII value with 110.18 MH, the DDS (Daily Dialogue on Security) for 40.1% with 76.35 H=MH and the administrative activities for 2.0% with 3.75 MH. But according to the red bars in this same figure, the number of unavailabilities is represented by 24 meetings, 106 DDS and 2 administrative activities.
4.2. Measuring MHDe and MHW
It is seen in the Figure 5 that the MHDe value was 794.85 MH (12.6% of MHAP), what means the maintenance teams have passed in average 12.6% from their available time to production performing actions which do not add value to the maintenance.
By adding MHII with MHDe, is observed that 15.7% from available MH to maintenance services in the company were spent in other non-related to the maintenance activities. The other 84.3% of MHAP is equal to the MHW, according to the equation (2),which represents the MH spent in the displacements, inherent to the maintenance process of substations in the present company.
In order to analyze the temporal evolution of the percent MHDe related to the MHAP during the research, the concept of Statistical Control of the Process (SCP) was used to project a Control Chart from Shewhart to the individual measurements following the Montgomery instructions (2004). This chart is presented in the Figure 7 and has shown the following control parameters:
- Lower Control Limit (LCL):
![]() then
then ![]()
- Upper Control Limit (UCL):
![]() then
then ![]()
Where,
![]()
 , is the mean of the mobile amplitude from MHDe (%).
In this case, A2=2.66, because the sample by day has the size n=1 and d2=1.128 is a pre-defined value for n=1.
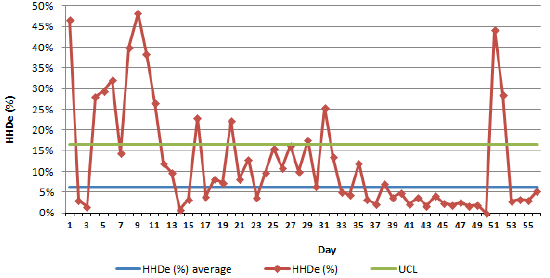
Figure 7 – Control chart that represents the percent MHDe during the research
Source: Direct research.
On the chart represented in the Figure 7, the days 1, 4, 5, 6, 8, 9, 10, 11, 16, 20, 31 51 and 52 were not considered, because as it is seen they are spots above 20% and are considered atypical. In this sense, the calculated mean of MHDe was 6.3% and the Upper Control Limit [4] (UCL) was of 16.5%. Besides that, the Lower Control Limit (LCL) was not drawn, once the goal is minimize the value of MHDe in the maximum.
In this chart, 14 spots above the UCL are observed, what means that during those days special situations occurred and caused excessive wastes in the activities that do not add value to the maintenance function. In the first day, for example, there is a high percent MHDe, with 46.7% (45.6 MH), what is associated to a special cause: adverse climatic conditions, rain in this case.
Those adverse climatic conditions include high humidity and rain, what prevents from performing most of the maintenance services. They hide and mask the results during the tests, committing people's safe while working in the energized network and may expose part of the equipment to the water.
The car unavailability was another special cause very present which appeared in 7 days according to the Table 2. As the car is an indispensable resource to the maintenance teams and in the company has its own cars, a special management should act in order to promote an adequate maintenance on the substations.
A special cause verified two times was the car loading/unloading with materials. Actually, this is a cause considered as common and very present in the routine which spends 1.6 MH in average per happening. But in this case, it is being considered special because on the days 8/6 and 9/10/10 were spent 6 and 3.2 MH in average, respectively. On those days, therefore, 3 and 5 occurrences happened, respectively.
Another two causes were also presented in the Table 2: Awaiting the Operations Center and Service canceled by the own Operations Center. The first case is associated to the fact that was a slow traffic of activities in the Operations Center, what prevented the service to be authorized quickly. In the second case, there was an issue on the electric service what precluded the previously programed service.
In the Figure 8, a chart with the total MH spent by type of deviation occurred during the 2.5 months of research is presented.
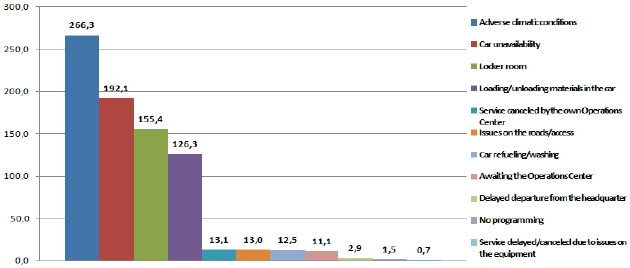
Figure 8 – Amount of Mh by type of deviation registered in the research
Source: Direct research.
It can be observed in the Figure 8 that the four first kind of deviations were responsible for 740.1 MH, what corresponds to 93.1% from the total registered MHDe during the 2.5 months of field research, which are: adverse climatic conditions with 266.3 MH (33.5%), car unavailable with 191.2 MH (24.2%), locker room with 155.4 MH (19.5%) and car loading/unloading with 126.3 MH (15.9%).
The locker room deviation refers to the necessary routine of changing clothing in the beginning and in the end of their daily activities.
With the application of the methodology in the company, a clear vision of what should be directed by the maintenance teams' managers was exposed. Regarding the occurred deviations, it is clear the need to prioritize the actions to minimize the MH spent by the deviations: adverse climatic conditions, car unavailable, car loading/unloading and locker room.
The other counted deviations in the research totalize 6.9% from the total MHDe. They are:
- Service canceled by the own Operations Center (13.1 MH), refers to the services which were not authorized by the operations area due to lack of requisites or due to insecurity to the electric system;
- issues on the roads/access (13.0 MH), refers to problems in the traffic that difficult to go to somewhere;
- car refueling/washing (12.5 MH), is related to the time necessary to keep the car completely fueled and clean to use;
- awaiting the Operations Center (11.1 MH), is associated to delays on the Operations Center while authorizing the beginning of the services;
- delayed departure from the headquarter (2.9 MH), happens when there is a delay in the arrival of some component which leads to a delay in the team departure;
- no programming (1.5 MH), refers to the period when there were not programmed activities to the team;
- service delayed/canceled due to issues on the equipment (0,7 MH), is related to some problem in the equipment of the electrical system that leads to a delay in the beginning of the service or in its cancellation.
4.3. Measuring the MHDP
Looking again to the Figure, it is verified that the value of MHDP, by itself, was of 1575.35 MH (25.1% from MHAP), what demonstrates a significant representativeness of available MH to production. This data shows the importance to optimize the maintenance teams' route in order to spend the minimum time during the displacements to the substations. This optimization is possible when the maintenance can be programed, except in the case of emergency services. So, the most important thing is to focus in preventive and predictive maintenances.
In this work, therefore, the displacements are part of the process of production, since it is performed to maintenance services. When the displacement is not performed to maintenance services, it should be considered a deviation.
This article did not study a specific methodology to reduce MHDP. It is suggested a study in order to verify the economic viability of descentralize the teams' bases to reduce the displacements, and consequently, the value of MHDP.
4.4. Measuring MHSP, MHSS e MHRh
The value of MHSS 3474.63 MH (55.3% from MHAP) added to the value of MHRh of 256.57 (4.1% from MHAP) totalizes 3731.2 (59.4% from MHAP), what is the MHSP. It represents that, in average, the maintenance teams spent 59.4% of their time performing maintenance activities directly. Even more, the MH spent to perform the maintenance services is, in average, above the standard MH predicted to those services, with a difference represented by 4.1% from MHAP.
In order to analyze the temporal evolution of the percent MHRh related to the MHAP during the research, a Control Chart of Shewart was projected to the individual measures, following the Montgomery's orientations (2004). This chart is in the Figure 9 and presented the following control parameters:
- Lower Control Limit (LCL):
![]() then
then ![]()
- Upper Control Limit (UCL):
![]() then
then ![]()
Where,
![]() ,
,
 , is the mean of the mobile amplitude from MHRh (%).
In this case, A2=2.66, because the sample per day is n=1and d2=1.128 is an absolute value tabulated to n=1.
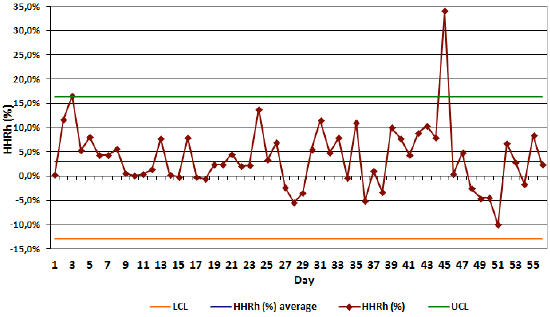
Figure 9 – Control chart that represents the percent MHRh during the research period.
Source: Direct research.
On the chart, the day 3, 24, 45 and 51 were not considered because the spots are above 12% and are considered atypical. In this case, the MHRH value (%) means the MH spent to perform the services was smaller than the MH predicted as standard to perform the services.
Two spots above the UCL are seen in the chart, what means, according to the Statistical Control of Process concepts that special (atypical) causes happened. (MONTGOMERY, 2004).
When those special causes occur, one of those two facts are signalized: very low/high performance of the maintenance teams while performing the services, resulting in a very smaller/greater MHSP compared to the MHSS, or the MHSS of any service may be wrong predicted wrong instead of the services has been performed wrong. When this last fact occurs, the services that presented a high MHRH should have their MH re-estimated.
4.5. Measuring the Productivity
With all the indicative results defined in the Figure 4, it is possible to calculate the value of productivity, according to the equation 3. This way:
![]()
The global value of productivity P are presented in the Table 5 and were calculated according to the values of MHVA, MHAP, MHLP, MHW, MHSS e MHSP obtained in the Figure 5
It must be emphasized the values obtained in the Table 5 refer to the amount regarding 2.5 months of field research. By the presented methodology, the global value of productivity of the substations maintenance teams is 80.4%. That means a 80.4% of performance in workmanship resources.
Despite all values of productivity and verification items obtained during the 2.5 months provide a result regarding the maintenance teams performance, those variables are better analyzed when is verified through the time, indicating and showing possible trends in the process.
In order to analyze the temporal evolution of productivity, a Shewart's Control Chart was projected to the individual measurements, following the Montgomery's orientations (2004). This chart is presented in the Figure 10 and presented the following parameters of control:
- Lower Control Limit (LCL):
![]() then
then ![]()
- Upper Control Limit (UCL):
![]() then
then ![]()
Where,
![]()
 , is the mean of the mobile amplitude of P
In this case A2=2.66, because the sample by day was n=1 and d2=1.128 is a tabulated value for n=1.
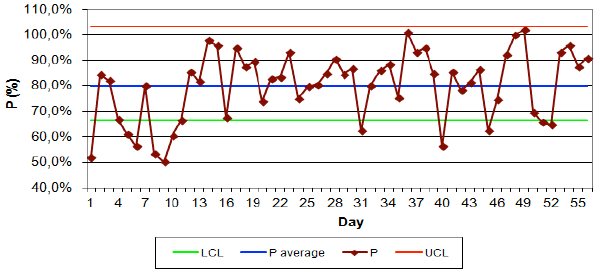
Figure 10 – Productivity (P) Control Chart during the research time
Source: Direct research.
In the project of the control chart presented in the Figure 10, the days with low (under 70%) and very high (above 100%) productivity were disconsidered and classified as atypical days. Then, the calculated mean of P was 84.49%
On days when the value of productivity was over the limit controls an atypical situation occurred regarding the percent of intentional unavailability, deviation or rhythm of services performing.
It is highlighted that the monitoring may be performed in order to compare the teams and process performance.
5. Conclusions
The purposed productivity equation resulted in the relationship between production and workmanship potential. To be accurate, productivity is given by the relation between the MH of added value (MHVA) and the available MH to production (MHLAP). In conclusion, the inputs and outputs of the process in MH were necessary due to the wide range of maintenance services. Observing the purposed methodology, the prediction of standard MH in essencial, once mistakes may lead in wrong values for teams productivity.
The estimation of MHSS was performed by a technique of analytical prediction, which is based in the knowledge and experience of the involved elements. In this case, historical data were used to base this estimation. If a historical base is not available for some service, a field measurement of MH for this service is suggested to be used as standard.
This estimation technique may be applied to the case of substations maintenance process, but not to repetitive and short duration activities. In this case, the direct timing method approached by Barnes (1977) may be used.
The methodology purposed in this article can be used not only to measure the substations maintenance teams productivity, but also to evaluate another activities from the sector of services, since following two situations: standardized services and non-repetitive/short duration services.
It is highlighted, however, that the use of this methodology in other sector of service should be adapted to the particularities of each sector, with the specifc kinds of deviations and intentional unavailabilities found, as well the displacements to perform those services.
Regarding the result from the global measurement of the indicators associated to productivity, the MHAP was composed by the following portions: MHII with 3%, MHDe with 12.6%, MHRh with 4.1%, MHSS with 55.3% and MHDP with 25.1%. The conclusions regarding this are bellow.
Teh expressive value of MHDP means that during the period of the research 25.1% of the workmanship resource to substations maintenance was spent with teams displacements between substations.
By the methodology purposed in this article, the value of productivity is not sensible to a reduction or increase of MHDP. What is sensible is value of maintenance production. It is considered in this methodology, therefore, the displacements between substations is an activity of the process.
The low value of the MHRh also signalizes the definition of the standard service MH (MHSS) were well estimated. As the purposed methodology will be applied and reaching more maturity, the MHSS will be more and more adjusted due to historical records.
Regarding the global value of productivity reached during the research time, 80% is a very good value to the researched company due to the short time of application of the methodology. Besides the global results presented, the daily temporal evolution of the productivity and its associated indicators must be monitored. This daily monitoring may be assisted through a Control Chart to the individual measurements, projected to alarm when special causes occur in the monitored indicator.
Analyzing the results of productivity and its associated indicators, the purposed methodology lead to an improvement of productivity through four ways: reducing MHDe and MHII; reducing MHRH; reducing MHDP; and gradually reducing the standard MH of maintenance services, what matches with the theory suggested by Enflo (2009), developed in Sweden which showed better index of energetic productivity are reached in those branches that use electricity to multiple purposes, as the supply.
With the deviations reduction and optimization of the intentional unavailabilities, more MH will be available to perform the maintenance service itself. The deviations may be reduced adopting strategies that can eliminate or reduce wastes identified in the Figure 22.
The intentional not availabilities may be reduced determining a target and performing a planning of training, meetings and DSS that may be useful to improve the integration and teams capacitation, but do not commit the productivity. During the research time, no training was performed.
Reduce the MHRH means invest in the workmanship qualification and motivation. In other words, is necessary to have an effective management of the human resources in the maintenance to be performed by the executive area. Reduce the MHDP means optimize a route of necessary displacements to perform the maintenance with maintenance programming predictive and preventive. It is the role of the maintenance engineering and the Operational Research may assist on it.
The last form of productivity improvement is the gradually reduction of standard MH for each service. It is reached through an improvement in the techniques and work tools, what is role of the engineering and maintenance executive areas. The following advantages were noted by applying the purposed methodology to measure the substations maintenance teams' productivity:
- Simplicity of understating by people involved in the work, due to the clear separation of what means productivity and unproductivity MH.
- Easy application regarding the used resources.
- Identify and quantify factors in the production that impact directly the value of workmanship productivity.
- Alarm the managers when a there is a special situation in the process. It is regarding the Statistical Control of the Process provided through Control Charts.
- With the stardard MH of services well established, the capacity planning is facilitated, once is possible to determine which is the necessary teams sizing to face the maintenance services needs.
- Provides oportunities of continuous, once encourages the workers to find better work techniques to reduce the stardard MH of services.
- Motivation: a reconizing system may be used adopting objective criteria according to the teams productivity achievements.
- Provides a comparison between teams, facilitating performance evaluations and leading action to improve the teams.
- Guides the allocation of resources to where are the GARGALOS of production.
According to the results reached in this work, some limitations in the purposed methodology. They are listed bellow:
- Control of the displacement MH performed (MHDP): no way of MH control associated to the displacements was presented in the performed application, what represented significant 25.1% from total MH during the research. Two actions were suggested to control the MHDP: the first one refers to the control of the displacement rhythm through established displacements standards, and the second one refers to the optimization of the teams' routes according to the Operational Research application.
- Comparison of productivity between companies: it is not possible to compare the productivity in two distinct companies if the standard MH of services are different in each one. That leads to the need of use the lower standard MH of a service among the companies, serving as a kind of benchmark to be reached and improved by them.
- Application in the corrective maintenance of emergency: it is very tough to apply the purposed methodology to corrective maintenance of emergency because in those cases it is very hard to establish the standard MH by the diversity of situations that may be found on the equipment. As the corrective maintenance are eventual related to the other kind of services, a MHRh=0 is suggested if a standard Mh of service is not defined in these cases. This way the result of teams productivity will not have a significant influence.
Hopefully, this work will contribute to the Services Sector, mainly to the Electrical Sector, in order to help in the management and, consequently, to obtain real productivity gains.
Referências
ABBOTT, Malcolm. The productivity and efficiency of the Australian electricity supply industry. Energy Economics 28, 444–454. 2006.
ARNOLD, J. Introduction to materials management, Englewood Cliffs – NJ:Prentice-Hall Inc, 1991.
BERNOLAK, I. Effective measurement and successful elements of company productivity: The basis of competitiveness and world prosperity. International Journal of Production Economic, v. 52, p. 203-213, 1997.
CORRÊA, H. L.; CORRÊA, C. A. Administração de produção e operações: Manufatura e Serviços: uma abordagem estratégica. São Paulo: Atlas, 2005.
ENFLO, Kerstin. KANDER, Astrid. SCHÖN, Lennart. Electrification and energy productivity. Ecological Economics 68, 2808–2817. 2009.
ESTACHE, Antonio. TOVAR, Beatriz.TRUJILLO, Lourdes. How efficient are African electricity companies? Evidence from the Southern African countries. Energy Policy 36, 1969–1979, 2008.
GALARNEAU, D.; MAYNARD, J. P. Measuring Productivity, Perspectives, Statistics Canada Catalogue 75-001E, 1995.
GHALAYINI, A. M.; NOBLE, J. S., The changing basis of performance measurement, International Journal of Operations and Production Management, v. 16, n. 8, p. 63-80, 1996.
GHOBADIAN, Abby e HUSBAND, Tom. Measuring total productivity using production functions. lnternational Journal of Production Research, v. 28, n. 8, pp.1435-1446, aug. 1990.
GROSSMAN, E., How to measure company productivity: Handbook for productivity measurement and improvement, Cambridge: Productivity Press. 2003.
HAYES, R.H.; CLARK, K.B. Why some factories are more productive than others, Harvard Business Review, v. 64, September-October, p. 66-73, 1986.
JACKSON, M.; PETERSSON P. Productivity – an overall measure of competitiveness, Proceedings of the Second Workshop on Intelligent Manufacturing Systems, Leuven, Belgium, p.573-581, 1999.
JOHNSTON, R.; JONES, P. Service productivity: Towards understanding the relationship between operational and customer productivity. International Journal of Productivity and Performance Management, v.53, n.3, p.201-213, 2004.
KUROSAWA, K. Productivity measurement and management at the company level: the Japanese experience, Advances in industrial engineering, v. 14, Elsevier science publisher, 1991.
MCLAUGHLIN, C.; COFFEY, S. Measuring productivity in services". International Journal of Service Industry Management, v. 1, n.1, p.46-63,1990.
MORAIS, Tercius Cassius. Um modelo para medição da produtividade da mão-de-obra: estudo de caso em equipes de manutenção de subestações. Dissertação. PPGEP. UFPB. João Pessoa. PB. 2012.
MONTGOMERY, D. C. Introduçãoao controle estatístico da qualidade. 4. ed. RJ: LTC Editora, 2004.
SEVERIANO FILHO, C. Produtividade & manufatura avançada. João Pessoa: Edições PPGEP, 2008.
SINGH, H.; MOTWANI, J.; KUMAR, A. A review and analysis of the state of the art research on productivity measurement, Industrial Management and Data Systems, v. 100, n. 5, p. 234-241, 2000.
SMITH, E. A. Manual da produtividade: métodos e atividades para envolver os funcionários na melhoria da produtividade. Rio de Janeiro: Qualitymark, 2003.
SUH, N. The principles of design, Oxford series on advanced manufacturing. New York: Oxford university press, 1990.
SUMANTH, D., Productivity engineering and management. New York: McGraw-Hill Inc., 1994
TANGEN, S. Evaluation and revision of performance measurement systems. Doctoral Thesis - Department of Production Engineering, Royal Institute of Technology. Stockholm, Sweden. 192f - 2004.
TANGEN, S. Demystifying productivity and performance. International Journal of Productivity and Performance Management. v. 54, n. 1, p. 34-46, 2005.
TOVAR, Beatriz. RAMOS-REAL, Francisco Javier. ALMEIDA Edmar Fagundes de. Firm size and productivity. Evidence from the electricity distribution industry in Brazil. Energy Policy n39, 826–833. 2011.
WANG, Chunhua. Decomposing energy productivity change: A distance function approach. Energy 32, 1326–1333. 2007.