Espacios. Vol. 36 (Nº 09) Año 2015. Pág. 18
Application of Technological Intelligence Tools and S-Curves in a Foresigth Evaluation Regarding Biodegradables Packaging and Environmentally Friendly Up to 2032
Aplicação de Ferramentas de Inteligência Tecnológica e S-Curves em uma Avaliação Foresigth Quanto Biodegradáveis Embalagem e Ambiente Amigável para 2032
Jhon Wilder ZARTHA Sossa 1; Hector Samuel VILLADA Castillo 2; Andres Felipe AVALOS Patiño 3; Bibiana ARANGO Alzate 4; Luciano Amanda Lucía FERNANDEZ Pérez 5; Gina Lía OROZCO Mendoza 6; Rafael BERMUDEZ Ortega 7; Raúl HERNANDEZ Zarta 8; Diego Fabián JOAQUI Daza 9; Alcy René CERÓN Mosquera 10; John Fredy MORENO Sarta 11
Recibido: 29/01/2015 • Aprobado: 14/02/2015
Contenido
5. Technological intelligence Results
ABSTRACT: |
RESUMEN: |
1. Introduction
Biodegradable packaging is in increasing demand, the market is raising awareness about the importance of this kind of materials and the impact they can have on the environment. The demand has accelerated the scientific interest in the subject, generating a wide range of technologies and materials suitable for its development, such dynamic can be seen in the number of papers and patents related to the topic. The main objective of this work was to contribute through tools such as the Technology intelligence and S-curves in building the technology tree which was the first input for the foresight study through Delphi, new commodities / technologies / innovations biodegradable packaging technology up to 2032.
2. Technology intelligence
"Technology intelligence is an organized, selective and permanent process of capturing information from abroad and within the own organization about science and technology, in order to select, analyze, disseminate and communicate it to turn it into knowledge to make less risky decisions and to anticipate changes "AENOR (2006)
Palop and Martinez (2012), say in their methodological Practice Guide of Technology intelligence and Competitive Intelligence: Having clarity of the organizational environment facilitates the implementation of activities to achieve the strategic objectives and achieving goals in certain periods (short, medium and / or long term). Indeed, this is the effective contribution of (VI / CI), then this process is important because:
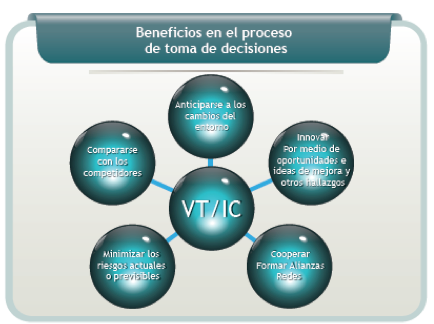
1. It helps the process of making decision strategically expanding the perspective of the organization, to detect events that may affect the organization.
2. Organizations can beneficially anticipate changes proactively avoiding reactionary decisions tendency affecting the sustainability of the organization.
3. It reduces the risks and uncertainties that may occur in the process of making.decision
In Figure 1, some of the benefits about the implementation in the making decision process are illustrated.
Figure 1: Adapated from Palop y Martinez (2012)
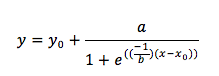
3. S-curves
Since years ago, academics, researchers and entrepreneurs have tried to understand the behavior of the technology over time as well as strategies that can be implemented according to each specific phase of its career, some alternatives to analyze technology over time are models of S-curves. (Kucharavy & De Guio, 2007), (Zartha, et al. 2009), (Pérez, 2001), (Ortiz and Pedroza, 2006), thus is possible to identify whether a technology is emerging, starting, central (key), mature or declining (figure 2) and whether is necessary to establish a monitoring strategy, selective investment or non over-investment in certain technology and establish its phased behavior: Initial Dissemination, early groh, slow groh and technology maturity (Figure 3).
In studies related to the usage of S curves, different stages or phases are identified, bounded by specific points in their groh. This evolution has been studied by authors like Nelson and Winter (1977), Dosi (1982), Pérez (2001), amongst others. Ortiz and Pedroza, (2006) describe the evolution of a technology and its trajectory by means of the S curves. (Figure 2).
Figure 2: Technology state
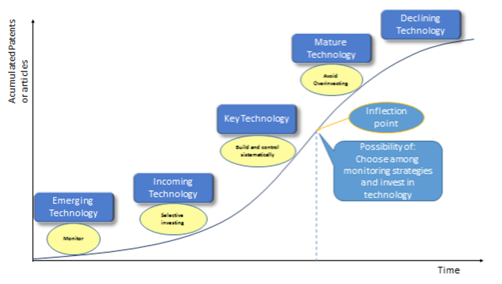
Source: Evolution of a technology. Adapted from (Ortiz y Pedroza, 2006)
The curves obtained can be correlated with the existent information about the type of technology (emerging technology, edge technology, key technology and base technology) and the decisions that can be made based on the different types (figure 3).
Figure 3: S-curves stage. Maturity level
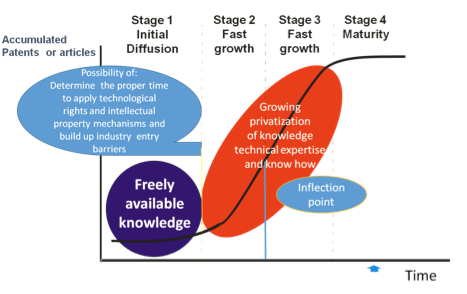
Source: Adapted from Pérez (1992)
The S curves method, given its easy practice, has become a widely used tool in a broad range of applications, now that using it shows appropriate forecast results in a wide spectrum of systems (Ávalos, Bermúdez, Zartha, & Ávalos, 2012).
Different authors have estudied the S- curves applied in the analisys of the disseminate technological Innovations, they divided it in four stages and suggested the estrategies to be implementted in each stage. Pérez (1992); Fernández (2005); White and Bruton (2007).
On the other hand, it is known that the technological diffusion to describe an S graphic way and its compound by different stages that belong to many innovation strategies that should be applied with the pourpose of improving the efficiency and application on innovation. Different mathematical models can be adjusted in the curve and the statistical variables obtained are used for making conclusions on the topic. Zartha et al. (2014); Cortés et al. (2013); Ávalos et al. (2011).
4. Metodology
The SCOPUS database was used to search for biodegradable packaging scientific papers and
Freepatentesonline was used for patent searching, which includes patent databases of United States, Japan, Germany and WIPO - World Organization of the intellectual property.
Subsequently, the data found were accumulated and processed in the SIGMAPLOT software trough nonlinear regression, a total of 13 models contained in the software were applied, among which: Sigmoidal 3 parameters, sigmoidal 4 Gompertz 3 parameters, Chapman and Hill were applied.
With the results of nonlinear regression, R2 parameter, value t, p value, Durbin Watson (DW) were obtained. Then, based on the values of these parameters, the best adjusted models were chosen and inflection points of the series of papers and patents on biodegradable packaging were calculated, the latest were found by calculating the second derivate.
Figure 4 shows a summary of the methodology
Figure 4: Methodology by technology analisys througth S-Curves.
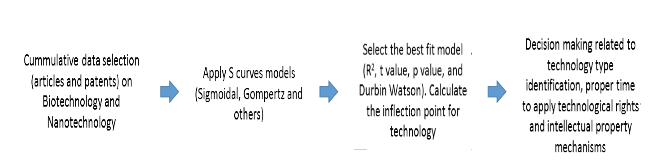
Source: Modified from Zartha S, Palop F, Arango. B., Avalos A, Velez F (2013) S-ANALYSIS AND TECHNOLOGY LIFE CYCLE.
Application in series of data of articles and patents. PICMET 2013.
5. Technological intelligence Results
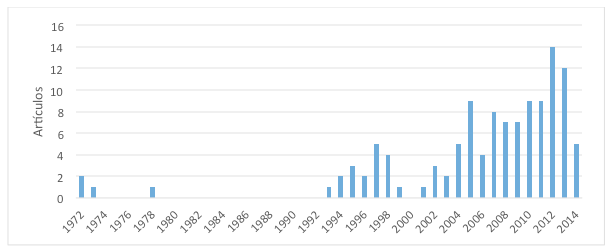
For information search, two databases were used: Scopus and Freepatentsonline; with the first tool, scientific papers were obtained from the search equation: TITLE("bio packaging" OR biopackaging OR (packaging W/3("bio degradable" OR biodegrada* OR "bio polymer" OR biopolymer))) the results were 119 in total. Graphic 1 shows the dinamyc publications in the topic time.
Graphic 1: Publication dinamyc about topic
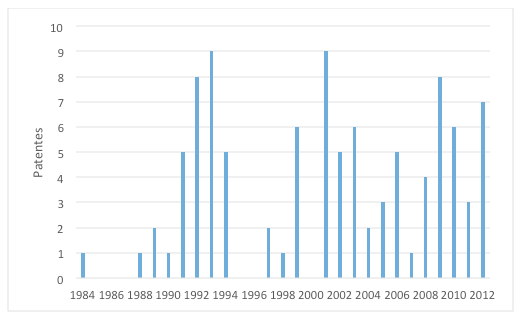
With the freepatentsonline database, the patents were looked up throughout the next equation: ABST/("bio packaging" OR "biodegradable packaging" OR "biopolymer packaging") in this case 100 patents associated with the topic were obtained. Graphic 2 shows the dinamyc about the topic.
Graphic 2: Patents dinamyc about the topic.
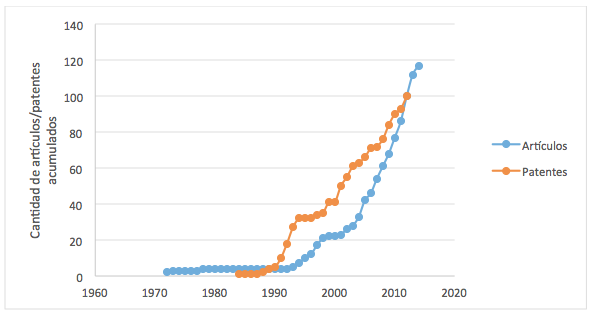
Graphic 3: shows the data series of papers and accumulated patents. The S-curves in the techonology can be observated in the graphic.
Grapic 3: Data series of papers and patents accumulated
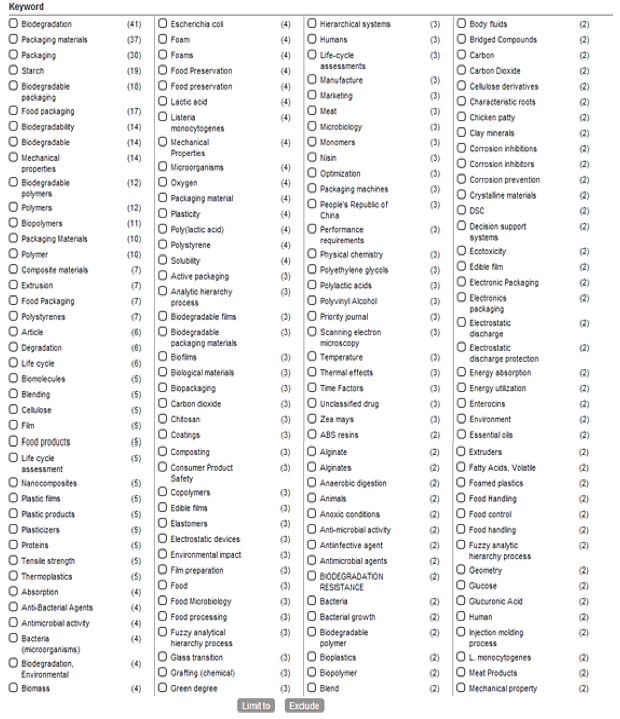
Keywords
After using the search equation in the Scopus Database, keywords of papers found were obtained according to project relevance, which are shown in the table 1 along with its repeability level:
Table 1: Keywords Scopus database
6. S-curves results
The S-curves technology were elaborated with the results of papers data series and the published patents to identify its inflection point. The figure 5 shows the papers S-curve
Figure 5: Papers S-curves
Table 2 shows the results obtained with the 4-parameter sigmoidal model with its correspondent equation, among 13 models used through SIGMAPLOT software, this model had the best statistical adjust
Table 2: Sigmaplot software data obtained for papers
Coeficiente Coefficient |
Error estándar Standard error |
T |
P |
|
A |
416.8140 |
152.2612 |
2.7375 |
0.0094 |
B |
6.3568 |
0.4361 |
14.5751 |
<0.0001 |
X0: Punto de inflexión Inflection point |
2019.5803 |
3.4773 |
580.7835 |
<0.0001 |
y0 |
2.1286 |
0.5842 |
3.6439 |
0.0008 |
R |
0.9981 |
|||
R2 |
0.9961 |
|||
R2 ajusted |
0.9958 |
|||
Durbin-Watson |
0.529 |
Equation 1: 4-parameter sigmoidal
The scientist publications inflection point will be released in 2019
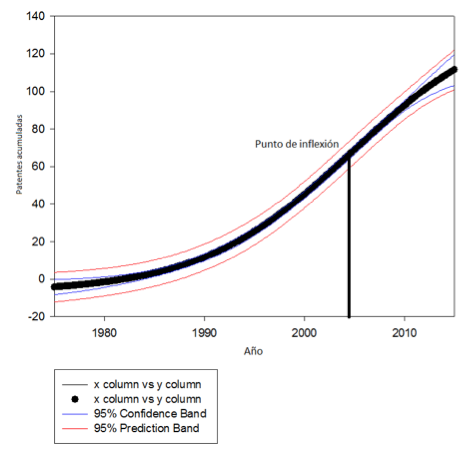
The S-curves technology were elaborated with the results of patents data series, figure 6 shows the inflection point in the curve
Figure 6: Patents S-curve
----
Table 3 shows the results obtained with 4 - sigmoidal parameters, this model had the best values of R2, t value, P value and Durbin Watson.
Table 3: shows the patents results obtained with sigmoidal software
|
Coefficient |
Standard error |
t |
P |
a |
149.0867 |
19.9189 |
7.4847 |
<0.0001 |
b |
7.5908 |
1.0294 |
7.3739 |
<0.0001 |
X0: Inflection point |
2004.6781 |
1.7079 |
1173.7867 |
<0.0001 |
y0 |
-7.1750 |
3.1575 |
2.2724 |
0.0304 |
R |
0.9981 |
|||
R2 |
0.9961 |
|||
R2 ajusted |
0.9958 |
|||
Durbin-Watson |
0.529 |
According to results of SIGMAPLOT software, the patents inflection point occurred in 2004
7. Conclusions
The results between technological intelligence procces: biodegradables packaging papers and patents, and the techonology inflection points estimations were lined up succesfully by giving supporting elements for decisión makers in this knowlegde area.
Two performance parameters were used in the same techonology or knowledge area and inflection points were obtained, this is important because just one parameter; papers or patents had been used in previous studies about S-curves.
With the values obtained in the inflection points in the series of articles and patents, decision making can be made with relation to the type of technology identification before and after the inflection point. Before: emerging technology, edge technology and key technology. After: mature technology and base technology.
In the different stages of technology transfer, or in the operations that can be developed through it, such as: transmission, absorption, usage, learning, accumulation, generation and diffusion, among others. There is always an interest concern about knowing the stage of the analyzed technology, especially if the technology is actually emerging or incoming, or if it is mature or declining instead.
The point of inflection regarding patents occurred in 2004, and scientist publications inflection point will be released in 2019, in the analyzed series, the inflection points for the articles will occur years after the inflection points were obtained from the patents. This may be because, from the beginning of the article's dynamic publishing, the previous existence of information is required, so that it can only be obtained from the first patents, furthermore, it could be explained because of the early stages of the technology life cycle where the researchers found a "mine", or high inventory of new knowledge, that is susceptible to being applied in some industrial sectors, and therefore generate a high dynamic scientific production that can be observed in a high slope, with the curve in the growing stage.
An additional an analysis can be made from the inflection point for the determination of the adequate moment to apply technological right mechanisms and intellectual property. Before the inflection point: technological right mechanisms and intellectual properties are performed. After the inflection point: technical experience and knowledge are available and over costs should be considered to protect new dominant designs that could enter the market.
At last, S curves and their inflection point can help reduce uncertainty in monitoring decisions, when technology is emerging before the inflection point, to not over-invest, and when a technology becomes base after the inflection point.
Recomendations
Working in a future project with three performance parameters: papers, patents and annual publication patent priority, the latest can help to refin and contrast inflection points obtained.
It is fundamental to review alongside experts to be sure that working with patents and articles corresponds to the technology being studied.
References
AENOR (2006). Norma UNE 166006:2006 Ex Gestión de la I+D+i (Sistema de Vigilancia Tecnológica).
ÁVALOS, A., AGUILAR, S., ZARTHA, J. (2011) Curvas en S. Aplicación en innovaciones de tres sectores industriales Colombianos. Revista Espacios. ISSN 0798 1015. Vol. 32 (2) p 21.
ÁVALOS, J. E., BERMÚDEZ, J. L., ZARTHA, J. W., & ÁVALOS, A. F. (2012). Curvas en S - Análisis de tendencias en dos segmentos de la categoría de galletas. III Congreso Internacional de Gestión Tecnológica e Innovación COGESTEC 2012. Medellín.
CORTÉS, I., ZARTHA, J., MÉNDEZ, K., CASTRILLON, F. (2013) Valoración de modelos de curvas en S aplicadas al sector financiero colombiano. Revista Espacios. ISSN 0798 1015. Vol. 34 (3) p 2.
DOSI, G. (1982). Technological paradigms and technological trajectories: A suggested interpretation of determinants and directions of technical change. Research Policy, 2(3).
FERNÁNDEZ, E. (2005). Estrategias de Innovación. Madrid: Thomson.
KUCHARAVY, D., & DE GUIO, R. (2007). Application of S-Shaped Curves. TRIZ-Future conference 2007: Current Scientific and Industrial Reality. Frankfurt.
NELSON, R., & WINTER, S. (1977). In search of a useful theory of innovation. Research Policy, 6(1), 36-76.
ORTIZ, S., PEDROZA, A. (2006). ¿QUÉ ES LA GESTIÓN DE LA INNOVACIÓN Y LA TECNOLOGÍA (GInnT)?. Journal of Technology Management and Innovation. Vol. 1, No. 2.
PALOP MARRO, F. MARTÍNEZ CADAVID, J. F. (2012). Guía metodológica de práctica de la Vigilancia Tecnológica e Inteligencia Competitiva. Valencia y Medellín.
PÉREZ, C. (1992). Cambio técnico, restructuración competitiva y reforma institucional en los países en desarrollo. El Trimestre Económico, n 223, 23-64.
PÉREZ, C. (2001). Cambio tecnológico y oportunidades de desarrollo como blanco móvil. Revista de la Cepal.
WHITE, M; BRUTON, G. (2007). The Management of Technology and Innovation: A Strategic Approach. Thomson Higher Education.
ZARTHA, J., ARANGO, B., HERNÁNDEZ, R., MORENO, F. (2014) Análisis del ciclo de vida de la tecnología a través de curvas en S: Aplicación en operaciones unitarias en alimentos. Revista Espacios. ISSN 0798 1015. Vol. 35 (7) p 1.
ZARTHA J, AVALOS A, URREA S. HERNÁNDEZ F. (2009). Metodología para la medición de innovaciones tecnológicas aplicada a empresas del sector agroindustrial. Biotecnología en el Sector Agropecuario y Agroindustrial, 7(2), 89-98.
ZARTHA, J., PALOP, F., ARANGO, B., VÉLEZ, F. Y AVALOS, A. (2013). S-CURVE ANALYSIS AND TECHNOLOGY LIFE CYCLE Application in series of data of articles and Patents. 3rd Global TechMining Conference. Atlanta, Georgia.
1.Escuela de Ingenierías – Facultad de Ingeniería Agroindustrial. Email: Jhon.zartha@upb.edu.co
2. Universidad del Cauca. Email: hsamuelv@yahoo.com
3. Universidad Pontificia Bolivariana Email: avalosp@gmail.com
4. Universidad Pontificia Bolivariana. Email: bibiana.arango@upb.edu.co
5. Universidad del Cauca. Email: Alfernandez06@gmail.com
6. Universidad Pontificia Bolivariana. Email: Gina.orozco@upb.edu.co
7. Centro Regional de Productividad e Innovación del Cauca. CREPIC Email: jrafaelbermudez@gmail.com
8. Universidad Pontificia Bolivariana. Email: rhernandezz@uqvirtual.edu.co
9. Universidad del Cauca. Email: diego_lds85@hotmail.com
10. Universidad del Cauca. Email: alcyrenecm@yahoo.com.mx
11. Instituto Tecnológico Metropolitano: johnmorenosarta@gmail.com