Espacios. Vol. 36 (Nº 16) Año 2015. Pág. 8
Deployment of requirements for the quality of services in banking correspondents
Implantação de requisitos para a qualidade dos serviços em correspondentes bancários
Maximiliano Camargo RODRIGUES 1; Márcia Elisa Soares ECHEVESTE 2; Luan Carlos Santos SILVA 3; Gilberto Müller BEUREN 4
Recibido: 11/12/14 • Aprobado: 12/08/2015
Contenido
2. Deployment of function quality in services
5. Prioritization of Demanded Quality
ABSTRACT: The deployment tool of the Quality Function (QFD) seeks to achieve the gathering of requirements for the implantation of a new product or service, considering the needs from the client's point of view and the requirements must be identified e connected to the implantation's process of services. This study's objective consisted in listing these needed requirements for the implantation of a business model for the banking correspondents. The methodological procedures involved the collect, record and analysis of all facts related to the problems associated to the transference and sale of merchandise and services from the producer to the final consumer. This can be seen as a step of the deployment of the quality function and had as goal disclose and prioritize the demands of quality, serving as starting point for the deployment of quality. The sampling was divided in two phases: qualitative and quantitative. The first sought to raise more general information and the second uses quantitative methods on its analysis to reach the most detailed level possible. The results show the inclusion of new services as a requirement demanded by the correspondents, which can be considered an innovation in the model, once this market acts with standardized services. This research fills a void in the literature of quality of service e by linking to the banking correspondents. |
RESUMO: A ferramenta de implantação da Função Qualidade (QFD) tem como objectivo a recolha de requisitos para a implantação de um novo produto ou serviço, considerando as necessidades do ponto de vista do cliente e os requisitos devem ser identificados e ligado ao processo da implantação de serviços . O objetivo deste estudo consistiu em listar estes requisitos necessários para a implantação de um modelo de negócio para os correspondentes bancários. Os procedimentos metodológicos envolveram a recolha, registo e análise de todos os factos relacionados com os problemas associados à transferência e venda de mercadorias e serviços desde o produtor até o consumidor final. Isto pode ser visto como um passo da implantação da função de qualidade e teve como objetivo divulgar e priorizar as demandas de qualidade, servindo como ponto de partida para a implementação de qualidade. A amostragem foi dividida em duas fases: qualitativos e quantitativos. A primeira procurou levantar informações mais gerais eo segundo utiliza métodos quantitativos em sua análise para chegar ao nível mais detalhado possível. Os resultados mostram a inclusão de novos serviços como um requisito exigido pelos correspondentes, o que pode ser considerado uma inovação no modelo, uma vez que este mercado atua com serviços padronizados. Esta pesquisa preenche uma lacuna na literatura de qualidade de serviço e ligando para os correspondentes bancários. |
1. Introduction
Due to the lack of access to the traditional banking system for a great population that necessitates banking services, the correspondents have become of major importance for the financial institutions, thus this subject acquired significant importance within the sector. Considering the large number of companies operating in the field, there is need of deeper studies on the subject, because despite the existence of the model, the literature is still scarce.
Brazil is going through several changes in banking sector in the last 30 years. From overcome crises, banks were able to adapt themselves to market adversities in order to achieve good results (Campello, 2004). One of the reasons that contributed to this success was the use of the model of banking correspondents, which became a new way of expansion for the banks, allowing to obtain greater coverage, with new outlets, allowing to reach a share of the population that at another moment had no access to banking services.
The banking correspondents are commercial establishments of any kind, as supermarkets, convenience stores, pharmacies or even registries. All these places, when qualified to provide services offered by a bank are called correspondents. This business model allowed a fast growth (geographically and financially) with lower installation costs (Campello, 2002).
According to SALVIANO JR (2005), these are a few activities that the banking correspondents can develop on its establishments: reception and submission for openings of account of demand deposits and savings accounts, receipts and payments related to accounts of demand deposits, forward or savings as well as investments and withdrawals in mutual funds, active or passive execution of payment orders on behalf of the contractor, receiving and forwarding requests for loans and financing.
From these considerations, the goal of this study was to list the requirements for the implementation of this business model in a financial institution in the state of Rio Grande do Sul. This implementation was performed using the QFD tool with focus on services.
This article is divided into the following theoretical sections, containing information about the company, quality services and QFD (Quality Function Deployment); market research - research methodology with sample size and sampling procedure, qualitative and quantitative research; results - tree of quality demanded, the quality matrix and house roof of quality; final considerations that suggest future research by presenting the case study of the implementation of the results obtained with the method of unfolding QFD requirements. The use of QFD aims to survey the requirements for the deployment of a new service in a specific institution having the need of the point of view of the customers and the requirements must be identified and linked to the process of service implementation.
2. Deployment of function quality in services
The quality of service plays a critical role in the success and survival of companies in competitive market (Kuei and Lu, 1997; Miciak and Desmarais, 2001; Strandberg et al., 2012; Silva et al., 2013). For example, service quality has a positive impact on customer loyalty to the organization (Jayawardhena, 2010) and costumer's intentions (Spreng et al., 2009; Jin et al, 2012). Despite the substantial advantages of current tools and approaches, there's still missing the point of view of customers, their needs and requirements should be identified and linked to the service process (Jin et al, 2014).
Among the various hierarchical levels (strategic, operational or managerial), there is a common feeling that the search for better results, with the highest quality possible (equation often of difficult balancing). On the other hand, company has as its first objective, the profitability of the business and can receive the assistance of tools to identify how to achieve greater profitability (Martins, 2012).
QFD has been applied in manufacturing industries for product development (Miguel, 2005) and marketing (Lu et al., 1994) and is also employed on the service sector (Ghonadian and Terry, 1995; Ramaswamy, 1996; Pun et al, 2000, Kay and Pawitra, 2001, González et al, 2004) to help project and control the service quality. To design well the product or service, the staff needs to know what are projecting, and what end users expect from them (Hamilton and Selen, 2004; Yoonjung et al, 2008; Zillur and Qureshi, 2008; Maritan and Panizzolo, 2009; Silva et al., 2011).
This systematic approach of the tool aims to project, based on a close understanding of customer desires and along with the integration of functional groups of the company. It consist in translate the customer desires to characteristics of construction for each stage of product development (Rosenthal, 1992).
The precursor of QFD and creator of the method, Akao defines it as a method for developing a quality project aiming the satisfaction of the consumer and then translating the consumer demand on project goals and higher quality (Akao, 1990).
According to the author, points of guarantee can be used throughout the production phase using this tool, it is a way to ensure quality while the product or service is still in the design phase. As a very important collateral benefit, the author recalls that, when properly applied, QFD demonstrates reduction in product development time by up to 50% (Akao, 1990).
Ultimately, the goal of QFD is to translate quality criteria often subjective in objectives that can be quantified and measured, which can be used to design products or services.
3. Methodology
The market research, according to Boyd and Westfall (1978), involves the collection, record and analysis of all facts concerning problems related to the transfer and sale of merchandise and services from producer to final consumer. This can be seen as a step in quality function deployment and aims to reveal and prioritize the demands of quality, serving as a starting point for the quality deployment. The result of this research is the main source of information for quality planning (Drumond, 1995).
Figure 1 presents the research framework used for the study of the quality requirements of banking services is described respecting the steps at the macro level. The framework includes the steps of (i) requirements gathering, (ii) indicators gathering and (iii) services gathering.
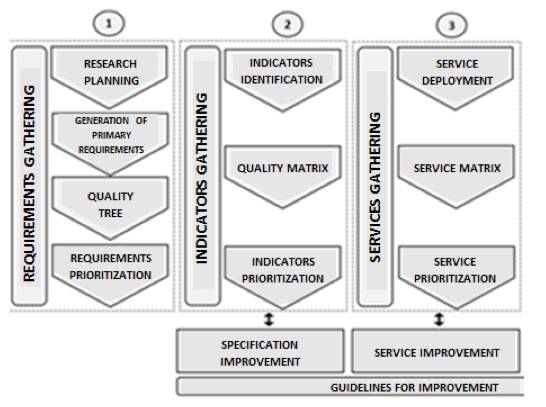
Figure 1 – Market Research Framework
Source – Adapted from Ribeiro et al. (2000)
The sample can be divided into two phases: qualitative and quantitative. The first sought to raise more general information and the second uses quantitative methods on its analysis to reach the most detailed level possible.
The conceptual model used in the research, presented in Figure 2, is adapted from Ribeiro et al (2000). This model composes two main matrices: The matrix of quality and service.
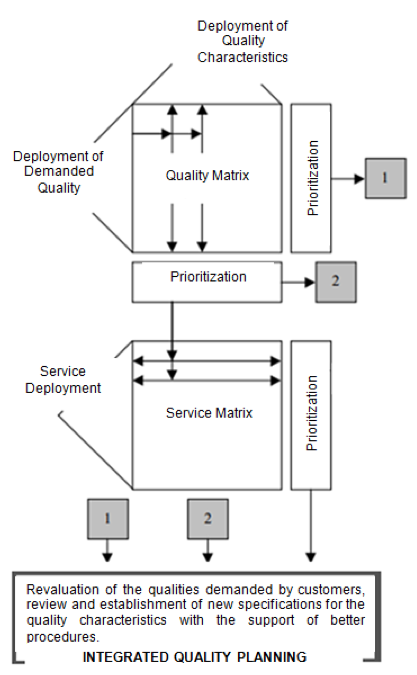
Figure 2 – Conceptual QFD Model for services
Source - Ribeiro et al. (2000)
4. Requirements gathering
4.1. Research Planning
For the planning step of the research, a meeting between the authors was performed to identify the format of the survey, and subsequently, an alignment with the team responsible for banking correspondents in the institution.
The calculation of the sample size was considered equal size for each of the five strata studied and divided into five regions of the state of Rio Grande do Sul. The formula used was based on the Bolfarine and Bussab (2005) equation, used to calculate the simple random samples. An adaptation of the calculus was the coefficient of variation to measure the variability of the population, according to equation 1.

Equation 1 – Adaptation for the viability calculation
Source: Bolfarine and Bussab
Using a significance level of 5%, a Coefficient of variation of 5% and a relative error of 3%, parameters considered reasonable by FULLER (2011), we arrive at a sample size of 10 subjects per stratum resulting in a total of 50 respondents.
4.2. Generation of Primary Requirements
First, a qualitative research was conducted in order to raise the profile of the banking correspondents, as well as their demands. According to NEVES (1996), this research aims to understand the phenomena from the perspective of the participants in the studied situation and, from this, place the interpretation of the researcher of the studied phenomena. The answers were used for the subsequent assembly of the quantitative questionnaire used in the survey in question. 37 responses were obtained in this first step. The qualitative survey answers were then compiled and a tree of demanded quality was assembled to structure to the demands and its respective constructs, so that a closed questionnaire is mounted (Anzanello, 2009).
4.3. Tree of demanded quality
Figure 5 shows the four secondary levels used, which were deployed in tertiary levels. The secondary levels are divided into Infrastructure, Support, Marketing and Services. The tertiary level comes from a subdivision of the secondary levels and was divided into 19 items.
4.4. Requirements prioritization
Derivative from the tree of demanded quality, the quantitative questionnaire used in the study was developed and implemented as a pilot test on a banking correspondent of each of the five regions under study. From this pilot study, the questionnaire was adjusted and applied in 10 correspondents in each region, this was representative, as seen previously.
The method for collecting data was through human resources of the commercial area of the studied company, represented by commercial coordinator and one person in charge for each region, and two more people trained on the approach of the questionnaire.
The questions of the closed questionnaire, as figure 3, were quantified in a discrete quantitative scale (1, 2, 3,...,10), ranging from 1 to 10, where 1 means the closer "Not very important" and closer to 10 means "Very important". Four questions were asked in relation to secondary levels, one for each of them: Infrastructure, Support, Marketing and Services.
1) Evaluate the importance of Infrastructure |
Not Very Important |
|
Very Important |
||||||||
|
1 |
2 |
3 |
4 |
5 |
6 |
7 |
8 |
9 |
10 |
|
Proper Layout |
|
|
|
|
|
|
|
|
|
|
|
Sufficient physical space |
|
|
|
|
|
|
|
|
|
|
|
Comfortable lighting |
|
|
|
|
|
|
|
|
|
|
|
Pleasant indoor visual |
|
|
|
|
|
|
|
|
|
|
|
System responsiveness |
|
|
|
|
|
|
|
|
|
|
|
2) Evaluate the importance of Support |
Not Very Important |
|
Very Important |
||||||||
|
1 |
2 |
3 |
4 |
5 |
6 |
7 |
8 |
9 |
10 |
|
Training for use of services |
|
|
|
|
|
|
|
|
|
|
|
Equipment maintenance |
|
|
|
|
|
|
|
|
|
|
|
Periodic visits |
|
|
|
|
|
|
|
|
|
|
|
Assistance in attendance |
|
|
|
|
|
|
|
|
|
|
|
3) Evaluate the importance of Marketing |
Not Very Important |
|
Very Important |
||||||||
|
1 |
2 |
3 |
4 |
5 |
6 |
7 |
8 |
9 |
10 |
|
Establishment divulgation |
|
|
|
|
|
|
|
|
|
|
|
Prospecting for new customers |
|
|
|
|
|
|
|
|
|
|
|
Promotional actions |
|
|
|
|
|
|
|
|
|
|
|
Wider dissemination of Banriponto brand |
|
|
|
|
|
|
|
|
|
|
|
Appropriate divulgation material |
|
|
|
|
|
|
|
|
|
|
|
4) Evaluate the importance of Service |
Not Very Important |
|
Very Important |
||||||||
|
1 |
2 |
3 |
4 |
5 |
6 |
7 |
8 |
9 |
10 |
|
Sufficient knowledge of the product |
|
|
|
|
|
|
|
|
|
|
|
Accessible rates |
|
|
|
|
|
|
|
|
|
|
|
Broad product portfolio |
|
|
|
|
|
|
|
|
|
|
|
Adequate remuneration for services |
|
|
|
|
|
|
|
|
|
|
|
Simple communication with the correspondents |
|
|
|
|
|
|
|
|
|
|
|
Figure 3 – Closed questionnaire
Source: Elaborated by the Author
Also, a hierarchy question was added, where the respondent is encouraged to express which item is most important in order of your preference, as figure 4.
5) In the Business Correspondent model, what do you find most important? |
At this time, order from 1 to 5, where 1 is the most important and 5 the least important item. Numbers can not be repeated! |
( ) Infrastructure |
( ) Support |
( ) Marketing |
( ) Service |
Figure 4 - Closed questionnaire
Source: Elaborated by the Author
4.5. Prioritized Requirements
In this step of the deployment, a quantification of the weights is made, and then a measure of relative weight (%).Thus, each level is split into secondary levels are compared its averages and other measures, according to figure 5.
Quality Tree |
Quality Requirements |
||||||||
Secondary |
Weight |
Weight % |
Tertiary |
Average |
Weight |
(IDi) Weight % |
Ei |
Mi |
IDI* |
Infrastructure |
1,7 |
18,82% |
Proper Layout |
8,666 |
20% |
3,71 |
1 |
1 |
3,71 |
Sufficient physical space |
8,089 |
18% |
3,47 |
1 |
1 |
3,47 |
|||
Comfortable lighting |
8,661 |
20% |
3,71 |
1 |
0,5 |
2,62 |
|||
Pleasant indoor visual |
8,694 |
20% |
3,72 |
1 |
1 |
3,72 |
|||
System responsiveness |
9,81 |
22% |
4,2 |
2 |
0,5 |
4,2 |
|||
Support |
2,47 |
27,36% |
Training for use of services |
9,487 |
27% |
7,29 |
2 |
0,5 |
7,29 |
Equipment maintenance |
9,142 |
26% |
7,02 |
1 |
1 |
7,02 |
|||
Periodic visits |
7,344 |
21% |
5,64 |
1,5 |
2 |
9,77 |
|||
Assistance in attendance |
9,651 |
27% |
7,41 |
2 |
1,5 |
12,84 |
|||
Marketing |
2,05 |
22,71% |
Establishment divulgation |
9,429 |
21% |
4,75 |
1 |
2 |
6,71 |
Prospecting for new customers |
9,108 |
20% |
4,59 |
1,5 |
1,5 |
6,88 |
|||
Promotional actions |
8,429 |
19% |
4,24 |
1 |
2 |
6 |
|||
Wider dissemination of Banriponto brand |
9,144 |
20% |
4,6 |
1 |
1,5 |
5,64 |
|||
Appropriate divulgation material |
8,997 |
20% |
4,53 |
2 |
2 |
9,06 |
|||
Services |
2,8 |
31,11% |
Sufficient knowledge of the product |
9,542 |
21% |
6,56 |
2 |
1,5 |
11,37 |
Accessible rates |
8,554 |
19% |
5,89 |
1 |
1 |
5,89 |
|||
Broad product portfolio |
8,443 |
19% |
5,81 |
1 |
0,5 |
4,11 |
|||
Adequate remuneration for services |
9,579 |
21% |
6,59 |
2 |
1,5 |
11,42 |
|||
Simple communication with the correspondents |
9,094 |
20% |
6,26 |
1,5 |
1,5 |
9,38 |
|||
1 |
2 |
3 |
4 |
5 |
6 |
7 |
8 |
9 |
10 |
Figure 5 – Weights
Source: Elaborated by the Author
Still according to figure 5, the left columns represent the deployed items of requirement generation step, column one. The weight related to the secondary level, column two, is the result of the geometric average of the answers of the order question from figure 4. In this example, the secondary level of services has greater significance to the correspondents.
In conclusion the authors emphasize that for this study, the segment points as priority service and support, column three, since the banking products and services are commodities. Therefore, the quality of services and support are considered differential. Considering that infrastructure is offered by correspondent, and this was the target audience of the survey, results suggests that the correspondent is satisfied with the business model provided, in which the bank remunerates for a service, but uses the structure offered by itself.
The column three is the normalization of weights, is obtained by proportion adding 100%.
The column four is the deployment of requirements that were evaluated in the quantitative questionnaire, according to figure 3. The results were summarized by the geometric average of the correspondent, column five. These results were normalized in 100 basis points, column six.
The IDI is obtained by weighting the level of the secondary to tertiary levels on which it belongs, for example the item proper layout, according to equation 2:
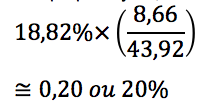
Equation 2 – Weighting
Source: Bolfarine and Bussab
Notice that 43,92 is the sum of the averages from the tertiary levels for the infrastructure item. In sequence the IDI* is adjusted the strategic evaluation (Ei) and competitive evaluation (Mi) factors, as shown in equation 3 and using the weighting scale.

Equation 3 - Weighting
Source: Bolfarine and Bussab
The IDI is the index of importance of the demanded quality, is subsequently adjusted by the corporate team based on the viability of performing changes that lead to the result demanded by the client or more important party involved, generating the Index of Fixed Quality Demand Importance (IDi*), shown in equation below. The adjustment factors relate to the strategic assessment (Ei) and competitive (Mi) regarded to competition, and have as goal to identify strengths and lagged points of the product analyzed in relation to the market, based on the scale shown in Table 1.
Competitive Evaluation (Mi) |
|
Scale |
Description |
2,0 |
Far below the competition |
1,5 |
Below the competition |
1,0 |
Similar to the competition |
0,5 |
Far above the competition |
Strategic Evaluation (Ei) |
|
Scale |
Description |
2,0 |
High strategic importance |
1,5 |
Important |
1,0 |
Moderate |
0,5 |
Low importance |
Table 1 – Weighting scale for demanded quality items
Source: Ribeiro et al. (2001)
5. Prioritization of Demanded Quality
The Pareto chart, as Figure 6, illustrates the order of demands regarding weights IDi, as the most common items which are related to "Assistance in attendance" weighing 12,84, followed by "adequate remuneration for services" with 11,42, and so on until the last item on the "Environment", with less relevance and measured at 3,38, according to the target audience interviewed. We emphasize that the results refer to the demands of the segment selected for this study.
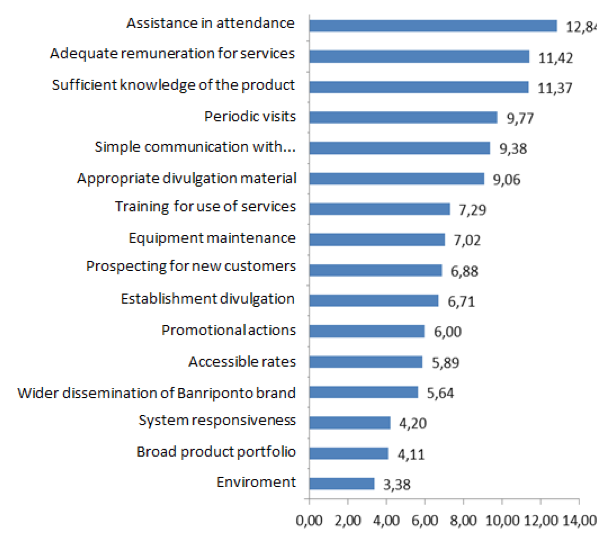
Figure 6 – Pareto's Demand
Source: Elaborated by the Author
As previously mentioned, the item assistance in attendance was the one that had greater weight in relation to others, even exceeding the remuneration, a fact that was considered a surprise by the experts in the field. Analyzing the information in Figure 6, it is noticed that the most relevant factors are associated with proximity and relationship of the bank with the correspondent, related to visits, training, support and communication, despite the remuneration be the second item on relevance.
6. Indicators gathering
6.1. Indicators identification
The indicators identification was based on research with managers of the areas involved in model implementation process.
6.2. Quality Matrix
Is possible to identify on figure 7 the quality matrix and the house roof of quality. This includes the impacts that each quality characteristic imply in quality demanded, the higher the index IDi, most critical have been the item considered in the evaluation.
On the quality matrix, is important to emphasize that the question "environment" was a grouping of layout, space and lighting of the place. In this figure it is also possible to see that the highest index IDi belongs to the item "assistance in attendance", being possible to conclude, for example, that if this point is not attended, the average time of answering calls for inquiries will be higher and more hours of training will be needed.
In the house roof of quality we have the symbols ("+" and "-") to represent the quality characteristics, where we express the indicators as strongly positive (++), positive (+), negative (-) and strongly negative (--).The goal is to positively relate the indicators, identifying what is the impact the one's changes interfere in the other. It is noticed that all are related.
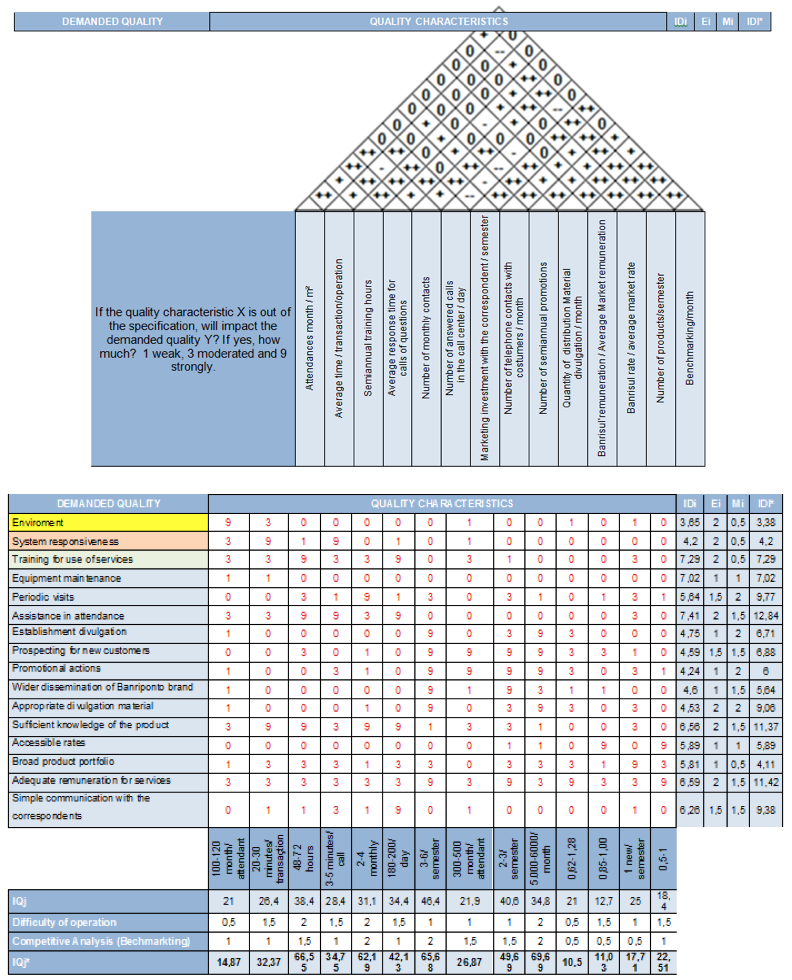
Figure 7 – Quality Matrix
Source: Elaborated by the Author
From the analysis of Figure 7 it is possible to see that marketing investments positively impact indicators of attendance amount, promotions, rates and products. As well as the remunerations directly impacts Benchmarking, products and the rate offered.
The item semester hours of training is strongly related to the number of calls received in the call center/day, in this case it is understood that the higher the qualification, more calls are answered. The current market requires continuous training and this difference makes the attendance to be quick and efficient.
The average call answering time for doubt is strongly related to the amount of answered calls, because the shorter the time more calls will be answered. This item can also be associated with the training, because the qualified employee is better equipped to serve customers quickly.
The amount of answered calls is related to the number of semiannual promotions made, because the higher the number of promotions and investment in marketing bigger will be the number of calls. In this case, a good divulgation work helps to conquer new costumers, stimulate sales and consequently increases the demand for services and the amount of contacts. The number of monthly contacts directly relates to marketing investment, because the higher the divulgation, greater will be the number of calls.
Banrisul's rate is related directly to the amount of products, because the better the remuneration, greater will be the commercialization. As a result, the increase in supply, creating greater success and business growth.
The quality roof also shows that all actions related to marketing and promotion directly affect attendance; in this case, the managers have to prepare the service structure and training before making any decision related to these items. Another way is consider in the planning of each promotion action the step of attendance preparation as crucial to maintaining the service quality.
6.3. Indicators prioritization
The Pareto's graphic below shows the IQi weights an orderly fashion, where the biggest was "distribution material quantity" with 69,69 followed by "semiannual training hours" with 66,55 and forth until the lowest weight related to "Banrisul' remuneration/ average remuneration" with weight of 10,50.
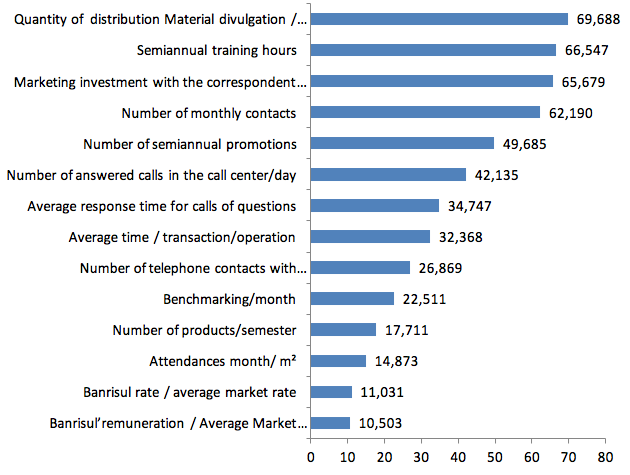
Figure 8 – Pareto's Quality Characteristics
Source: Elaborated by the Author
A relevant detail, from the Pareto chart of the quality characteristics was the importance that the correspondent attributes to promotional materials distributed around the city. The final customer may not give importance to this issue, however, for the correspondent seems to have significant importance. Furthermore, the Banrisul' remuneration item, relative to the market was considered of minor importance among the raised by the questionnaire, this factor identifies that the remuneration is within the correspondent expectations in relation to the characteristics of the product. However it is a significant demand, and should be maintained at similar levels to the market.
The importance of the quality characteristics is determined by equation 4:

Equation 4 – Weighting
Fonte: Bolfarine and Bussab
----
Competitive Evaluation (Bi) |
|
Scale |
Description |
2,0 |
Far below the competition |
1,5 |
Below the competition |
1,0 |
Similar to the competition |
0,5 |
Far above the competition |
Evaluation of the difficulty of operation (Ei) |
|
Scale |
Description |
2,0 |
Easy |
1,5 |
Moderate |
1,0 |
Difficult |
0,5 |
Very difficult |
Table 2 – Weighting scale for demanded quality items
Source: Ribeiro et al. (2001)
7. Services gathering
7.1. Services deployment
The processes the provision of services are deployed into their individual procedures, allowing to identify all activities associated with the provision of a particular service, according to Ribeiro and Mota (1996).
7.2. Services matrix
This matrix represents the deployment of the stages of the production process. In this study, the focus is the area of provision of services and, thus, this step will be conveniently our area of operation. Instead of working with production steps, we proposed some relevant actions (lines) to boost the activity of the correspondents in relation to indicators (columns) previously defined. Analyzes relevant to this matrix are more easily visualized in the Pareto process.
Deployment of the steps of production process |
Attendances month/ m² |
Average time / transaction/ operation |
Semiannual training hours |
Average response time for calls of questions |
Number of monthly contacts |
Number of answered calls in the call center/day |
Marketing investment with the correspondent / semester |
Number of telephone contacts with costumers / month |
Number of semiannual promotions |
Quantity of distribution Material divulgation / month |
Banrisul' |
Banrisul rate / average market rate |
Number of products/ |
Benchmarking |
|
|||
Process Steps (IQJ*) |
14,87 |
32,37 |
66,55 |
34,75 |
62,19 |
42,13 |
65,68 |
26,87 |
49,69 |
69,69 |
10,50 |
11,03 |
17,71 |
22,51 |
IPRi |
Fi |
Ti |
IPRi* |
Prospecting new correspondents |
0 |
0 |
0 |
0 |
3 |
1 |
3 |
3 |
3 |
3 |
1 |
1 |
0 |
1 |
90,85 |
1,50 |
2,00 |
157,36 |
Visual programming and layout |
9 |
1 |
0 |
0 |
3 |
3 |
9 |
0 |
3 |
3 |
0 |
0 |
0 |
3 |
149,60 |
1,50 |
1,50 |
224,39 |
Competition research |
0 |
0 |
0 |
0 |
3 |
0 |
3 |
3 |
9 |
0 |
9 |
9 |
3 |
9 |
136,09 |
2,00 |
2,00 |
272,18 |
Training |
9 |
9 |
9 |
9 |
3 |
3 |
0 |
3 |
0 |
0 |
0 |
0 |
9 |
1 |
191,23 |
1,00 |
1,00 |
191,23 |
Elaboration of sales materials |
0 |
0 |
0 |
0 |
0 |
3 |
9 |
0 |
9 |
9 |
0 |
0 |
0 |
1 |
181,44 |
1,50 |
0,50 |
157,13 |
Technical/Commercial visit |
0 |
3 |
9 |
9 |
9 |
3 |
0 |
1 |
9 |
3 |
1 |
1 |
3 |
1 |
247,51 |
1,50 |
1,50 |
371,27 |
Advertisement of new points |
3 |
1 |
9 |
9 |
9 |
3 |
9 |
3 |
9 |
9 |
0 |
0 |
3 |
0 |
347,40 |
0,50 |
1,00 |
245,65 |
Inclusion of new services |
0 |
3 |
9 |
9 |
9 |
9 |
9 |
3 |
9 |
3 |
9 |
0 |
9 |
3 |
359,71 |
1,00 |
0,50 |
254,35 |
Audit system and documents |
0 |
9 |
3 |
3 |
3 |
3 |
3 |
3 |
0 |
0 |
0 |
0 |
0 |
1 |
120,83 |
1,00 |
1,50 |
147,99 |
Definition and accompaniment of goals |
0 |
1 |
9 |
0 |
9 |
1 |
3 |
3 |
0 |
0 |
0 |
0 |
3 |
9 |
176,65 |
1,00 |
1,00 |
176,65 |
Promotional actions |
3 |
3 |
3 |
3 |
9 |
9 |
9 |
9 |
9 |
9 |
0 |
0 |
9 |
9 |
365,38 |
0,50 |
1,00 |
258,36 |
Figure 09 – Matrix of services procedures
7.3. Services Prioritization
Figure 10 demonstrates the IPRI weights, evidencing greater weight in "promotional actions", with value of 365,38 followed by "inclusion of new services" with 359,71 and so on until the last of lesser value which is "prospecting new correspondents" with weight of 90,85.
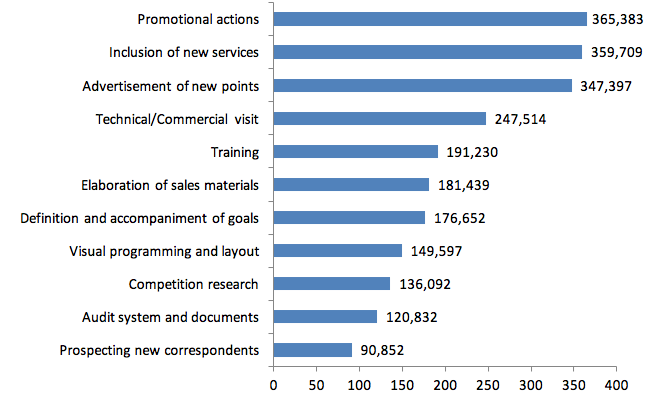
Figure 10 – Process Pareto
Source: Elaborated by the author
From the information of the process, it is possible to say that marketing and advertising are essential, since two of the first three items are related to these issues. Another interesting point to note is on the prospecting for new correspondents, was considered the least critical item, a possible conclusion is that it would be more interesting to invest in current correspondents that actually seek new, however, it is noteworthy that a situation does not exclude the other, but the weight of seeking new correspondents is smaller for this analysis.
8. Results analysis
There was no difficulty in applying the research questionnaire. The correspondents were receptive, demonstrated satisfaction for being interviewed and some expressed that feeling to the interviewers.
There was a perception by experts that the remuneration for services provided would be the most critical quality requirement for the banking correspondent model. However, the research showed that the most important requirement for the correspondent is related to assistance in attendance and training on the products to be commercialized.
One possible reason for this result is the need to show the final customer how to use the service properly and safely. An important issue to be highlighted is that remuneration is not decisive factor, it must be within the market values.
The results show the inclusion of new services as a requirement demanded by the correspondent, and may be considered an innovation in the model, as this market operates with standardized services, that is, with restricted service portfolio. Another factor to be noted is that there was an expectation that the price of services offered, mainly that the interest rate of the personal loan would be an important requirement, but this item did not show significance in the research.
The correspondent model works with the bank interacting as intermediate and not with the final customer, so the needs identified in the survey reflect the needs of the correspondent and not the users of the product. Prospecting for new correspondents was mentioned last, because it is more interesting to invest in already affiliated establishments, than actually seek new customers. Is also possible to understand that the item related to prospecting for new correspondents had lower rating because it represents competition to the existing ones.
9. Final considerations
From the analysis presented, the objective of this study was to implement the business model in a financial institution in the state of Rio Grande do Sul. In this implementation the QFD tool with focus on services was used. The tool has limitations because it does not detect intrinsic items to the process. As example, layout and user convenience (displacement, proximity of the establishment).
The QFD has advantages in improving the service, but the dynamics of the banking market hampers the implementation of the model, due to the delay in data collection. To improve the use of the concept of deployment would require inclusion of intermediate points of application of the research results to foster the next steps. The inclusion of these steps makes the model more agile allowing interventions to the extent that the information is collected.
The application of QFD along with other tools becomes interesting, in order to better understand the market and customers in general, such as apply quality research in depth, with active and/or focus groups with active observation of clients and experts. Also, the application of tools such as CVCA "customer value chain analysis" that allows to illustrate the interaction between the parties involved in a particular chain or business network.
It is essential the team's involvement to the result (multidisciplinary), however, in the beginning of the research there was resistance because the demanded work (delay), time to fill spreadsheets and data collection. To facilitate the process it is interesting to work with the quantitative and qualitative steps simultaneously, rather than working as dependent steps (one being predecessor to the other).
We believe that this study may somehow contribute so that future researchers of the use of QFD feel more aware of the limitations of this methodological approach. For future researches, it is suggested the case study of the implementation results of QFD tool.
10. References
Akao, Y. (1990), Quality Function Deployment, Productivity Press, Cambridge.
Anzanello, M.J. Lemos, F.O. Echeveste, M.E. (2009), "Aprimorando produtos orientados ao consumidor utilizando Desdobramento da Função Qualidade (QFD) e Previsão de Demanda", Produto & Produção, Vol. 10, No.. 2, pp. 1-27.
Bolfarine, H. and Bussab, W.O. (2005), Elementos de Amostragem, São Paulo, Edgard Blücher.
Boyd, H.W. and Westfall R. (1978), Pesquisa Mercadológica: textos e casos, Rio de Janeiro, Getúlio Vargas.
Campello, M.L.C. Galvão, D.E. Sacomano, J.B. (2002), "As estratégias e as novas formas de organização do trabalho dos bancos de varejo" in IX SIMPEP, Simpósio de Engenharia de Produção, Bauru, 2002.
Campello, M.L.C. (2004), Um estudo sobre a competitividade dos bancos de varejo do Brasil. Dissertação (Mestrado em Engenharia de Produção), Programa de Pós – graduação em Engenharia de Produção. São Paulo: Universidade Paulista – UNIP.
Kuei, C. and Lu, M.H. (1997) "An integrated approach to service quality improvement", International Journal of Quality Science, Vol. 2, No. 1, pp.24-36.
Jin, D. Chai, K. Tan, K. (2014), "New service development maturity model", Managing Service Quality, Vol. 24, No. 1, pp. 86-116.
Jin, D. Chai, K. Tan, K., (2012), "Organizational adoption of new service development tools", Managing Service Quality, Vol. 22, No. 3, pp. 233-259.
Drumond, F.B. (1995), Ouvindo o cliente para o planejamento do produto. In: Cheng, L.C. et al. QFD: planejamento da qualidade. Belo Horizonte: UFMG, Escola de Engenharia, Fundação Christiano Ottoni.
Fuller, W. A. (2011), Sampling Statistics. 1ª ed. Ames, Iowa: Wiley.
Ghobadian A.A. Terry, J. (1995), "How Alitalia improves service quality through quality function deployment", Managing Service Quality, Vol. 5, No. 5, pp. 31 – 35.
González, M.E.G. Quesada, F. Picado, Carl A. Eckelman, (2004) "Customer satisfaction using QFD: an e-banking case", Managing Service Quality, Vol. 14, No. 4, pp. 317 – 330.
Hamilton J. Selen W. (2004), "Enabling real estate service chain management through personalised Web interfacing using QFD", International Journal of Operations & Production Management, Vol. 24, No.3, pp.270 – 288.
Jayawardhena, C. (2010), "The impact of service encounter quality in service evaluation: evidence from a business-tobusiness context", Journal of Business & Industrial Marketing, Vol. 25 No. 5, pp. 338-48.
Kay C.T. Pawitra, T.A. (2001), "Integrating SERVQUAL and Kano's model into QFD for service excellence development", Managing Service Quality, Vol. 11, No. 6, pp.418 – 430.
Lu, M.H. Madu, C.N. Kuei, C.H. Winokur, D. (1994), "Integrating QFD, AHP and benchmarking in strategic marketing", Journal of Business & Industrial Marketing, Vol. 9 No. 1, pp. 41-50.
Maritan, D. Panizzolo, R. (2009) "Identifying business priorities through quality function deployment: Insights from a case study", Marketing Intelligence & Planning, Vol. 27, No. 5, pp.714 – 728.
Martins, A.C.S. (2012), "Implementação de ferramentas de gestão da qualidade em uma empresa familiar, no setor de serviços de saúde", Revista Mundo da Gestão, Vol. 2. pp. 34-44.
Miciak, A. Desmarais, M. (2001), "Benchmarking service quality performance at business-to-business and business-to-consumer call centers", Journal of Business & Industrial Marketing, Vol. 16 No. 5, pp. 340-51.
Miguel, P.A.C. (2005), "Evidence of QFD best practices for product development: a multiple case study", International Journal of Quality & Reliability Management, Vol. 22 No. 1, pp. 72-82.
Mizuno, S. Akao, Y. (1994), QFD: The Customer-Driven Approach to Quality Planning and Development, Asian Productivity Organization, Tokyo, Japan, available from Quality Resources, One Water Street, White Plains NY.
Neves, J.L. (1996), "Pesquisa Qualitativa – Características, usos e possibilidades", Cadernos de Pesquisa em Administração, Vol. 1, No. 3, pp. 01-05.
Pun, K.F. Chin, K.S. Lau, H. (2000), "A QFD / approach for service quality deployment: a case study", Managing Service Quality, Vol. 10, No. 3, pp.156 – 170.
Ramaswamy, R. (1996), Design and Management of Service Processes, Prentice-Hall, Reading, MA.
Ribeiro, J.L.D. Echeveste, M. Danilevicz, A.M.F. (2000), A utilização do QFD na otimização de produtos, processos e serviços. Série monográfica Qualidade. FEENGE/UFRGS/EE/PPGEP, Porto Alegre, Brasil.
Ribeiro, J.L. D. Mota, E.V. (2000), Desdobramento da Função Qualidade. Porto alegre: PPGEP, UFRGS, Brasil.
Rosenthal, S.R. (1992), Effective product design and development, How to cut lead time and increase customer satisfaction, Business One Irwin, Homewood, Illinois 60430.
Salviano Jr, C. (2005), Correspondentes bancários: ampliação do atendimento à população. In: IV Seminário Banco Central sobre Microfinanças. Salvador: 1/3. Jun 2005.
Silva, L.C.S. Kovaleski, J.L. Gaia, S. Back, L. Spak, M.D.S, Moretti, I.C. (2013), "World scenario of green patents: Perspectives and strategies for the development of eco-innovations", African Journal of Business Management, Vol. 7, pp. 472-479.
Silva, L.C.S. Kovaleski, J.L., Gaia, S. (2011), "Qualidade em Serviços: Uma Análise Teórica sobre as Principais Características", Revista Gestão Industrial, Vol. 7, pp. 140-153.
Spreng, R.A. Shi, L.H. Page, T.J. (2009), "Servicequality and satisfaction in business-to-business services", Journal of Business & Industrial Marketing, Vol. 24 No. 8,pp. 537-48.
Strandberg, C. Wahlberg, O. Öhman, P. (2012) "Challenges in serving the mass affluent segment: bank customer perceptions of service quality", Managing Service Quality, Vol. 22, No. 4, pp.359 – 385.
Sullivan, L.P. (1986), Quality Function Deployment, Quality Progress, June, pp 39-50.
Zillur, R. Qureshi, M.N. (2008), "Developing new services using fuzzy QFD: a LIFENET case study", International Journal of Health Care Quality Assurance, Vol. 21, No. 7, pp.638 – 658.
Yoonjung, A. Sungjoo, L. Yongtae, P. (2008), "Development of an integrated product-service roadmap with QFD: A case study on mobile communications", International Journal of Service Industry Management, Vol. 19, No. 5, pp.621 – 638.
1.Department: Department of Production Engineering University/Institution: Federal University of Rio Grande do Sul (UFRGS) Town/City: Porto Alegre State (US only): Rio Grande do Sul Country: Brazil
2. Department: Department of Production Engineering University/Institution: Federal University of Rio Grande do Sul (UFRGS) Town/City: Porto Alegre State (US only): Rio Grande do Sul Country: Brazil
3. Department: Department of Production Engineering University/Institution: Federal University of Rio Grande do Sul (UFRGS) Town/City: Porto Alegre State (US only): Rio Grande do Sul Country: Brazil
4. Department: Department of Production Engineering University/Institution: Federal University of Rio Grande do Sul (UFRGS) Town/City: Porto Alegre State (US only): Rio Grande do Sul Country: Brazil