

 HOME | ÍNDICE POR TÍTULO | NORMAS PUBLICACIÓN
 Espacios. Vol. 37 (Nº 17) Año 2016. Pág. 8
Carlos Alberto Gonçalves da SILVA 1; Léo da Rocha FERREIRA 2
Recibido: 22/02/16 • Aprobado: 25/03/2016
4. Empirical Results and Analysis
RESUMO: This paper examines the volatility of daily returns of spot prices of Arabica Coffee through conditional variance models, also called heteroskedasticity models. The data used in the analysis refers to the January 3, 2000 to June 15, 2012 period. The empirical results show reactions of persistency and asymmetry in the variance of their returns, in other words, both good and bad news differently impacts on the volatility of returns according to the EGARCH (1.1) and TARCH (1.1) models. However, from the standpoint of performing predictions, the model that best adapted heteroskedasticity data was EGARCH (1.1) with t - Student's distribution. The coffee market presents strong evidence of such result, since the supply shock yields increases in price levels of the commodity. The empirical results suggest the need of proper strategic instruments of hedging in view of the accentuated shock persistency in Arabic Coffee price volatility returns. |
ABSTRACT: O presente artigo examina a volatilidade dos retornos diários dos preços à vista do Café Arábica por meio dos modelos de variância condicional, também chamados heteroscedásticos. A análise compreende o período de 3 de janeiro de 2000 a 15 de junho de 2012. Os resultados empíricos demonstraram reações de persistência e assimetria na variância dos respectivos retornos, ou seja, boas e más notícias impactam diferentemente sobre a volatilidade dos retornos de acordo com os modelos EGARCH (1,1), TARCH (1,1) e APARCH (1,1). Contudo, com o objetivo da realização de previsões, o modelo heteroscedástico que mais se adequou aos dados foi o EGARCH (1,1) com distribuição t student. Em geral, o mercado de café apresenta forte evidência deste resultado, visto que choques de oferta resultam no incremento dos seus níveis de preço. Os resultados empíricos da análise sugerem a necessidade da utilização de instrumentos estratégicos de hedging, tendo em vista a acentuada persistência na volatilidade dos retornos diários dos preços do Café Arábico. |
Global price changes have various consequences for food production, commodity trade, nutrition security, and therefore political stability in developing countries. According to Food and Agricultural Organization data [3], the world commodity market prices which together provide around three quarters of the world population's calorie requirements have raised rapidly since 2007. It is also known that the volatility of market prices increased in terms of fluctuations around their long-run trend. A main question for most research projects dealing with price volatility is: What are the impacts of price fluctuations? In order to answer these questions a necessary and important previous research stage is to find the appropriate volatility model for spot commodity prices.
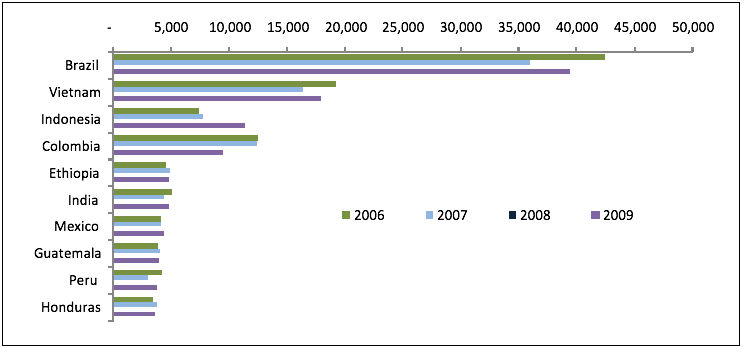
Presently, Brazil and the United States are the largest coffee consumers in the world. In 2009, according to the Brazilian Coffee Industry Association (ABIC) [4], together they reached a total consumption of 25 millions of coffee sacks of 60kg. As presented in Figure 1, the major world coffee producers are: Brazil, Vietnam, Indonesia, Colombia, Ethiopia, among others. These countries are important actors in the world coffee trade responsible for most of the world coffee supply. In 2009, the ten major coffee producers listed in Figure 1 were responsible for 84% of the total world coffee production.
Figure 1 - Major Arabic and Robust coffee producers in the world, 2006/2009 (in 1,000 sacks of 60kg).
Source: International Coffee Organization (ICO).
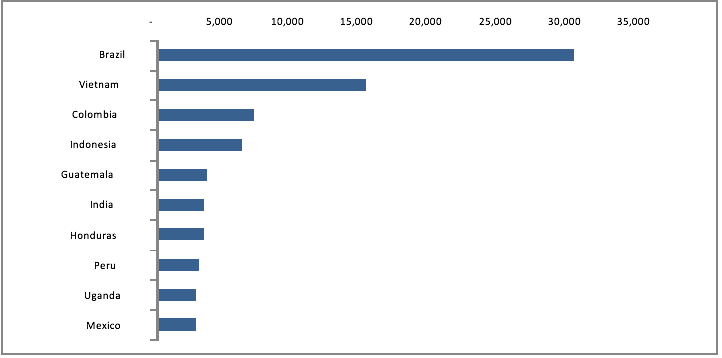
In volume the major world coffee exporters are: Brazil, Vietnam, and Colombia among others (Figure 2). From April 2009 to March 2010, according to data from the ICO, 92 million coffee sacks of 60kg were exported by country producers, where the three major export countries together were responsible for 65% of the total world product exports.
Figure 2 - Major Arabic and Robust Coffee exporters, 2009/2010 (in 1,000 sacks of 60 kg).
Source: International Coffee Organization (ICO).
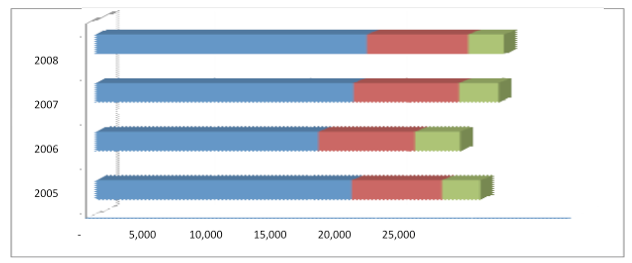
The major world in natura coffee importers are countries from the European Union. Germany on top of the importer list in 2008, according the ICO, was responsible for 24% of total exports from the producers. This can be explained by the strategic position occupied by the E.U. in the world coffee market, as well as the US$ Dollar devaluation against the Euro, since the world coffee price quotation is done in US$ dollars (Figure 3).
Figure 3 - Major importers of Arabic and Robust Coffee, 2005/2008.
Source: International Coffee Organization (ICO).
In order to better understand the impact of price fluctuations and how to take them in consideration in research projects, the major objective of this paper was to analyze price returns volatility of Arabic Coffee in Brazil. Specificly, the objetive was to evaluate the returns volatility and its persistency, to verify if positive shocks have the same effect as negative shocks in volatility and to identify which is the best ajusted prevision model for Arabic Coffee price returns. To achieve these objective conditional heteroskedasticity models of the ARCH family were used.
Using data and information from the seventies, the seminal paper of Engle (1982) had the objective of estimating the inflation variance for the United Kingdom. However, the research results brought evidence of the existence of conditional variance in those return series, leading later on to an enormous amount of papers on ARCH models that will be discussed ahead in this paper.
In his second publication, Engle used the ARCH modeling for the portfolio investment risk definition, assuming that it follows a conditional variance process. In 2001, through ARCH and GARCH models, Engle was able to demonstrate that for several financial temporal series, the extensions of these models could be tested and used, in asset pricing and portfolio analysis, as an example, validating and corroborating the application of the ARCH model in finance [5].
The generalized ARCH model was developed by Bollerslev (1986) when the GARCH model was first presented. Bollerslev proposed the introduction of a lag variance in the model, a kind of an adaptive instrument, while in the original ARCH model the conditional variance is a function of the sample variances. The empirical model presentation was first based on the American inflation rate, following its wildly acceptance and utilization, even by Engle.
Nelson (1991) developed a new approach following the ARCH/GARCH models with the addition of an exponential component to the ARCH model deriving it into the EGARTH model [6] and therefore, providing future research perspectives.
Zakoian (1994) considered a change in the classic ARCH model proposed by Engle. In his research the TARCH model was presented with the conditional standard deviation as a linear function of the past error term values by parts. This specific form was able to permit the capture of different reactions in the volatility of the different model signs.
Finally, the development of the ARCH model and its derivations lead to its wildly application in several other researches, even in Brazil. Mól et al. (2003) examined the volatility of the daily coffee returns using the classic ARCH model. The empirical results suggested strong asymmetric signs in the volatility of the more distant series of due date contracts and indicated that all estimated models were well behaved, and the EGARCH model, more specifically, demonstrated higher quality for the prediction of coffee price returns.
Martins (2005) used extensions of the ARCH model in modeling the daily returns of Arabic coffee future contracts traded in the BMF & BOVESPA stock exchange, between 1998 and 2005. The empirical results signalized the asymmetric presence for good and bad news and the volatility grumping. The model with better predictive capacity was the TARCH model. Nevertheless, the results stressed that news of climatic changes present strong impacts on coffee price quotations.
Silva et al. (2005) examined the monthly volatility return process of two major Brazilian agricultural commodities (coffee and soybeans) between the 1967/2002 and 1957/2002 periods, respectively, using the ARCH models. The results showed a similar behavior of the volatility for both temporal series, as well as the perception that a shock in the price variance of both commodities would persist for a longer time, what could yield in the establishment of public policies for agriculture.
Monte (2007) analyzed the cacao price volatility quotations in the New York Future Market between 1989 and 2005, using GARCH, EGARCH and TARCH conditional variance heteroskedasticity models. The results demonstrated that the constant cacao price variations were caused mainly by "good" and "bad" market news. When "good" news were brought to the market, the buying positions of the market dealers would increase in the Future Markets, while when the opposite occurred, dealers would assume risk aversion positions.
Sachs and Margarido (2007) made use of conditional variance models to analyze the fat ox price series for the 2000 to 2007 period, in the State of São Paulo, using two ARCH model variants: TARCH and EGARCH models. The results showed that the fat ox return series had strong persistence and small volatility. The returns presented asymmetry, where the negative impacts were more visible than the positive impacts.
Campos and Campos (2007) applied the ARCH and GARCH models to characterize and analyze the volatility of the soybeans, coffee and fat ox monthly return series. The volatility empirical analysis showed that these agricultural products are marked by their high price fluctuations, were positive or negative shocks generates long duration impact periods. The reaction and the volatility persistence coefficients summation presented values greater than 1, indicating that the shocks in volatility would persist for some time in the price return variance of each commodity.
Silva (2008) modeling the volatility of the fat ox price return in the State of São Paulo, using conditional variance models, pointed out that in the GARCH model, the persistence and reaction volatility sum in the analyzed period, was greater than one, and that, a fat ox price return series shock would have a long time effect on the volatility of these returns, i. e., the variance impact reduction would occur in the long run. Therefore, to capture the asymmetry of good and bad news on the volatility, the EGARTH and TARCH models were used, which demonstrated through the coefficients that the bad news tend to have greater impact on the fat ox price volatility than the good news.
Mól (2008) analyzed the Arabic coffee and fat ox volatility return process using Gaussians and asymmetric models of the ARCH class. The empirical results showed strong signs of volatility persistence and asymmetry in both series. It was noted that the Arabic coffee returns were characterized by asymmetric responses with a leverage effect.
Moraes and Silva (2010) used constant and conditional variance EWMA and GARCH models, respectively, for Arabic coffee price volatility estimation. The empirical results demonstrated that a same data base allows different volatility estimation, and that such fact directly impacts in financial derivatives pricing prediction.
Pereira et al. (2010) analyzed the returns of three major commodities of the Brazilian agribusiness: soybeans, coffee and fat ox. ARCH family models were used and, in a complementary way, a Value-et-Risk (VaR) was estimated, for the July 30, 1997 to November 12, 2008 period. The coffee and soybeans returns were characterized by assymetric responses to positive and negative shocks, eventhough the levarage effect was not identified.
In order to test the stationarity series, the Augmented Dickey-Fuller (ADF) test [7] (1979) was used to verified the integration order of the interested variables, so that the existence or not of unity roots in the temporal series could be verified. The Augmented Dickey-Fuller (ADF) test consists on the estimation of the following equation using the Method of Least Square (MLS):

The Phillips and Perron (PP) test [8] was also used to verify the presence or not of unitary root. The difference between both tests is that the Phillips-Perron test gives us the guarantee that the disturbances are not correlated and have constant variance. Opposed to the Augmented Dickey-Fuller test, the Phillips and Perron test does not include the lag difference terms, but may include the tendency and the intercept terms.
The KPSS (Kwiatkowski, Phillips, Schmidt and Shin) test [9] was developed as a form to complement the analysis of the traditional unitary root tests, such as the ADF and PP tests. On the contrary of the ADF and PP tests, the HPSS test considers as the null hypothesis that the series is stationary, or stationary around a deterministic tendency, against the existence of a random path as an alternative hypothesis.
The Jarque-Bera (JB) normality test [10] is based on the difference between the asymmetric and kurtosis of the series and normal law coefficients, used to test the null hypothesis that the sample comes from a normal distribution. To conduct this test, it is necessary to first calculate the asymmetry and kurtosis of the residuals using the test statistic:

were, JB is the Jarque-Bera test, S is the symetric coefficient of the observations, C is the kurtosis coefficients of the observations and n is the number of observations. Assuming the normally null hypothesis, the JB statistic follows a chi-square distribution with two degrees of freedom. If the JB value is too low, the random error normal distribution cannot be rejected. However, if the JB value is too high, the normal distribution behavior of the the random error or residuals is rejected. If the calculated p chi-square statistic value is sufficiently low, the hypothesis of the residuos having a normal distribution can be rejected. If the p value is high, the normally hypothesis is accepted.
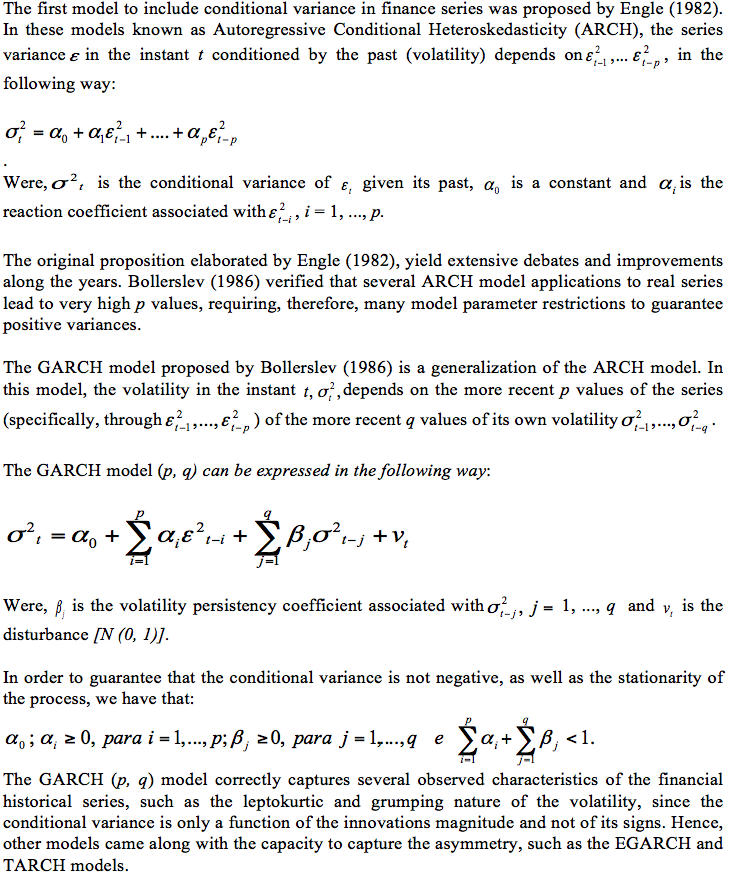
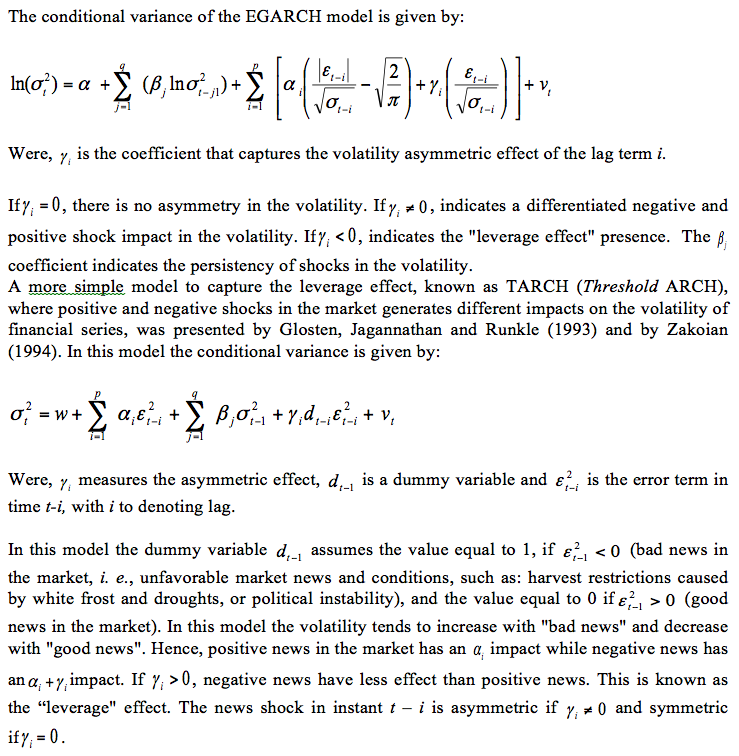
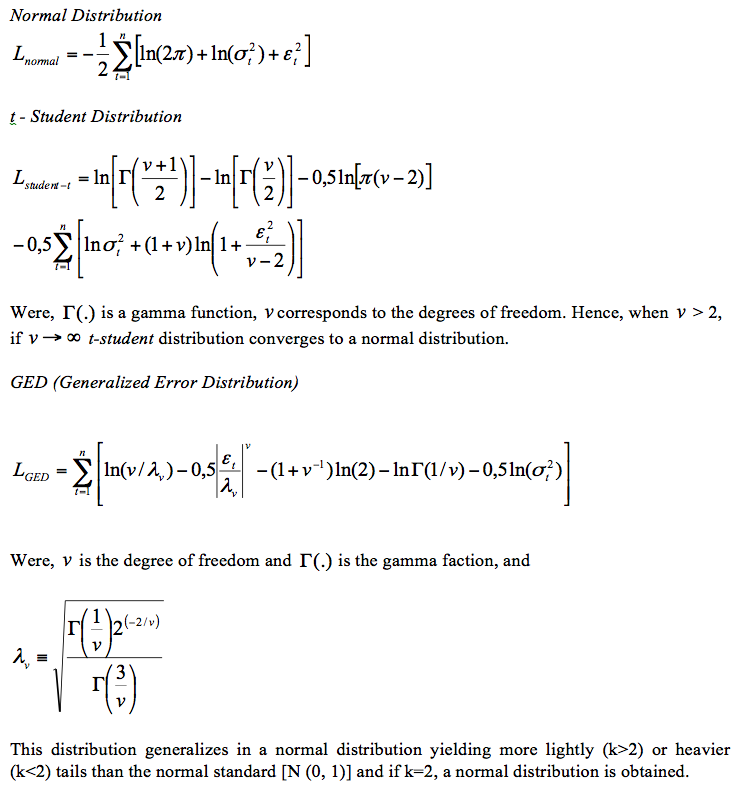
The Exponential Generalized Autoregressive Conditional Heteroskedasticity (EGARCH) model, proposed by Nelson (1991), consists in capturing the asymmetric impacts of a data series without requiring positive coefficients.
The data used in this paper were daily price quotations of Arabic Coffee sacks of 60 kg. The prices were given in R$ by sack, for the January 03, 2000 to June 15, 2012 period, amounting a total of 3250 observations. The data source is the Centro de Estudos Avançados em Economia Aplicada (CEPEA-ESALQ/USP), from the University of São Paulo.

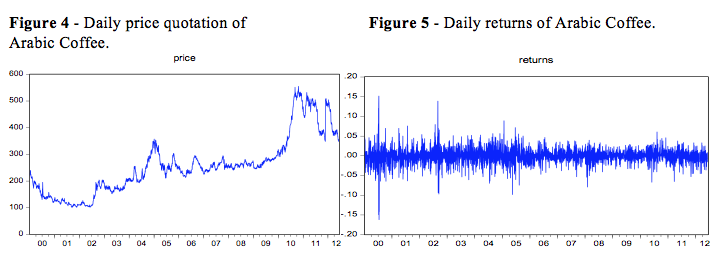
On a visual inspection of Figure 5, considering the analyzed period, a prominent volatility in the returns can be observed, with the outlier's presence, especially in 2000, 2002, 2006 and 2011 years. In the 2007/2010 period, a relative stability in volatility can be noted. Therefore, it was necessary to test the normality and stacionarity of the daily price return series of Arabic Coffee for the heterodkadacity models application.
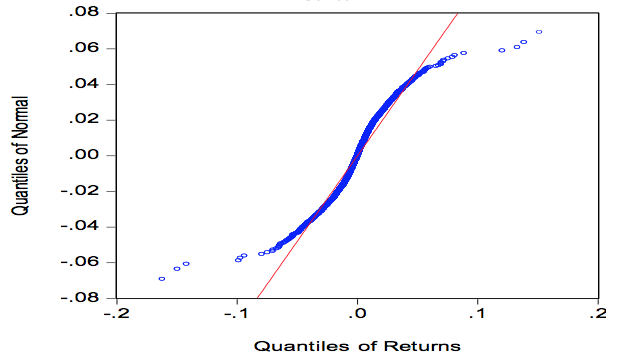
Figure 6 - Plot Q-Q normal daily returns of Arabic Coffee
Some basic descriptive statistics are presented in Table 1. It can be noted that the daily returns of Arabic Coffee presented a leptokurtic distribution given the kurtosis excess (11.37219) in relation to the normal distribution (3.0). The Jarque-Bera statistic indicated the rejection of the normality distribution of the series, with the p-valor equal to zero.
Table 1 – Price returns of Arabic Coffee statistic summary
Statistic |
Mean |
Median |
Maximum |
Minimum |
Standard Deviation |
Value |
1.000214 |
1.000425 |
1.163692 |
0.850436 |
0.019183 |
Statistic |
Assymetric |
Kurtosis |
Jarque-Bera |
p-valor |
Observations |
Value |
0.147497 |
11.37219 |
9503,619 |
.000000 |
3250 |
The Q-Q Plot represents one of the most used graphic methods for the verification of normality in temporal series. The procedure used consists in a graphic comparison of the theatrical quantis of a normal distribution with the sample data quantis. Figure 6 shows the existence of a non-linear relation among the theoretical and empirical quantis, well accentuated in the tail distributions, indicating heavier tails in the empirical distribution. Therefore, all tests rejected the normality hypothesis of the analyzed series.
The Augmented Dickey-Fuller (ADF), Phillips-Perron (PP) and Kwiatkowski, Phillips, Schmidt and Shin (KPSS) tests with a constant and tendency, indicated that the return series are stationary and do not have unitary roots, as presented in Table 2.
Table 2 – Stationary test for price return series of Arabic Coffee.
Variable |
ADF |
(PP) |
Critical Value (5%) |
KPSS |
Critical Value (5%) |
Arabic Coffee |
- 44.0482 |
- 60.3535 |
-3.4112 |
0,1253 |
0,1460 |
Before estimating the GARCH models, it was necessary to run the ARCH test to verify the presence or not of heteroskedasticity in the return residuals. Hence, the LM (Lagrange Multiplier) test was done as proposed by Engle (1982). The test values are presented in Table 3. However, it can be noted by the evidences showed from the test against the null hypothesis the inexistence of conditional heteroskedasticity in the return residuals of the Arabic coffee.
Table 3 – ARCH Test.
Lag |
F stat |
Prob |
LM |
5 |
13.9932 |
0.0000 |
82.0132 |
After the stationary confirmation, the ARMA models selection was done for the equation estimation of the Arabic coffee series return mean, so that the serial correlation problem could be eliminated. Based on the Akaike (AIC) and Schwartz (SBC) information criteria, among the analyzed models the AR (2) model was chosen.
A series of persistency and asymmetric models (ARCH family) were developed, in order to observe the dynamics of the volatility of the price returns of the Arabic coffee. Therefore, twelve models were calibrated using three types of distributions for the residuals: normal (Gaussian), t Student and Generalized Error Distribution (GED).
The models detached in dark in Table 4 where the ones with better prediction results. An important characteristic of the analysis was that the models that considered different conditional distribution from the normal (Gaussian) presented better results. The utilized software to estimate the data and model regression was the EVIEWS 7.0.
Table 4 - Criteria selection among error distributions of considered models
Model |
Error Distribution |
AIC |
SBC |
Log-likelihood |
AR (2) GARCH (1.1) |
Normal Student t GED |
-5.3679 -5.4514 -5.4623 |
-5.3588 -5.4400 -5.4509 |
6912.55 7020.93 7034.99 |
AR (2) EGARCH (1.1) |
Normal Student t GED |
-5.3754 -5.4659 -5.4645 |
-5.3640 -5.4593 -5.4508 |
6923.10 7043.89 7038.79 |
AR (2) TARCH (1.1) |
Normal Student t GED |
-5.3762 -5.4536 -5.4653 |
-5.3648 -5.4399 -5.4516 |
6924.17 7024.81 7039.82 |
Source: author's estimation.

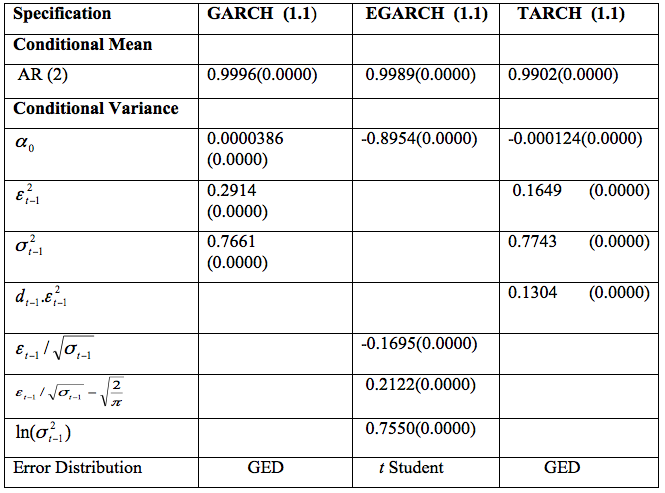
Table 5 – Models estimation results
Source: Research results.
Note: The numbers between the parentheses are the probability values (p-value) at a 5% level of significance.
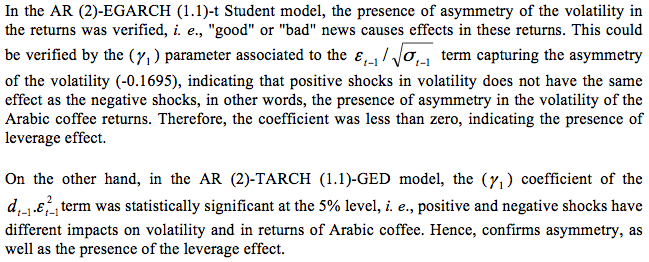
In order to verify the performing evaluation measures of the predictive capacity of the models, information criteria of Akaike (AIC), Schwartz (SBC), log-likelihood, Mean Absolute Error (MAE) and Theil-U coefficient were used. The results are presented in Table 6. Therefore, the best model for Arabic Coffee volatility price prevision is the AR (2) - EGARCH (1.1) – t student. The Brazilian Arabic Coffee variance returns are subject to asymmetry, as well as leverage effect. This result was also confirmed by Mól (2008). However in relation to persistency, the chosen model presents a value of 0.76. By observing the Theil-U coefficient, one can say that the model is acceptable since the U statistic is less than one, indicating its ability of making more precise predictions. Hence, market information are asymmetric and negative news, such as crop failure, bad climatic conditions, plague and diseases, among others, that directly affect Arabic Coffee production, contributing in expressive way in the product price volatility.
Table 6 – Quality Measures of the Models
Model |
MAE |
AIC |
SBC |
Ln (L) |
Theil-U |
AR (2) – GARCH (1.1) |
0.0149 |
-5.4623 |
-5.4509 |
7034.99 |
0.9984 |
AR (2) – EGARCH (1.1) |
0.0149* |
-5.659* |
-5.4593* |
7043.89* |
0.9980* |
AR (2) – TARCH (1.1) |
0.0149 |
-5.4653 |
-5.4516 |
7039.82 |
0.9983 |
Source: Research results.
AIC is the Akaike's information criteria. SBC is the Schwartz information criteria.
Ln (L) is the maximum log-likelihood of the estimated model.
MAE is the Mean Absolute Error
* denotes the best model according to the used criteria.
The consequences of constant global price changes for food production, commodity trade and nutrition security in developing countries, like Brazil, yields the need for an appropriate volatility model for spot commodity prices. Therefore, the use of heteroskedasticity models was essential to the Arabic Coffee price volatility analysis done in this paper, since in the economic literature research involving coffee production channels are scarce, in view of the complexity of the macroeconomics aspects engaged in the subject. The models used present recent methodological advances in treating Arabic Coffee price returns, serving as important tools in risk management by investors.
Hence, this paper discusses an empirical analysis of Arabic Coffee price returns, using AR (2) - GARCH (1.1) - GED.AR (2) - EGARCH (1.1) - t Student and AR (2) - TARCH (1.1) - GED models.
The results showed persistency and asymmetrical reactions in volatility, i. e., positive and negative shocks had different impacts on the volatility of the returns, what was confirmed in the literature by EGARCH (1.1) e TARCH (2.1) models.
Based on the Akaike, Schwartz, log-likelihood, Mean Absolute Error and Theil-U coefficient criteria, the chosen model for the volatility prevision was AR (2) – EGARCH (1.1) - t student. The Coffee Arabic price returns volatility shows strong signs of asymmetry, indicating that negative and positive shocks have different impacts on returns volatility. It was seen that the shocks tend to reverberate for some time. The coffee market situation presents all times strong confirmation evidences of that result, since the supply shock yields increases in price levels of the commodity.
Finally, the empirical results suggest the utilization of the proper strategic instruments of hedging in view of the accentuated shock persistency in Arabic Coffee price volatility returns.
Bollerslev, T. (1986). Generalized autoregressive conditional heteroskedasticity. Journal of Econometrics, 31(3): 307 – 327.
Campos, K. C.; Campos, R. T. (2007). Volatilidade de preços de produtos agrícolas: uma análise comparativa para soja, café, milho e boi gordo. In: XLV Congresso da Sociedade Brasileira de Economia e Sociologia Rural. Londrina, Paraná.
Dickey, D.A.; Fuller, W.A (1979). Distribution of the estimators for autoregressive times series with unit root. Journal of the American Statistical Association, 74(4): 427-431.
Engle, R. F. (1982). Autoregressive conditional heteroskedasticity with estimates of the variance of United Kingdom inflation. Econométrica, 50(4): 987-1007.
Glosten, L. R.; Jagannathan, R.; Runkle, D. E. (1993). On the relation between the expected value and the volatility of the nominal excess returns on stocks. Journal of Finance, 48(4): 1779-1801.
Jarque, C.; Bera, A. (1987). Test for normality of observations and regression residuals. International Statistical Review. 55(2): 163-172.
Kwiatkowski, D.; Phillips, P.C.B.; Schmidt, P.; Shin, Y. (1992). Testing the null hypothesis of stationarity against the alternative of a unit root: How sure are we that economic time series have a unit root? Journal of Econometrics, 54(2): 159–178.
Martins, C. M. F. (2005). A volatilidade nos preços futuro do café brasileiro e seus principais elementos causadores. 2005. Dissertação de Mestrado em Administração, Universidade Federal de Lavras - UFLA, Lavras.
Mól, A. L. R. (2008). Séries de tempo com erros não lineares: uma avaliação da persistência e assimetria na volatilidade de derivativos de café e boi gordo na BM&F. INTERFACE, 5(2): 55-69.
Mól, A. L. R.; Junior, L. G. C.; Sáfadi, T. (2003). Valueatrisk dos ajustes diários: o uso de modelos heteroscedásticos em preços futuros do café. Revista BM&F, n. 160.
Monte, L. F.O. (2007). Análise da volatilidade nos preços do cacau no mercado de futuros de Nova York (CSE): uma aplicação dos modelos GARCH, 164f. Dissertação de Mestrado em Economia, Universidade da Amazônia - UNAMA, Belém.
Moraes, L.; Silva, C. A. G. (2010). Análise da volatilidade do preço do café: uma aplicação dos modelos EWMA e GARCH. In: XVII Simpósio de Engenharia de Produção – SIMPEP 2010, Bauru.
Nelson, D. B. (1991). Conditional heteroskedasticity in asset returns: a new approach. Econometrica. 59(2): 347 – 370.
Pereira, V. F.; Lima, J. E.; Braga, M. J.; Mendonça, T. G. (2010). Volatilidade condicional dos retornos de commodities agropecuárias brasileiras. Revista de Economia, 36(34): 73-94.
Phillips, P.C.B.; Perron, P. (1988). Testing for a unit root in time series regression. Biometrika, 75(3): 335-346.
Sachs, R. C. C.; Margarido, M. A. (2007). Análise da volatilidade dos preços do boi gordo no Estado de São Paulo: uma aplicação dos Modelos ARCH/GARCH. In: XLV Congresso da Sociedade Brasileira de Economia e Sociologia Rural, 2007, Londrina, Paraná.
Silva, C. A. G. (2008). Análise da volatilidade do boi gordo no Estado de São Paulo: uma aplicação dos modelos GARCH. In: XLVI Congresso da Sociedade Brasileira de Economia e Sociologia Rural, 2008, Rio Branco, Acre.
Silva, W. S. S., Sáfadi, T.; Junior, L. G. C.(2005). Uma análise empírica da volatilidade do retorno de commodities agrícolas utilizando modelos ARCH: os casos do café e da soja. Revista de Economia Rural, Rio de Janeiro, 43(1): 119-134.
Zakoian, J. M. (1994) Threshold heteroskedasticty models. Journal of Economic Dynamics and Control, 18(6): 931-955.
1. Professor Visitante. Universidade do Estado do Rio de Janeiro (UERJ). E-mail: carlos.silva@uerj.br / gon7silva@gmail.com
2. Professor Visitante. Universidade do Estado do Rio de Janeiro (UERJ). E-mail: carlos.silva@uerj.br / gon7silva@gmail.com
4. Associação Brasileira da Indústria do Café (ABIC), in portuguese.
5. See "The use of ARCH/GARCH models in applied econometrics".
6. Exponential Generalized Autoregressive Conditional Heteroskedasticity model (EGARCH).
7. See Dickey and Fuller (2007).
8. See Phillips and Perron (1988).
9. See Kwiatkowski et al. (1992).
10. See Jarque and Bera (1987).