
 HOME | ÍNDICE POR TÍTULO | NORMAS PUBLICACIÓN
 Espacios. Vol. 37 (Nº 19) Año 2016. Pág. 14
Júlia Ferreira TESSLER; Johan Hendrik POKER Jr. 1; Marco Antonio SILVEIRA; Marco Antonio Figueiredo MILANO Filho; Márcio Marcelo BELLI
Recibido: 09/03/16 • Aprobado: 23/03/2016
ABSTRACT: Based on what is proposed in the literature on the subject, this study calculates the Value-Added Intellectual Coefficient (VAIC™) of 24 Brazilian capital intensive companies, registered at the BM&FBovespa, and analyzes their relationship with the ratio of market value to accounting value. The relationship between tangibility (market-to-book ratio) of these organizations with the investment made by these companies in their intellectual capital was analyzed. When using a panel data model with robust regression, the statistical significance in the relationship between the components of VAIC™ and the market indicator were identified, evidencing that the investment in intellectual capital brings returns even to the capital intensive sampled companies. |
RESUMO: Baseado no que é proposto na literatura sobre o assunto, este estudo calcula o coeficiente intelectual de valor acrescentado (VAIC™) de 24 capitais intensivas empresas brasileiras, registradas na BM & FBovespa e analisa a sua relação com a proporção do valor de mercado para valor contábil. Foi analisada a relação entre tangibilidade (relação de mercado-para-livro) dessas organizações com o investimento feito por estas empresas em seu capital intelectual. Ao usar um modelo de dados de painel com regressão robusta, a significância estatística das relações entre os componentes do VAIC™ e o indicador de mercado foram identificados, evidenciando que o investimento em capital intelectual traz retornos até à capital intensivo amostradas empresas. |
Organizations acting in a variety of fields depend on their ability to innovate to survive, not only creating additional value for its investors, but also maintaining themselves within the business environment. Even organizations whose activities do not involve competing depend on innovation to suit a market in constant change as they can not survive on their own, apart from the system. The necessary innovations so that these organizations are kept competitive, and fulfill their social role, stem from their intellectual capital, understood here as the combination of human capital, structural and relational. However, the concept of intellectual capital is complex and, as a result, it creates challenges for managers who want to use it actively in creating value for the company.
Researchers dedicated to understanding the concept have been trying to characterize it in order to build measurable models of the relationship between investment in intellectual capital developing elements and generate value from these investments. A key element of such models' structure is the concept of intangible assets, which are those assets that have no value assigned for accounting purposes, but aggregate market value and thus their knowledge and identification are of interest to organizations. Given the importance of these assets to create value in organizations, there is a growing interest in obtaining appropriate ways of measuring the benefits of investment in intangible assets as well as investment in other elements with potential for creating intellectual capital. Intangible assets and other creative elements of intellectual capital are directly linked with the generated innovation in an organization. This happens because of the nature of these assets: they generally come from the knowledge and intellectual capacity of people who make up the company, directly or indirectly, including not only the internal generation, but also the decision-making capacity as well as the innovation acquisitions. Therefore, the ability to innovate depends on the intellectual capital and, those being intangible assets, both generate market value. Moreover, there is a pursuit for increasing efficiency and effectiveness of an organization in generating innovation.
Thus, the aim of this paper is to present a study that employs components of the VAIC™ (Value-Added Intellectual Coefficient) index to measure variations in investment in elements that result in the creation of intellectual capital as a way of assessing the value of knowledge and the efficiency and effectiveness of the organization to use these resources to create value. This study lists the VAIC ™ index components with a tangibility indicator of organizational assets, the market-to-book ratio, evaluating the index's ability to predict changes in the tangibility of the company's value and analyzing the relationship between its components and the tangibility, measuring the relative contributions of each to the organization. The sample used comprises companies listed on the stock exchange, which have concomitantly reported data on their spending on wages and benefits according to iBase's proposed model, which details the spending benefits to human capital and has proved itself relevant to the success of the study.
The quest for an effective way to represent intangible assets as a composite of economic factors brought interesting contributions to academia. Among the proposed ways to do so stands the Value-Added Intellectual Coefficient (VAIC™) created and tested by Pulic (2000, 2002 and 2004) and Pulic et al. (2009). As defined in the study, the VAIC™ is an index that evaluates the efficiency of the organization to generate value from their intellectual capital.
Intellectual capital is understood as "those resources that have no physical existence, but still represent value to the organization" (Edvinsson and Malone, 1998). For this study, the capital is defined by Silveira view (intellectual 2011), in line with the studies of Roos et al. (1997), Roos (2003) and Viedma (2004), as the sum of human capital (knowledge and skills of employees), structural capital (intellectual property) and relationship capital (whatever derives from relationship with other organizations and stakeholders – they are vital parts for the existence of the organization, but are not part of it; e.g. shareholders, customers, suppliers, surrounding communities, etc.).
The VAIC™ suggests that the relationship between expenditure in organizations and their performance in generating intellectual capital should be reviewed, and that while some outlays are positive for the intellectual capital generation, others are detrimental. Thus, organization expenditures with employee welfare, media expansion, training, improvement of integrated management systems, etc. are understood as factors that aid in the human capital efficiency and therefore in intellectual capital. Similarly, costs to repair damage to workers' health caused by exposure to an unhealthy work environment, are considered negative factors to the creation of human capital. Accordingly, many factors considered costs are, in the view of the creators of VAIC™, investments.
The current literature has been evaluating VAIC ™ and its applications, as well as suggesting changes to its calculation. Firer and Williams (2003) analyzed capital intensive companies from South Africa and, using the VAIC™ method, concluded that intellectual capital still isn't the most significant source of corporate performance. Chen, Cheng & Hwang (2005), on the other hand, pointed the aforementioned conclusion (that there is no relationship between intellectual capital and the profit of an organization) as a flaw in the methodology, as the authors achieved a strong relationship between the same factors using the same methodology. Chen, Cheng & Hwang (2005) also pointed out a flaw in the calculation of VAIC™, which does not consider the full value of the structural capital by ignoring the innovation capital of the organizations. With these factors in mind, the authors proposed a major change to the VAIC™ formula.
As a way to approximate the VAIC™ calculation with the organizational reality, Chen, Cheng & Hwang (2005) proposed that spending on research and development, as well as on marketing and advertising, played an important role in the outcome of the calculation, including variables in structural capital. With the addition of these new data, the authors concluded that the change was significant for the search result by improving the understanding of the structural capital of a company. Chang (2008) analyzed the VAIC ™ to a sample of IT companies in Taiwan and also identified flaws in the formula: the author suggests that more information should be added to the calculation of VAIC™ in order to make the analysis closer to reality. Just as Chen, Cheng & Hwang (2005), Chang (2008) also found a strong relationship between intellectual capital of an organization and its market value and profit.
Recently, Iazzolino, Laise & Migliano (2014) resumed the comparison of VAIC™ with EVA™ (Economic Value-Added, measurement of competition related value creation). Their results show that the relationship between the variables is not direct, the implication being the possibility of considering the VAIC™ only as an indicator of intellectual capital creation, and complementing the EVA™, a consolidated financial value creation measurement instrument, promoting the analysis of value combined with the intellectual capital preservation, thus promoting organizational sustainability.
In Brazil, Basso, Martin & Richieri (2009) analyzed 33 Brazilian open capital companies with shares available on BM&FBovespa, from various sectors, and achieved results consistent with those from Chen, Cheng & Hwang (2005) and Firer and Williams (2003) in regard to the efficiency of intangible assets on the market value (market value to accounting value ratio). The authors state that all methods of measuring intellectual capital are sensitive to fluctuations in the stock market. Like other authors, Basso, Martin & Richieri (2009, page 14) suggest:
"The adoption of a model that uses additional explanatory variables, expanding the model's explanatory capacity for structural and human capital and the analysis of the regressions using a distributed lag model, which considers lagged values for the variables of human capital and structural capital and; verification of results in a larger sample and segmented by sector, are suggestions for future studies."
First a sample of organizations was defined, conditional to companies that submitted all necessary data to calculate the VAIC™. The choice of open capital companies was made based on the ease of finding such data. Using the 'Balanço Social' website (online database - www.balancosocial.org - contains and offers, free of charge and in an organized manner, the financial data of several Brazilian companies), maintained by iBase, the Capital IQ website (online broad base - www.capitaliq.com - containing financial information about companies around the world, maintained by Standard & Poor's) and the 'Valor 1000' magazine (August 2012, year 12, number 12), we generated a database with information about 24 companies (the most capital-intensive) during the interval between 1997 and 2008 (varying by company, according to data availability for each organization). Among the 24 national companies studied are large companies in capital intensive, such as: Petrobrás, Usiminas, Eletrobrás, Gerdau, Cemig, CPFL Energia, CSN, Embraer, Tractebel, SABESP, Suzano, TAM, SANEPAR, BR Distribuidora, Elektro, Pão de Açúcar group, Tupy, Randon, Marcopolo, CTEEP, Marisol, DIMEP, INEPAR and EMBRATEL.
Regression studies based on the listed data were made, on a year basis with panel data, analyzing the gaps between the different components of the VAIC™ index and the relationship between the market value and the book value.
According to Pulic (2004), the accounting interpretation of value-added is given by:
VA = OP + EC + D + A (1)
Where:
VA: value-added;
OP: operating revenue;
EC: employee costs;
D: depreciation;
A: amortization.
With modifications suggested in Firer & Williams (2003) and Chen, Cheng & Hwang (2005) in the value-added formula (1):
VA = DIV + RE + EC + A + D + I (2)
Where:
DIV: dividends;
RE: retained earnings.
Therefore, value-added is a way of evaluating organizational efficiency related to it's invested capital. In a simplified way (for better understanting):
VA = CI x (rCI – cCI) (3)
Whereas:
CI: invested capital;
rCI: return on invested capital;
cCI: cost of invested capital.
Once value-added is defined, it's possible to measure intellectual capital's efficiency in generating value-added. Hence, intellectual capital is split as previously mentioned between human and structural capital. Since it's not possible to express relational capital by tangible values, this efficiency is not part of the final sum. Therefore, the components for VAIC™ calculations are as follows:
ECH = VA/CH (4)
Where:
CS = VA – CH (5)
Therefore:
ECS = CS/VA (6)
Whereas:
ECH: human capital efficiency;
ECS: structural capital efficiency;
CH: human capital;
CS: structural capital.
This way, intellectual capital's efficiency if given by the sum of (4) and (6), which is:
ECI = ECH + ECS (7)
Pulic (2004) added another efficiency measure, for employed capital, given by:
ECE = VA/BV (8)
Where:
ECE: employed capital efficiency;
BV: book value of net assets of the organization.
Therefore, VAIC™ is given by the sum of efficiencies (4), (6) and (8):
VAIC = ECH + ECS + ECE (9)
Or, applying (7):
VAIC = ECI + ECE (10)
The greatest challenge faced during the database installation step and VAIC™ calculation occurred due to the lack of available data by Brazilian organizations. Although there is great incentive for the transparency of financial data, any data that goes beyond financial accounting, as expenses for salaries and benefits, are difficult to obtain and, even when found they are hardly organized and clear, and are often incomplete, as depicted in Figure 1, presenting barriers for the study. Given the difficulties encountered, it was still possible to build a proper historical basis for 24 companies among the analyzed.
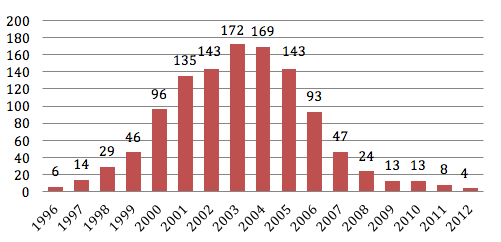
Figure 1 – Number of companies with reports available on the iBase per year (Source: author's study)
The currency conversion (Real to dollar, according to timely price equivalence) of all data in the database was necessary to ensure the uniformity of the sampled data.
A panel data analysis with robust regression with temporal dummies was conducted for data analysis. This way, auto-regressive results were found. Robust regression was needed due to heteroscedasticity indicated by Wald test (p-value inferior to 1%). On the other hand, fixed effects were indicated by Hausman test (p-value 5.53%) and used in the data analysis.
The sample used in this study is only representative for a few sectors (capital intensive companies, in particular), but, though it's not a generalized view of Brazilian organizational scenery, it still presented interesting results. Using descriptive statistics and comparative results proved such.
With robust regression, the unconformity between human and structural capital with economic capital's significance was reduced. This shows that, even though economic capital is the strongest one, efficiency of human and structural capitals were significant.
As Gretl's output for the analysis of the components of VAIC™ for the selected sample shows us (Table 1), the R-squared test indicates that the presented data follows a linear relation. Economic capital's efficiency (ECE) is the one with strongest statistical evidence concerning it's market-to-book ratio, although, with dummies, human and structural capital also showed statistical significance (with 10% of confidence), indicating that investments in human and structural capital also bring financial contributions to the organization, though not immediately. The evidence found for the indicators of human and structural capital efficiencies show their contributions as consolidators of financial value, for they reduce the distance between the organization's market-to-book values.
|
Coefficient |
Standard Error |
t-value |
p-value |
|
||
Intercept |
2.18091 |
1.29319 |
1.686 |
0.0997 |
* |
||
ECH |
-7.50E-05 |
0.00165306 |
-0.04537 |
0.964 |
|||
ECH_1 |
-0.00305431 |
0.00160326 |
-1.905 |
0.0642 |
* |
||
ECH_2 |
0.00187615 |
0.00102229 |
1.835 |
0.0741 |
* |
||
ECS |
-1.40997 |
1.39617 |
-1.01 |
0.3188 |
|||
ECS_1 |
-1.460829 |
0.917869 |
-1.752 |
0.0876 |
* |
||
ECS_2 |
0.187808 |
9.98E-01 |
0.1883 |
0.8516 |
|||
ECE |
4.08E-06 |
1.55E-06 |
2.631 |
0.0121 |
** |
||
ECE_1 |
3.03E-06 |
1.38E-06 |
2.193 |
0.0344 |
** |
||
ECE_2 |
3.39E-07 |
6.65E-07 |
0.5104 |
0.6127 |
|||
Dependent Variable Mean |
1.830749 |
Dependent Variable Std. Dev. |
1.38658 |
||||
Residuals Sum of Squares |
10.90089 |
Standard Error (regression) |
0.52869 |
||||
R-Squared |
0.920142 |
R-Squared (regression) |
0.85462 |
||||
F(32, 39) |
14.0428 |
p-value (F) |
3E-13 |
||||
log(Likelihood) |
-34.202 |
Akaike |
134.404 |
||||
Schwarz |
209.534 |
Mannan-Quinn |
164.313 |
||||
ρ |
0.195338 |
Durbin-Watson |
1.27267 |
||||
Test: |
|
||||||
Null Hypotesis |
Groups have equal intercepts |
||||||
Test Statistic |
F(23, 39) = 15.1794 |
||||||
p-value |
P(F(23, 39) > 15.1794) = 4.99478E-013 |
||||||
Table 1 – output of the VAIC™ components regression by software Gretl with temporal dummies Source: author's study
Based on the gathered results, there is evidence of a relationship between the components of VAIC™ and the market-to-book ratio, confirming the hypothesis that the intellectual capital contributes to create value for organizations, including capital intensive ones.
Difficulties encountered during this study made clear there is a need to encourage organizations to disclose their financial data relating to wages and benefits, as with the disclosure of this data further study on the efficiency of intellectual capital in the organization's value can be developed, enabling organizational strategies to be developed based on investment in intellectual capital. Interest in the VAIC™ calculation should not be purely academic, but widespread.
BASSO, Leonardo Fernando Cruz; MARTIN, Diogenes Manuel Leiva; RICHIERI, Flávio. Intellectual Capital and the creation of value in Brazilian companies. International Conference on Strategic Management in Latin America. São Paulo. SP. Brasil. 2009. Retrieved May 8, 2014: < http://papers.ssrn.com/sol3/papers.cfm?abstract_id=1081849>.
CHANG, Shu-Lien. Valuing intellectual capital and firms' performance – modifying Value-Added Intellectual Coefficient (VAIC™) in Taiwan IT industry. European Conference. 2008.
CHEN, Ming-Chin; CHENG, Shu-Ju; HWANG, Yuhchang. An empirical investigation of the relationship between intellectual capital and firms' market value and financial performance. In: Journal of Intellectual Capital, Vol. 6, No. 2 (pp. 159-176). 2005.
EDVINSSON, Leif; MALONE, Michael. Intellectual Capital: Realizing Your Company's True Value by Finding Its Hidden Roots, HarperCollins Publishers, Inc., Nova Iorque. 1997.
FIRER, Steven; WILLIAMS, S. Mitchell. Intellectual capital and traditional measures of corporate performance. In: Journal of Intellectual Capital, Vol. 4, No. 3 (pp. 348-360). 2003.
IAZZOLINO, Gianpaolo; LAISE, Domenico; MIGLIANO, Giuseppe. Measuring value creation: VAIC and EVA. In: Measuring Business Excellence, Vol. 18. No. 1 (pp. 8-21). 2014.
ROOS, Johan; ROOS, Goran; DRAGONETTI, Nicola Carlo; EDVINSSON, Leif. Intellectual Capital: navigating in the new business landscape. Houndmills: MacMillan Press Ltd, Londres. 1997.
ROOS, Goran. An Intellectual Capital Primer.In: Centre for Business Performance. Cranfield University, Cranfield, Bedfordshire, Reino Unido. (pp. 1 – 25). Maio de 2013.
SILVEIRA, Marco Antônio; MAIA, L. O., FIORAVANTI, M. Aprendizagem organizacional para a sustentabilidade: integração ao trabalho e valorização do fator humano. In: Gestão da sustentabilidade organizacional: inovação, aprendizagem e capital humano. Silveira, M. A. (org). Campinas, SP, Brasil. CTI (Center for Information Technology Renato Archer). 2011.
SILVEIRA, Marco Antônio. Gestão estratégica para a sustentabilidade organizacional: capital humano e os processos de inovação e aprendizagem. In: Gestão da Sustentabilidade Organizacional. Vol. 2. Silveira M. A. (org.). pp. 21 - 46. Campinas, SP, Brasil. CTI (Center for Information Technology Renato Archer). 2011.
VIEDMA, José María. Social Capital Benchmarking System. In:Journal of Intellectual Capital; 5.3.; ABI/INFORM Global (pp. 426 – 442). 2004.
1. corresponding author. Email: johanpokerjr@gmail.com