![]() ISSN 0798 1015
ISSN 0798 1015

![]() ISSN 0798 1015
ISSN 0798 1015
Vol. 38 (Nº 03) Año 2017. Pág. 5
Renato Borges FERNANDES 1; Bruna Suelen MARTINS; Ronaldo Pereira CAIXETA; Custódio Genésio da COSTA FILHO; Guilherme André BRAGA; Luiz Marcelo ANTONIALLI
Recibido: 02/08/16 • Aprobado: 15/08/2016
ABSTRACT: The aim of this study was to analyze the consistency of an instrument for quality of work life evaluation proposed by Walton (1973), based on adequate and fair compensations, working conditions, use of capacities, opportunities, social integration and constitutionalism at work, occupied space by work in the life, and social relevance and importance of work dimensions. Thus, a field research was conducted through a survey with 518 higher education institution employees in a town of Minas Gerais state. So, an analysis of structural equations was performed using the partial least squares method (PLS). The results showed that adequate and fair compensations, working conditions, constitutionalism and occupied space by work in the life dimensions are suited for the analysis presented. |
RESUMO: O objetivo deste estudo foi analisar a consistência de um instrumento de avaliação de qualidade de vida do trabalho proposto por Walton (1973), com base nas dimensões de compensações justas e adequadas, condições, uso de capacidades, oportunidades, integração social e constitucionalismo no trabalho, espaço ocupado pelo trabalho na vida e relevância social e importância do trabalho. Assim, foi conduzida uma pesquisa de campo, por meio de um survey, com 518 colaboradores de uma instituição de ensino superior do interior de Minas Gerais. Foi, então, realizada uma análise de equações estruturais, utilizando-se o método de mínimos quadrados parciais (PLS). Os resultados demonstraram que as dimensões compensações justas e adequadas, condições de trabalho, constitucionalismo no trabalho e espaço ocupado pelo trabalho na vida se adequam à análise proposta. |

The quality of work life (QWL) is getting greater proportions, due to advances of studies on the subject, which was retaken in 1974 due to the global energy crisis and inflation. It is a derivation of the Total Quality which was developed in Japan from 1980, where management techniques have been inserted in order to ensure it.
From the results achieved by Japan, the issue gained visibility in 1990. Nowadays, it is widespread, more broadly, in countries like USA, Canada and others from Europe and Asia. In Brazil, the theme has been the object of studies in Management and Psychology, although only in the 1980s, it has been inserted in the work context (Quirino & Xavier, 1987).
It is important to highlight that the pioneering work on the subject were carried out by Walton (1973), Hackman and Oldham (1975), Westley (1979), Werther and Davis (1983), and Nadler and Lawler (1983), which created measurement models of QWL. Especially, Walton’s model (1973) has a larger number of dimensions that are based on payment, environment, opportunities and personal life versus work.
In Brazil, the instrument proposed by Walton was translated and adapted initially by Fernandes (1996) and has been modified by Detoni (2001) and Timossi, Pedroso, Pilatti and Francisco (2009). Timossi et al. (2009) also sought to validate, even if superficially, the adapted model, using the Cronbach Alpha to analyze the internal consistency of a scale. However, this index is not able, by itself, to validate a research tool, and the index itself has been criticized about its efficiency to measure the internal consistency (Marôco & Garcia-Marques, 2006). Thus, it is questionable: can the instrument translated and adapted by Fernandes (1996), Detoni (2001) and Timossi et al. (2009), from Walton (1973), to assess the life quality at work be validated? Are its dimensions statistically consistent? What are the degrees of relevance of each dimension to explain the life quality at work?
From these questions, it was defined as objective of this study to analyze the consistency of an instrument for assessing life quality at work, translated by Fernandes (1996) and modified by Detoni (2001) and Timossi et al. (2009), from the original model proposed by Walton (1973), based on the dimensions: Adequate and Fair Compensations, Working Conditions, Use of capacities at work, Opportunities at work, Social Integration at work, Constitutionalism at work, Occupied space by work in life and Social Relevance and Importance of the work.
The relevance of this study is the evaluation of a research tool that can be used to check if there is QWL within organizations, as well as serve as a source of information for future research on the subject.
According to Lau (2000), the concern to obtain constructs that define the theme quality of work life (QWL) is increasing, because of the need to create conceptual frameworks (Limongi-França, 2010), the need to characterize something complex and multidimensional in search of a universal definition (Keith, 2001), or even to meet the organizations regarding the various problems related to work routines (Laschinger, Finegan, Shamian, & Almost, 2001; Sirgy, Efraty, Siegel, & Lee, 2001; Martel & Dupuis, 2006).
Although there are authors who argue about the difficulty or impossibility of reaching a universal definition (Westley, 1979; Keith, 2001), there are several authors seeking to determine it. In the 1970s, Walton (1973, p. 11) argues that QWL is a term that represents environmental and human principles, but that were suspended because of the technological evolution and economic development. The author believed that industrial society neglects these principles, focusing on technological and economic developments. Walton’s point of view (1973) met at this time, the development of an international competition of US front the great gains achieved with the management styles and techniques of the Japanese productivity programs, which focused on the idea of work as something noble, and the means for self-realization.
Following this thought, Hackman and Oldham (1975) state that the QWL is forcefully linked to internal motivation aspects, job satisfaction and the function enrichment. Broadly, the QWL depends, precisely, on the harmony between work and other personal aspects, the organization’s social role and the relevance of fitting productivity with QWL (Walton, 1973).
Hackman and Oldham (1975), emphasizing the perception of the individual in relation to his work, say that the approach of life quality at work is related to the tasks performed by its responsible and encompass both goals attributes of tasks and the appreciation of what the individual makes from the variable determinations of his work environment.
Thus, it is also pointed out that among the main aspects worked in the organizations are the enrichment of the role and tasks, motivation, personal satisfaction, commitment, achievement of leisure, physical and cultural activities (Kirby & Harter, 2001; David, Brazil, Krueger, Lohfeld, & Tjam, 2001; Yates, Lewchuk, & Stewart, 2001; Martel & Dupuis, 2006). According to this, it is understood that the importance of life quality refers to the human being in a holistic manner, in order to gather the biological, psychological, social and organizational domains (Limongi-França, 2009). According to Quirino and Xavier (1987), the QWL represents the globalization of these aspects that were discussed separately.
In the same decade of the works of Walton (1973) and Hackman and Oldham (1975), Westley (1979) argued that the QWL is a side and an improvement of the Total Quality (TQ). In this sense, Rodrigues (2002) and Limongi-França (2010) state that the QWL should be considered more broadly, in which factors relating to welfare, such as health guarantee, are linked to it in order to cover the context of work significance. About the link between the QWL and TQ, Limongi-França (2010) states that the productivity challenge in organizations is the essential condition for the productive environment of the organization, which should offer better conditions of safety and health at work. As the author observes, while running a job, the individual is introduced in a broader social context and the social concept of this activity causes influence in his personal life and in the job satisfaction, resulting in greater or lesser wear situations.
From the organizations’ perspective, the importance of QWL is associated with an understanding of the existing problems in the routine of working means. Thus, the QWL is indispensable for the improvement of internal processes and the relationship with people (Laschinger et al., 2001; Sirgy et al., 2001; Martel & Dupuis, 2006), contributing to the feeling of welfare, increasing the employee productivity, promoting knowledge updating, reducing absenteeism and increasing affective commitment (Shirrmeister & Limongi-França, 2012).
Regarding the occupational well-being, according to Horn, Taris, Schaufeli and Scheurs (2004), these aspects are evident: i) affective, as the emotional well-being, the lack of emotional exhaustion and affective commitment; ii) professionals, such as autonomy, aspiration and professional competence; iii) social, such as the lack of depersonalization; iv) cognitive, as the ability to focus, and; v) psychosomatic, as the absence of complaints in this regard. Other studies show that job satisfaction is interpreted as a means of affective relationship and is considered as a related aspect to the organizational commitment, the self-realization and the relationship in the workplace (Mathieu & Zajac, 1990; Meyer, Stanley, Herscovitch, & Topolnytsky, 2002; Siqueira & Gomide, 2004).
As noted by Walton (1973, p. 11), organizations focused on the “experience quality in the working environment”, rather than the life quality at work, because at that time, the life quality at work was seen as an inversely proportional measure to the revenues of the organization. However, Limongi-França (2010) states that when the vision of the entrepreneur is consolidated, he does not look at the money that capitalizes on better living situations at work as an expense, but still as an investment, which, undoubtedly, that will rescue him to a full-sphere, where the life quality at work represents the quality of their products, the productivity and therefore higher competitiveness. So the quality of life in its meaning to work may be a strategy to increase the market value of the company (Karthik, 2013; Tulasi & Vijayalakshmi, 2013).
Especially in the managerial sphere, in a survey conducted in England, it was pointed out that job satisfaction is reducing, which includes the deterioration of health and the sense of well-being (Worrall & Cooper, 2012). As a result, it is essential to check the degree of well-being and self-esteem of workers as means to ensure the life quality at work (Walton, 1973).
Throughout this context presented above, the concern for the quality of life in the job perspective is attracting more interest, not only academic but also in organizational practice, in order to improve those conditions (Chitakornkijsil, 2010). This is a problem that affects the most of workers, which leads to negative consequences both for the organization and for workers (Walton, 1973).
According to Walton (1973), regardless of their occupation, most of employees are affected by dissatisfaction with life at work. However, it is a complex problem due to the difficulty to identify the responsible factors for the worker’s quality of life in the workplace (Walton, 1973). In this sense, Walton (1973) proposed parameters that influence such issue in order to measure the interrelationship between them.
Walton (1973) suggests eight categories to assess QWL: 1) Adequate and fair compensation; 2) safe and healthy working conditions; 3) opportunity to use and develop human capacities; 4) opportunity to growth and security; 5) social integration in the work organisation; 6) constitution in the work organisation 7) work and total life span; and 8) social relevance of work life. The descriptions for each category proposed by Walton (1973, 1975) can be observed as follows:
Adequate and fair compensation: related to payment and aspects such as work situations, responsibility and training. Parameters such as share of profits and results, relationship between supply and demand and population salary average show if there is justice in payment. Thus, it must meet workers’ needs but must also not have significant differences between the wages of him, compared with the same function in other companies (Walton, 1973; Fernandes, 1996). It is the means that the worker uses to sustain himself (Detoni, 2001; Timossi et al., 2009). Fernandes (1996) conducted a subdivision of this criterion in intern and extern equity, proportionality between wages, justice on compensation and sharing of productivity gains. In turn, these were reorganized as salary equilibrium, fair payment, profit sharing and extra benefits (Detoni, 2001). Timossi et al. (2009), on the other hand, made a last change in the terms used, replacing fair compensation for wages, salary equilibrium for comparing the salaries of their colleagues, profit sharing for rewards, extra benefits for food, transportation, medical, dentist etc.
Safe and healthy working conditions: this dimension covers the physical conditions and working hours as overtime payment, situations that reduce the risk of accidents and health problems. To have an adjustment of working conditions, it is necessary to reduce the aspects that can harm the worker in their tasks, such as visual pollution, noise and odors (WALTON, 1973; Fernandes, 1996). It is related to the healthiness of the work environment (Detoni, 2001; Timossi et al., 2009). It was organized as reasonable working hours, safe and healthy physical environment and absence of unhealthiness (Fernandes, 1996). Later, they were classified in weekly working hours, workload, fatigue, personal and collective protective equipment, healthiness and process technology (Detoni, 2001). The terms have been changed from weekly working hours to the amount of worked hours, workload to amount of work, process technology to use of technology, machinery and equipment at work, healthiness to working conditions, personal and collective protective equipment to safety equipment and individual protection at work and fatigue being replaced for tiredness (Timossi et al., 2009).
Opportunity to use and develop human capacities: is an integral part of relevant factors to the development of capabilities, such as: work provides certain autonomy, the use of the worker’s skills, the knowledge about the process, to performance the task and have prior planning (Walton, 1973; Fernandes, 1996). It refers to the representativeness of the task and the importance that is given to it and the autonomy of performing it (Detoni, 2001; Timossi et al., 2009). It is described as autonomy, multiple qualities, information on the total work process and relative self-control (Fernandes, 1996). Then, it was described as autonomy, versatility, performance evaluation, given responsibility and importance of the task (Detoni, 2001). Later, the terms were modified from autonomy to opportunities to make decisions, from importance of the task to importance of work and activity that one exerts, from versatility to opportunity of performing various tasks, performance evaluation to have knowledge of how good or bad is its performance, given responsibility for responsibility of the work given to you (Timossi et al., 2009).
Opportunity to growth and security: it is related to the opportunity for professional growth, as well as security and job stability. The associated aspects are: capacity and knowledge development, ascension opportunity for worker and the possibility to use new knowledge and skills (Walton, 1973; Fernandes, 1996). It indicates the opportunities of the job and its security (Detoni, 2001; Timossi et al., 2009). It was ranked in possibility of career, personal growth, salary advancement prospects and job security (Fernandes, 1996). And later, training, studies encouragement, professional growth and layoffs (Detoni, 2001). Then changed the term training for training and courses the person does (Timossi et al., 2009).
Social integration in the work organisation: it corresponds to aspects of self-esteem and personal relationship, incorporating the sense of community, fellowship, social equality, social mobility, prejudice and information exchange (Walton, 1973; Fernandes, 1996). It is related to acquaintanceship within the organization and equal opportunities (Detoni, 2001; Timossi et al., 2009). It is described as the absence of prejudice, equality, mobility, relationships and sense of community (Fernandes, 1996). And discrimination, appreciation of ideas, interpersonal relationship and team commitment (Detoni, 2001). Then changing the terms from discrimination to (racial, social, religious, sexual etc.) discrimination, from interpersonal relationship to relationship with colleagues and bosses, and commitment of the staff for commitment of its staff and colleagues (Timossi et al., 2009).
Constitution in the work organisation: is the existence of constitutionalism in order to protect workers from abusive actions. The following factors are part of this aspect: privacy, freedom of expression, fairness and equality front the law (Walton, 1973; Fernandes, 1996). The use of standards and guidelines that show the rights and duties within the organization (Detoni, 2001; Timossi et al., 2009). It represents worker protection rights, freedom of expression, labor rights, fair treatment and personal privacy (Fernandes, 1996). And later, worker’s rights, freedom of expression, discussion and regulations and respect to the individuality (Detoni, 2001). So, changing the terms from appreciation of ideas for appreciation of their ideas and initiatives, workers’ rights to respect workers’ rights, freedom of expression for opportunities to give their opinions, discussion and regulations for rules and regulations of their work and respect to individuality for their individual and particular characteristics (Timossi et al., 2009).
Work and total life span: if the work provides a more flexible journey where the employee enjoys more the family life, this will be positively reflected, in the same way that if it occurs the reverse situation, it will suffer negative impacts (Walton, 1973; Fernandes, 1996). It is directly linked to the balance between time devoted to work and personal life (Detoni, 2001; Timossi et al., 2009). It was portrayed as balanced role at work, few geographic changes, time for family leisure and time stability (Fernandes, 1996). Then, described as influence on the family routine, recreation possibility and leisure time and rest (Detoni, 2001). The term influence on the family routine is described as the influence of work on his family life (Timossi et al., 2009).
Social relevance of work life: as the company searches for improvements in what refers to aspects such as social responsibility, the employee tends to increase his self-esteem (Walton, 1973; Fernandes, 1996). Also understood as the perception of the worker regarding the importance of the task that he executes (Detoni, 2001; Timossi et al., 2009). It is exposed as the corporate image, corporate social responsibility, product liability and employment practices (Fernandes, 1996). Then, described as corporate image, pride about work, community integration, quality of products/services and human resources policy (Detoni, 2001). Finally, Timossi et al. (2009) replaced the term pride about work for proud to carry out his work, institutional image for image that this company has in society, community integration for contribution to society and human resource policy as the way the company treats employees.
More recently, Timossi et al. (2009) appreciated the sub-criteria of Detoni (2001) to suggest an assessment scale of QWL based on Walton’s model (1973). These authors, in turn, represent the reproduction of the method suggested by Detoni (2001) in the interrogative form. Corresponding to the responses, it was used a Likert scale of five alternatives, based on the WHOQOL-100 instrument, used by the World Health Organization (WHO), to assess the life quality, facilitating, thus, the understanding and also to get the responses more homogeneous. After the changes made by Detoni (2001) and Timossi et al. (2009), the eight dimensions were the following nomenclature: Adequate and fair compensations, Working conditions, Use of capacities at work, Opportunities at work, Social integration at work, Constitutionalism at work, Occupied space by work in the life and Social relevance and importance of work.
To achieve the objectives of this study, a quantitative approach research was conducted with the administrative employees, technicians and teachers of a higher education institution from Minas Gerais.
In accordance with the dimensions presented in the theoretical framework, it was proposed nine research hypotheses related with the QWL dimension. They are:
The dimensions and hypotheses are based, theoretically, in the dimensions originally proposed by Walton (1973), with the translations and modifications made by Fernandes (1996) and Detoni (2001) and, finally, naming adjustments conducted by Timossi et al. (2009). These hypotheses form the relations with the life quality at work, which were plotted in Figure 1.
To respond to the hypotheses, a field survey was conducted from the adapted version of the survey developed by Timossi et al. (2009). Some adjustments were made in the questionnaire: a) the question IST1 about the dimension of Social Integration at Work was first “In relation to discrimination (social, racial, religious, sexual etc.), how do you feel?” and it was changed to “How do you feel about the respect to the variety of religious beliefs, sexual orientation, race etc. on your workplace?”; because it was considered more appropriate to the satisfaction scale proposed; b) It was added the QWL question through the statement “How do you perceive your quality of life at work?”; it is a direct question about the subject with the objective to put it as the dependent variable in the structural equation model. The questions and their dimensions can be seen in Table 1.
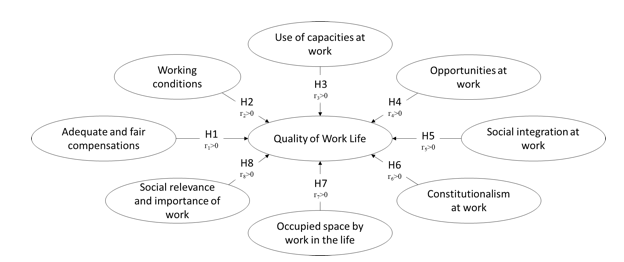
Figure 1. Proposed model for testing the hypotheses
Note. Source: created by the authors.
----
ADEQUATE AND FAIR COMPENSATION |
WORKING CONDITIONS |
CJA1. How satisfied are you with your salary (remuneration)? CJA2. How satisfied are you with your salary, if you compare it with the salary of your colleagues? CJA3. How satisfied are you with the rewards (e.g.: recognition, financial help etc.) you receive from the company? CJA4. How satisfied are you with the extra benefits (e.g.: education help, courses, medical and dental plans etc.) the company offer? |
CT1. How satisfied are you with your weekly working hours (number of worked hours)? CT2. In relation to your workload (amount of work), how do you feel? CT3. Regarding the use of technology in the work you do, how do you feel? CT4. How satisfied are you with the healthiness (e.g.: cleaning, lighting, noise etc.) of your workplace? CT5. How satisfied are you with the safety equipment, individual and collective protection provided by the company? CT6. Regarding the tiredness that your work causes you, how do you feel? |
USE OF CAPACITIES AT WORK |
OPPORTUNITIES AT WORK |
UCT1. Are you satisfied with the autonomy (opportunity to make decisions) that you have at work? UCT2. Are you satisfied with the importance of the task/work/activity you do? UTC3. Regarding versatility (possibility to perform multiple tasks and work) at work, how do you feel? UTC4. How satisfied are you with your performance evaluation and/or received feedbacks (have knowledge of how good or bad is your performance at work)? UTC5. Regarding the given responsibility (job responsibility given to you), how do you feel? |
OT1. How satisfied are you with your professional growth opportunity? OT2. How satisfied are you with the trainings you do? OT3. About the situations and the frequency in which occur layoffs in your work, how do you feel? OT4. Regarding the incentives to study that the company gives to you, how do you feel? |
SOCIAL INTEGRATION AT WORK |
CONSTITUTIONALISM AT WORK |
IST1. How do you feel about the respect to the variety of religious beliefs, sexual orientation, race etc. on your workplace? IST2. Regarding your relationship with colleagues and leaders in your work, how do you feel? IST3. Regarding the commitment of your staff and colleagues with work, how do you feel? IST4. How satisfied are you with the appreciation of your ideas and initiatives at work? |
COT1. How satisfied are you with the company for its respect to workers’ rights? COT2. How satisfied are you with your freedom of expression (opportunity to give your opinions) in your work? COT3. How satisfied are you with the norms and rules of your work? COT4. Regarding to the respect to your individuality (individual and particular characteristics) at work, how do you feel? |
OCCUPIED SPACE BY THE WORK IN LIFE |
SOCIAL RELEVANCE AND IMPORTANCE OF WORK |
EOTV1. How satisfied are you with the influence of work on your family life/routine? EOTV2. How satisfied are you with the influence of work on your possibility of leisure? EOTV3. How satisfied are you with your work and rest schedules? |
RSIT1. Regarding to your pride to do your job, how do you feel? RSIT2. Are you satisfied with the image that this company has to society? RSIT3. How satisfied are you with the community integration (contribution to society) that the company has? TSIT4. How satisfied are you with the services provided and the products quality of the company? TSIT5. How satisfied are you with the human resources policy (the way the company treats employees) that the company uses? |
QUALITY OF WORK LIFE |
|
QWL. How do you perceive your quality of work life? |
|
Table 1. Variables grouped by their dimensions
Notes. Source: Adapted from Walton (1973), Fernandes (1996), Detoni (2001) and Timossi et al. (2009).
All hypotheses were verified through the data obtained from the application of a questionnaire with all the proposed dependent and independent questions. In addition to these questions, control questions were inserted in order to draw a brief profile of respondents: collaborators category (trainee, administrative employee, technical employee, hourly teacher and 20 or 40 hours teacher), working time in the institution, how the employee imagine itself in two years ahead (working in the institution in the same position, in a better position, in another company in the same type of job, in a better job or working on their own) and a comparison of how is the institution now and in the previous year (worse than before, equal to or better than before).
The choice for the research instrument from Timossi et al. (2009) was due to the refinements made based on Detoni (2001) improvements and the rigorous work of translation and adaptation carried out by Fernandes (1996) from the initial proposal of Walton (1973). The used scale was the same proposed by Timossi et al. (2009): a Likert satisfaction scale, varying from very dissatisfied (1) to very satisfied (2).
The investigated population refers to all employees from the higher education institution previously chosen. Totaling 959 employees distributed in 143 trainees (14.9%), 449 employees (46.8%), 232 hourly paid teachers (24.2%) and 135 teachers of 20 or 40 working hours (14.1%). The questionnaire was applied with the support of the personnel management sector from the investigated institution, to 518 employees (~54.01% of the population), in a random way, distributed in 83 trainees (16%), 209 employees (40.3%), 137 hourly paid teachers (26.4%) and 89 teachers of 20 or 40 working hours (17.2%), homogeneously by the sectors of the entire institution. The error margin was estimated at 2.92%, with reliability of 98%.
After defining the questionnaire and the sample, two tests were performed. The first consisted of an evaluation of the questionnaire by experts on the issue, who reviewed the questionnaire and the application form to be undertaken. Then, the questionnaire was applied to 20 subjects of the sample, with five from each group (trainee, administrative staff, hourly paid teachers and teachers of 20 and 40 working hours), in order to evaluate the objectivity and understanding of the questions. It is believed that with these procedures, the instrument and the answers have become reliable.
Afterward, the questionnaires were applied in the period from 20th to 26th April, 2016, through tablet PCs with questions being passed one by one and response requirement. Thus, it was assured the answer for all questions throughout the sample. The tablet PCs were given to employees with verbal guidance on the purpose and importance of the research. There were also instructions in the application software, which provided the research self-conduction by the participants. As the data collection was performed by digital means, there were no mistakes to be corrected and no difficulties in adjusting the database to be investigated.
After collecting data, it was undertaken the analysis, using the structural equation modeling method (SEM) in order to: i) validate the model and ii) respond to the presented hypotheses. For Hair et al. (2014), this method uses multiple factor analysis and regression in order to validate the composition of the measurement model (arrangement between observed variables and latent variables) and validate the structural model (relations between the independent and dependent latent variables), respectively. The SEM technique used was the partial least squares (PLS), by the SmartPLS software, which according to the author, maximizes the explained variance. The technique was chosen because, according to Henseler, Ringleand and Sinkovics (2009), it has the advantage of using a resampling technique with comparisons between the variables observed by t-tests, and does not require normal distribution of data, which is the case of this research.
For validation and analysis of the structural model, we chose the sequence proposed by Bido, Silva and Ringle (2014), replacing the method of Fornell and Larcker (1981) by Henseler, Ringle and Sarstedt (2015) method, due to recent discovery about the inefficiency of the first method. The procedural steps can be seen in Figure 2 and are detailed in the SEM validation section.
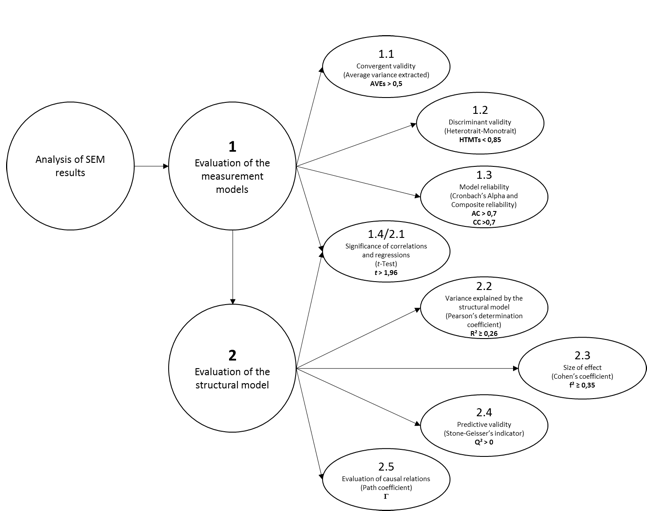
Figure 2. Proposed procedures for validation and analysis of SEM
Note. Source: Adapted from Bido et al. (2014) and Henseler et al. (2015).
The hypotheses were evaluated by the analysis of path coefficients (г) and were accepted with positive coefficient and rejected with negative coefficient.
Regarding the profile, from the 518 respondents who participated in this study, teachers represent the majority (43.6%), followed by permanent employees (40.3%) and trainees (16%). The aim of this study was a medium-sized company in the higher education sector. Results were strategically presented, according to the sections described below.
First, for the model validation, we analyzed the factor loadings of each observed variable (OV) and its latent variable (LV). According to Hair et al. (2014), it should be considered loads equal to or superior than 0.6. However, only OV IST1 obtained index lower than the proposed (0.59), but for its proximity to the reference value and its importance for the model, it was considered. Then, Cronbach’s Alpha of the instrument was evaluated and for Hair, Hult, Ringle and Sarstedt (2014), it should be superior than 0.7. The internal reliability of the instrument was 0.959, satisfying the criterion.
After these assessments, it was analyzed the validation tests of the structural model in the sequence proposed by Bido et al. (2014), with adaptations of discriminant validation proposed by Henseler et al. (2015). Thus, it was conducted the evaluations of the average variance extracted (AVE), the Cronbach Alphas (CA) and composite reliability (CR) of each LV, besides the Pearson’s determination coefficient (R²). The results are shown in Table 2.
When analyzing the AVEs, it is observed that all the values were higher than 0.5, as proposed by Fornell and Larcker (1981). For Henseler et al. (2009), values higher than 0.5 demonstrate that OVs are explaining, in an appropriate manner, each LV.
Latent variables |
AVE |
CA |
CR |
R² |
1. Adequate and fair compensations |
0.665 |
0.830 |
0.886 |
|
2. Working conditions |
0.539 |
0.829 |
0.875 |
|
3. Use of capacities at work |
0.691 |
0.888 |
0.918 |
|
4. Opportunities at work |
0.540 |
0.711 |
0.823 |
|
5. Social integration at work |
0.602 |
0.772 |
0.855 |
|
6. Constitutionalism at work |
0.710 |
0.864 |
0.907 |
|
7. Occupied space by work in life |
0.799 |
0.875 |
0.923 |
|
8. Social relevance and importance in the work |
0.686 |
0.884 |
0.916 |
|
9. QWL |
1.000 |
1.000 |
1.000 |
0.359 |
Reference values >> |
> 0.500 |
> 0.700 |
> 0.700 |
> 0.260 |
Table 2. Initial values of qualification of the structural equation model
Notes. Source: research data (2016).
Acronyms: AVE - average variance extracted; CA – Cronbach’s alpha; CR - composite reliability
Ps.: independent variables do not have R².
After this, Bido et al. (2014) suggest the analysis of the model reliability. Although the authors suggest the CR preferably instead of CA, due to its prioritization of reliabilities of each LV, rather than the number of OVs in each LV, in this study we chose for both analyzes. Hair et al. (2014) suggest values above 0.6 for CAs and 0.7 for CRs. In this case, all values were higher than the standard values, demonstrating internal consistency in the model.
Going forward, the discriminant validity of the model was performed with the use of HTMT technique, proposed by Henseler et al. (2015), which checks the ratio between the average of the correlations between the OVs of a LV with the average of the correlations of the OV of another LV that is being analyzed. In this way, it can be considered discriminants the ratios below 0.85 conservatively and acceptably up to 0.9, according to the authors. As Table 3 shows, all LVs were lower than 0.85, being considered discriminant to other LVs, with the exception of LVs Social integration at work X Constitutionalism at work (0.899), Opportunities at work X Social integration at work (0.878) Use of capacities at work X Social integration at work (0.874) and Use of capacities at work X Opportunities at work (0.874), but that still demonstrate discrimination within the considered limits.
Latent variables |
1 |
2 |
3 |
4 |
5 |
6 |
7 |
8 |
1. Adequate and fair compensations |
||||||||
2. Working conditions |
0.606 |
|||||||
3. Constitutionalism at work |
0.581 |
0.819 |
||||||
4. Occupied space by work in life |
0.460 |
0.815 |
0.679 |
|||||
5. Social integration at work |
0.554 |
0.785 |
0.899 |
0.629 |
||||
6. Opportunities at work |
0.781 |
0.782 |
0.838 |
0.624 |
0.878 |
|||
7. QWL |
0.413 |
0.601 |
0.507 |
0.504 |
0.456 |
0.522 |
||
8. Social relevance and importance of work |
0.591 |
0.749 |
0.804 |
0.651 |
0.731 |
0.817 |
0.391 |
|
9. Use of capacities at work |
0.603 |
0.764 |
0.838 |
0.597 |
0.874 |
0.874 |
0.472 |
0.714 |
Reference value >> |
< 0.85 (conservative) ou < 0.90 (acceptable) |
|||||||
Table 3. Values of discriminant qualification of the structural model
Note. Source: research data (2016).
The next step was the assessment of Pearson’s determination coefficients (R²), to measure the structural model, as Bido et al. (2014). According to Cohen (1998 apud Bido et al., 2014), this coefficient in social and behavioral sciences should be equal to or higher than 26%, and it represents how the LVs, which originate within the system, are being explained by the structural model. Therefore, it is verified that, according to Table 1, the independent LVs account for 35.9% of the latent variable QWL, which represents a higher coefficient than the required by the study area.
Following, it was done the t-test of Student, which is the comparison of the averages of the original values and the generated by the resampling technique, according to Bido et al. (2014), and serve to measure if there is significance (p ≤ 0.05) between the correlations of LVs and their OVs and the regressions of independent LVs with dependent LVs. It is considered the values above 1.96, and consequently, p-values ≤ 0.05. In the structural model about QWL, it was found that the independent LVs social integration at work, opportunities at work and use of capacities at work had higher values than those proposed, as shown in Table 4.
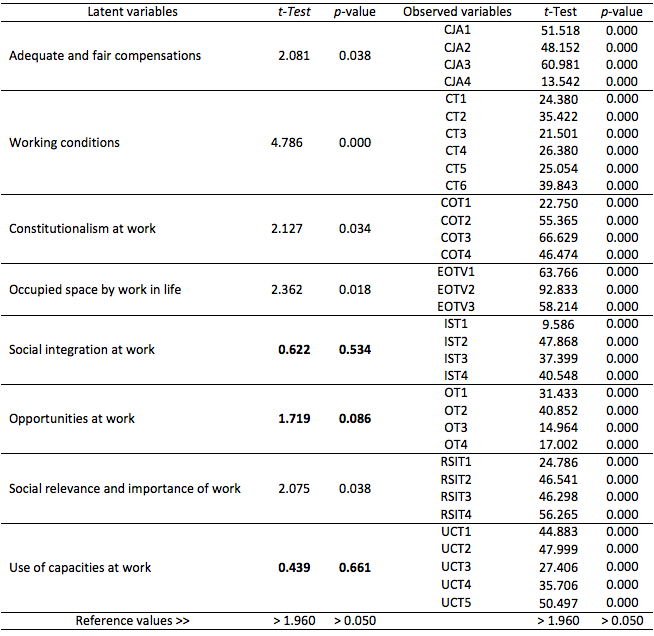
Table 4. Student’s t-Test values and p-values before the exclusion of dimensions.
Notes. Source: research data (2016).
Ps.: bold data represent values below 1.96 in t-Test and above 0.050 p-values.
This way, we followed with the removal of OVs with lower factor loads, CJA4, OT3, CT3, CT5 and OT4, in this order, as an attempt to improve the indicators and keep the dimension Opportunities at work. However, with the removal of the variables, the construct would be with only two variables, not justifying. Then, it was decided for the removal of 4 dimensions to the model adjustment: social integration at work, opportunities at work, social relevance and importance of work and use of capacities at work. After the removal, it is possible to check the adjustment of the model according to Table 5, with t values higher than 1.96.
Latent variables |
t-Test |
p-value |
Observed variables |
t-Test |
p-value |
Adequate and fair compensations |
2.499 |
0.013 |
CJA1 |
49.059 |
0.000 |
CJA2 |
47.040 |
0.000 |
|||
CJA3 |
61.168 |
0.000 |
|||
CJA4 |
12.977 |
0.000 |
|||
Working conditions |
4.954 |
0.000 |
CT1 |
24.014 |
0.000 |
CT2 |
35.214 |
0.000 |
|||
CT3 |
20.558 |
0.000 |
|||
CT4 |
27.058 |
0.000 |
|||
CT5 |
24.752 |
0.000 |
|||
CT6 |
39.346 |
0.000 |
|||
Constitutionalism at work |
2.214 |
0.027 |
COT1 |
22.607 |
0.000 |
COT2 |
53.727 |
0.000 |
|||
COT3 |
65.208 |
0.000 |
|||
COT4 |
46.514 |
0.000 |
|||
Occupied space by work in life |
2.171 |
0.030 |
EOTV1 |
64.545 |
0.000 |
EOTV2 |
90.838 |
0.000 |
|||
EOTV3 |
56.331 |
0.000 |
|||
Reference values >> |
> 1.960 |
> 0.050 |
Reference values >> |
> 1.960 |
> 0.050 |
Table 5. Student t -Test Values and p-values after the removal of dimensions.
Notes. Source: research data (2016).
Ps.: all test results fit in the established standards, after the removal of the dimensions.
After the removal of the LVs, were performed again all the tests of AVE, CA, CR and R², showing thus satisfactory results, including Pearson’s determination coefficient (R²) that had a slight change (34.7%), but remained in the established standards (Table 6).
Latent variables |
AVE |
CA |
CR |
R² |
1. Adequate and fair compensations |
0.665 |
0.830 |
0.886 |
|
2. Working conditions |
0.539 |
0.829 |
0.875 |
|
3. Constitutionalism at work |
0.710 |
0.864 |
0.907 |
|
4. Occupied space by work in life |
0.799 |
0.875 |
0.923 |
|
5. QWL |
1.000 |
1.000 |
1.000 |
0.347 |
Reference values >> |
> 0.500 |
> 0.700 |
> 0.700 |
> 0.260 |
Table 6. Values (AVE, CA, CR and R²) after the removal of 4 dimensions.
Notes. Source: research data (2016).
Acronyms: AVE - average variance extracted (average variance extracted); CA – Cronbach’s Alpha; CR - composite reliability
Ps.: independent variables do not have R².
Again, after the removal of LVs, it was analyzed the suitability index of the structural model, using the HTMT technique proposed by Henseler et al. (2015). All the LVs were considered discriminant between them, as the values proposed by the authors (Table 7).
Finally, according to Bido et al. (2014, p. 69), it was used two indicators representing the quality of adjustment: Stone-Geisser’s indicator or predictive relevance (Q²) and Cohen’s indicator or size of the effect (f²) serving, respectively, to explain how predictive is the adjusted model and represent how much each LV is contributing to the R² of the dependent variable. According to Hair et al. (2014), values close to 1, for Q², indicate that the model predicts close to the OVs, while for f², values above 0.35 are considered as satisfactory.
Latent variables |
1 |
2 |
3 |
4 |
1. Adequate and fair compensations |
||||
2. Working conditions |
0.606 |
|||
3. Constitutionalism at work |
0.581 |
0.819 |
||
4. Occupied space by work in life |
0.460 |
0.815 |
0.679 |
|
5. QWL |
0.413 |
0.601 |
0.507 |
0.504 |
Reference values >> |
< 0.85 (conservative) or < 0.90 (acceptable) |
|||
Table 7. Values of the suitability index of the structural model
Note. Source: research data (2016).
In this study, the explanation model of Quality of Work Life shows that the results are inside the established Q² standards (0.330) and f² values indicate the relevance of each LV for the general adjustment of the model, with only the LV Working conditions presenting a slight variation below the reference value, as shown in Table 8, but still being considered.
Latent variables |
Q² |
f² |
1. Adequate and fair compensations |
|
0.458 |
2. Working conditions |
|
0.327 |
3. Constitutionalism at work |
|
0.514 |
4. Occupied space by work in life |
|
0.571 |
5. QWL |
0.330 |
1.000 |
Reference values >> |
> 0 |
> 0.350 |
Table 8. Values of Predictive validity (Q²) and Size of the effect (f²)
Note. Source: Research data (2016).
Finally, we arrive to the final model for quality of work life, with its respective factor loads (λ), betas of linear regressions (ד) and coefficient of determination (R²), as shown in Figure 3.
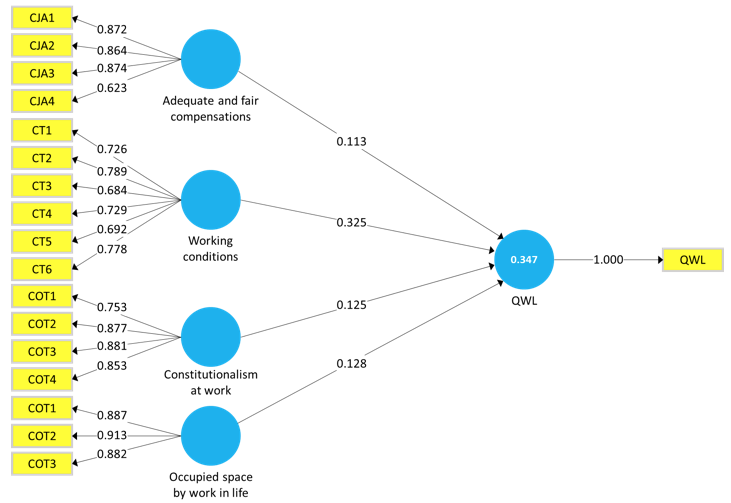
Figure 3. Final adjusted model of Structural Equation.
Note. Source: Research data (2016).
Due to the objective of the study, we sought to investigate whether the dimensions ‘adequate and fair compensations’, ‘working conditions’, ‘use of capacities at work’, ‘opportunities at work’, ‘social integration at work’, ‘constitutionalism at work’, ‘occupied space by work in life’ and ‘social relevance and importance of work’ are positively related with the QWL dimension.
Table 9 briefly shows these relations and test them to check if the study hypotheses are confirmed.
Hypothesis |
Dimensions |
Hypothetical effect |
path ﬢ |
p-value(*) |
Result |
H1 |
Adequate and fair compensations |
Positive |
0.113 |
0.038 |
H1 confirmed |
H2 |
Work conditions |
Positive |
0.325 |
0.000 |
H2 confirmed |
H3 |
Use of capacities at work |
Positive |
- |
- |
H3 rejected |
H4 |
Opportunities at work |
Positive |
- |
- |
H4 rejected |
H5 |
Social integration at work |
Positive |
- |
- |
H5 rejected |
H6 |
Constitutionalism at work |
Positive |
0.125 |
0.036 |
H6 confirmed |
H7 |
Occupied space by work in life |
Positive |
0.128 |
0.038 |
H7 confirmed |
H8 |
Social relevance and importance of work |
Positive |
- |
- |
H8 rejected |
Table 9. Evaluation of the study hypotheses
Notes. Source: Research data (2016).
Ps.: p-values considered significant lower than or equal to 0.05.
As results shown in Table 8, it is observed that the dimensions ‘adequate and fair compensations’, ‘working conditions’, ‘constitutionalism at work’ and ‘occupied space by work in life’ are positively related to QWL, confirming the hypotheses H1, H2, H6 and H7. However, the dimensions ‘use of capacities at work’ and ‘opportunities at work’ did not reach discriminant validity and thus the hypothesis H3, H4, H5 and H8 were rejected.
In short, the results indicate the existence of positive relations between QWL and four of the eight dimensions proposed in the evaluated model (Walton, 1973; Fernandes, 1996; Detoni, 2001; Timossi et al., 2009). In previous research, it was verified the grouping of questions of different constructs in a single factor, suggesting that these are better suited to different constructs to which they belong (Rueda, Ottati, Pinto, Lima, & Bueno, 2013). Moreover, according to Rueda et al. (2013), although it did not occur the validation of the dimensions proposed by Walton (1973), it was possible to relate the results of the study to four of the eight dimensions proposed by the author. It is observed that the dimension ‘working conditions’ has higher relation with QWL (0.325). Thus, it is recommended further study on the subject as a way to understand why the validation of the dimensions did not occur.
According to the objective of this study that is to validate a research tool, we verified that there was a partial validation of the model proposed by Walton (1973), in which only four of the eight dimensions remained after the validation.
This result does not disqualify the model, the research has been done based on the translations in which may occur meaning discrepancies of the model created by Walton (1973), even if unintentional, thus spoiling the research results taken as the source of study. Another important factor to consider is that the questions may not be allocated in the best position regarding the dimensions, as we also believe that the original model represents a study model that was being adapted in order to serve to measure the quality of work life, without validating it.
It is believed that it is not possible to generalize the results, which reject the hypothesis H3, H4, H5 and H8 due to the fact that its realization has been uniquely designed for a business sector. We emphasize the importance of these factors related to motivation, which according to the theoretical framework is directly associated with QWL.
About the limitations, these are relating to the sector it was realized that is different from the proposed by Walton (1973), and because this study was carried out only in one company which results in a representation of this segment only.
It is suggested further research from this study, through which can be increased the research range with more segments, as well as analyze the reason for the rejection of the dimensions in the structural model.
Bido, D., Silva, D. da, & Ringle, C. M. (Maio, 2014). Modelagem de equações estruturais com utilização do SmartPLS. Brazilian Journal of Marketing, 13(2), 56-73.
Chitakornkijsil, P. (Fall, 2010). Broad perspective and framework of quality of work life. International Journal of Organization Innovation, 3(2), 214-242.
David, L., Brazil, K., Krueger, P., Lohfeld, L., & Tjam, E. (2001). Extrinsic and intrinsic determinants of quality of work life. International Journal of Health Care Quality Assurance Incorporating Leadership in Health Services, v. 14(3), pp. ix-xv.
Detoni, D. J. (2001). Estratégias de avaliação da qualidade de vida no trabalho (Dissertação de mestrado). Universidade Federal de Santa Catarina, Florianópolis, PR, Brasil.
Fernandes, E. C. (1996). Qualidade de vida no trabalho: como medir para melhorar. Salvador: Casa da Qualidade.
Fornell, C., & Larcker, D. F. (1981). Evaluating structural equation models with unobservable variables and measurement error. Journal of Marketing Research, 18(1), 39-50.
Hackman, J. R., & Oldham, G. R. (1975). Development of the Job Diagnostic Survey. Journal of Applied Psychology, 60(2), 159-170.
Hair, J. F., Jr., Hult, T. M., Ringle, C. M., & Sarstedt. (2014), M. A primer on partial least squares structural equation modeling (PLS-SEM). Los Angeles: SAGE.
Henseler, J., Ringle, C. M., & Sarstedt, M. A. (2015). New criterion for assessing discriminant validity in variance-based structural equation modeling. Journal of the Academy of Marketing Science, 43(1), 115-135.
Henseler, J., Ringle, C. M., & Sinkovics, R. R. (2009). The use of partial least squares path modeling in international marketing. In R. R. Sinkovics, & P. N. Ghauri (Eds.). New challenges to international marketing (Vol. 20, Chap. 12, pp. 277-319). (Advances in international marketing). [S.l.]: Emerald Group Publishing.
Horn, J. E. van, Taris, T. W., Schaufeli, W. B., & Scheurs, P. J. (September, 2004). The structure of occupational well-being: a study among Dutch teachers. Journal of Occupational and Organizational Psychology, 77(3), 365-375.
Kirby, E.L., & Harter, L.M. (August, 2001). Discourses of diversity and the quality of work life. Management Communication Quarterly, 15(1), 121-127.
Laschinger, H. K. S., Finegan, J., Shamian, J., & Almost, J. (May, 2001). Testing Karasek’s Demands-Control model in restructured healthcare settings: effects of job strain on staff nurses’ quality of work life. Journal of Nursing Administration, 31(5), 233-243.
Lau, R. S. M. (2000). Quality of work life and performance: an ad hoc investigation of two key elements in the service profit chain model. International Journal of Service Industry Management, 11(5), 422-437.
Limongi-França, A. C. (2009). Promoção de saúde e qualidade de vida no trabalho: o desafio da gestão integrada. In A. M. Rossi, J. C. Quick, & P. L. Perrewé (Orgs.). Stress e qualidade de vida no trabalho: o positivo e o negativo (Cap. 13, pp. 256-277). São Paulo: Atlas.
Limongi-França, A. C. (2010). Qualidade de vida no trabalho: conceitos e práticas nas empresas da sociedade pós-industrial (2a ed.). São Paulo: Atlas.
Limongi-França, A. C., & Arellano, E. B. (2002). Qualidade de vida no trabalho. In M. T. L. Fleury (Org.). As pessoas na organização (2a ed., Cap. 19, pp. 295-306). São Paulo: Gente.
Marôco, J., & Marques-Garcia, T. (2006). Qual a fiabilidade do alfa de Cronbach? Questões antigas e soluções modernas? Laboratório de Psicologia, 4(1), 65-90.
Martel, J. P., & Dupuis, G. (June, 2006). Quality of work life: theoretical and methodological problems, and presentation of a new model and measuring instrument. Social Indicators Research, 77(2), 333-368.
Mathieu, J. E., & Zajac, D. C. (September, 1990). A review and meta-analysis of the antecedents, correlates, and consequences of organizational commitment. Psychological Bulletin, 108(2), 171-194.
Meyer, J. P., Stanley, D. J., Herscovitch, L., & Topolnytsky, L. (October, 2002). Affective, continuance and normative commitment to the organization: a meta-analysis of antecedents, correlates and consequences. Journal of Vocational Behavior, 61(1), 20-52.
Nadler, D. A., & Lawler, E. E. (1983). Quality of work life: perspectives and directions. Organizational Dynamics, 11(3), 20-30.
Quirino, T. R., & Xavier, O. S. (janeiro/março, 1987). Qualidade de vida no trabalho de organização de pesquisa. Revista de Administração de Empresa, 22(1), 72-81.
Rodrigues, M. V. C. (2002). Qualidade de vida no trabalho (9a ed.). Petrópolis: Vozes.
Rueda, F. J. M., Ottati, F., Pinto, L. P., Lima, T. H. de, & Bueno, J. M. de P. (2013). Construção e validação de uma escala de avaliação da qualidade de vida no trabalho. Avaliação Psicológica, 12(1), 43-50.
Siqueira, M. M. M., & Gomide, S., Jr. (2004). Vínculos do indivíduo com o trabalho e com a organização. In J. C. Zanelli, J. E. Borges-Andrade, & A. V. B. Bastos (Orgs.). Psicologia, organizações e trabalho no Brasil (Cap. 9, pp. 300-330). Porto Alegre: Artmed.
Sirgy, J. M., Efraty, D, Siegel, P., & Lee, D. (September, 2001). A new measure of quality of work life (QWL) based on need satisfaction and spillover theories. Social Indicators Research, 55(3), 241-302.
Shirrmeister, R., & Limongi-França, A. C. (Setembro/Dezembro, 2012). A qualidade de vida no trabalho: relações com o comprometimento organizacional nas equipes multicontratuais. Psicologia: Organizações e Trabalho, 12(3), pp. 283-298.
Timossi, L. da L., Pedroso, B., Pilatti, L. A., & Francisco, A. C. de. (2009). Adaptação do modelo de Walton para avaliação da qualidade de vida no trabalho. Journal of Physical Education, 20(3), 395-405.
Tulasi, Das V., & Vijayalakshmi, C. (November, 2013). Quality of work life: a strategy for good industrial relations. Advances in Management, 6(11), 8-15.
Walton, R. E. (1973). Quality of work life: what is it? Sloan Management Review, 15(1), 11-21.
Walton, R. E. (1975). Criteria for quality of work life. In L. E. Davis, & A. B. Cherns (Eds.). Quality of working life: problems, projects and the state of the art (Vol. 1, Chap. 5, pp. 91-104). New York: The Free Press, Collier-Macmillan.
Werther, W., & Davis, K. (1983). Administração de pessoal e recursos humanos: a qualidade de vida no trabalho. São Paulo: McGraw-Hill do Brasil.
Westley, W. A. (February, 1979). Problems and solutions in the quality of working life. Human Relations, 32(2), 11-123.
Worrall, L., & Cooper, C. (2012). Quality of working life 2012: managers’ wellbeing, motivation and productivity. London: Chartered Management Institute.
Yates, C., Lewchuk, W., & Stewart, P. (November, 2001). Empowerment as a Trojan horse: new systems of work organization in the North American automobile industry. Economic and Industrial Democracy, London, 22(4), 517-541.
1. Email: renato@unipam.edu.br