![]() ISSN 0798 1015
ISSN 0798 1015

![]() ISSN 0798 1015
ISSN 0798 1015
Vol. 38 (Nº 13) Año 2017. Pág. 2
Eduardo DE-CARLI 1; Andréa Paula SEGATTO 2; Geciane Silveira PORTO 3; José Roberto FREGA 4; Fernanda Salvador ALVES 5
Recibido: 20/09/16 • Aprobado: 20/10/2016
5. Final comments and recommendations
ABSTRACT: This paper demonstrates the technological development of Universities and Public Research Institutes, called Scientific and Technologic Institutions (STIs), through the patent deposits from 2004 to 2013. The theoretical aspects handled involve the joint and individual technological development resulting in patents. The methodology is ruled by a quantitative approach (exploratory – descriptive) from the collection of secondary data of Thomson Innovation, analysed with frequencies and chi-squared test. Three hypotheses related to partnership, technological area and geographical region were tested and one of them was rejected. |
RESUMO: Este documento demonstra o desenvolvimento tecnológico das universidades e institutos públicos de pesquisa, chamado científico e tecnológico das instituições (IST), através do patentes depósitos de 2004 para 2013. Os aspectos teóricos tratados envolvem o desenvolvimento tecnológico conjunto e individual, resultando em patentes. A metodologia é governada por um quantitativo abordagem (exploratório-descritivo) da coleção de dados secundários de inovação de Thomson, analisados com frequências e teste qui-quadrado. Três hipóteses relacionadas à parceria, região geográfica e área tecnológica foram testados e um deles foi rejeitado. |

The advance of society happens through planning, organization and monitoring of some areas. This way, attention, in order to have effective development of activities that lead the country to technological innovation, is fundamental for organizational productivity and competitiveness (Tigre, 2006), since they are the motor for national development.
In order to do that, it is needed some strategic planning actions of technologic research and capacity, besides basic scientific technologic research, formation and improvement of human resources, incentive to companies that invest in research, creation of technology, according to article 218, and development of technological autonomy in the country, according to article 219, both in Constitution of the Federative Republic of Brazil from 1988 (BRASIL, 1988).
Such actions provide a basis for activities that result in knowledge production and technologic innovation, for an intensive use of information and knowledge, which are crucial factors for internal growth and competitiveness among companies, as Sábato and Botana (1968), Segatto (1996), Segatto-Mendes and Rocha (2005), Etzkowitz and Leydesdorff (1996), Plonski, (1999), Porto (2007), Tigre (2006) say. The State must provide social well being, for the private sector, in which the country’s resources are generated, and for Scientific and Technologic Institutions (STIs) where knowledge is developed.
According to Innovation Law (10.973/2004) (BRASIL, 2004), article 2, item V, the concept of STI is “agency or entity of public administration whose institutional mission, among others, is to perform basic or applied research activities of a scientific or technological nature”. The knowledge built in these institutions and with the possibility of generating returns from it occurs with patents production because universities ‘translate’ the results of their work into knowledge that can be privately appropriated, and into commercial technologies (Henderson, Jaffe & Trajtenberg, 1998).
Albuquerque (1996) and Póvoa (2008) state that, for the practice of innovations, it is required the interaction between different agents of a National Innovation System (NIS), a group of institutions that are related to each other and contribute for creation, development and diffusion of technological innovations. Plonski (2005) and Stal (2006) declare that National Innovation System is a net of public and private institutions whose activities and interactions happen for developing the use of technology. This way, its concept, according to Organization For Economic Co-Operation and Development (OECD, 1997), is in the connections between actors involved for a better technological performance.
So, in order to have an effective National Innovation System in the country, it is needed profitability of “Triple Helix” cooperation relations (Etzkowitz & Leydesdorff, 1996), which means, between universities, companies and government, in a way that there is constant development of knowledge, that each party do its job, plays the other’s role (Etzkowitz & Leydesdorff, 1996; Plonski, 1999; Stal & Fujino, 2005) and there is evolution of national technologic development. Such development, according to Albuquerque (1996) and Póvoa (2008), depends on the interaction between parties that take part on the system, chiefly among academic and industrial sectors. It enables researches performed at STIs to help with economic development in the country. As stated by Cecere, Corrocher, Gossart and Ozman (2014), the company uses academic knowledge to develop innovations, which is something that, and according to Gusberti et al. (2014), increases the potential of partners’ commercial application on technologies.
One of the relations suggested for technological development, in line with Sábato and Botana (1968), Segatto (1996), Etzkowitz and Leydesdorff (1996), Plonski (1999), Porto (2000), Segatto-Mendes and Rocha (2005), is in the process of cooperation between Scientific and Technologic Institutions (STIs) and Companies.
Studies on cooperation between Scientific and Technologic Institutions and Companies have been developed by several authors as Bonaccorsi and Piccaluga (1994), Segatto (1996), Marcovich, (1999), Plonski (1999), Segatto-Mendes (2001), Dagnino (2003), Stal and Fujino (2005), Porto (2007), Rapini (2007), Costa, Porto and Feldhaus, (2010), Dalmarco et al. (2011), Dias and Garnica (2013), Lind; Sthyre and Aaboen (2013), Ferreira Júnior and Segatto (2011). On the whole, they emphasize this kind of cooperation because they increase national and organizational growth. Garcez and Sbragia (2013) point out that, through STIs-C cooperation, new competences and skills are built.
In Brazil, public policies, ruled by articles 218 and 219 from Federal Constitution (BRASIL, 1988), come from initiatives that result in STIs-C relations, through laws like the Innovation Law (10.973/2004) (BRASIL, 2004), with incentives to innovation, to scientific and technological research in a productive environment, to technologic development by reducing the distance among government, companies and Scientific and Technologic Institutions.
The public policies recently adopted focus on the development of Science and Technology (S&T) and technological capacitation in Brazil. When efforts on Research and Development (R&D) are emphasized, it can be observed, in practice, some scientific publications, patent registration and per capta Gross Domestic Product growth(Dalmarco et al., 2011; Stal, 2006), among others. Atun, Harvey and Wild (2007) demonstrate the value of intellectual property in creating economic growth.
The use of patents may produce economic benefits, since they are a temporary title of property for protecting inventions from being used for commercial exploration of the technology developed. This way, its analysis allows the identification of technologic capacity in companies, regions, countries. They provide the description of techniques for spreading an invention (Severi, 2013; WIPO, 2014b) and the ways of making a product/performing a service (Abrantes, 2011), and its organization occurs by means of classifying codes inside a technological area (Cecere et al., 2014).
Each country has a specific institute for granting patents. In Brazil, it is the National Institute for Industrial Property (INPI) the body in charge, which is ruled by Industrial Property Law (Brasil LPI - 9.279/1996) (BRASIL, 1996).
The following study focus on deposits of patents made by Brazilian Scientific and Technologic Institutions (STIs) on Thomson Innovationbase because, as emphasized by Stal (2006), Póvoa (2008), Dalmarco et al. (2011), the patents are one of the ways of characterizing innovative technological development, in a country. Seen in these terms, characterization and analysis of patent deposit production (2004-2013) made by Brazilian STIs allow an exploration per geographic region of origin of the STI and technologic area, per general number and also partnerships between institutions; for relations between the existence of partnership among institutions.
After describing some important aspects about to have an effective development of activities that lead the country to technological innovation, the goal of analysing the theoretical background was to better understand some aspects about it, like joint technology development and patents.
Through strategic alliances (SA), partnerships and cooperation, there is development of competences of parties that work together to evolve their activities (Fleury & Fleury, 2004; Penrose, 2006), primarily, due to information sharing and/or know how (Garcez & Sbragia, 2013; Lind et al., 2013).
The strategic alliance is “an agreement between two or more partners to share knowledge or resources, which could be beneficial to all parties involved” (Vyas, Shelburn & Rogers, 1995, p. 47). With the union between two or more parties, it is possible that knowledge and resources are used effectively, because competences are created for that (Penrose, 1959).
As stated by Vaidya (2011), there are benefits to the company from the economy on transaction costs to dependence on resources and less uncertainties. According to Tidd, Bessant and Pavitt (2008), there are technological and market entry costs reduction, less risk and time spent on development and commercialization of products, scale economies can be reached and promotion of learning shared.
INDICEIn the relation Scientific and Technologic Institutions – Company (STI-C), an alliance comes from research efforts among public and private sectors for technological and academic development, through a more competitive industrial sector, academic researches with more quality, more technological innovations and strengthening the economy for the country (Etzkowitz & Leydesdorff, 1996; Sábato & Botana, 1968; Segatto, 1996; Segatto-Mendes & Rocha, 2005; Tigre, 2006).
INDICEAt universities, the cooperation binding is founded on supporting long-term researches, helping with new useful knowledge, broadening educational experience, rising topics for dissertations and jobs, interacting with scientists and industrial engineers (Segatto, 1996). Bonaccorsi e Piccaluga (1994) say that, for universities, company financing for researches is a benefit; Lind, Sthyre and Aaboen (2013) state that universities may acquire knowledge from partnership, since they can improve even more, by adding what they have searched to what they have learned.
INDICEFor companies, there is a motivation in finding universities as sources of ideas, knowledge and technology. Moreover, they can share costs, be close to scientists and connect researches to the company’s needs (Segatto, 1996) as well as being a creator of qualified labor which is able to act in strategic activities (Plonski, 1999). Bonaccorsi and Piccaluga (1994) say that, for companies, there is fast access to technologic scientific knowledge, unique research competences and cost reduction. Lind, Sthyre and Aaboen (2013) emphasize that companies inside universities have access to information that they do not have or that might be better them theirs.
INDICEManaging partnerships is fundamental so that they can contribute to technological competiveness in the company, as well as its renovation, according to Costa, Porto and Feldhaus (2010). Also, Zeng, Xie and Tam (2010) say that cooperation between enterprises and research institutions is important and positive, even though it is said that the former is more fruitful than the latter for developed countries and that, for the developing ones, the cooperation between research institutions and universities for small and medium-sized enterprises’ innovation tends to get better results.
This sharing among institutions comes from Sabato’s Triangle, through multiple and integrated action between government, productive structure and scientific-technological infrastructure. And from that there is the National Innovation System (NIS), that is, the triple union binding for technology development (Albuquerque, 1996; Plonski, 2005; Stal, 2006). Guaranteeing information flow in this system is a task for the universities (Stal & Fujino, 2005), they have to pass generated knowledge to companies and society.
With the interaction between Scientific and Technologic Institutions (STIs), company and government, by measuring productivity, the number of patents appears as a quantitative indicator, among others, to verify the productivity of researches made in partnership (Segatto, 1996; Segatto-Mendes & Sbragia, 2002). This means that the development of ability for constantly generating knowledge and, with it, technologic and scientific innovation is in the relation between the three poles.
Atun et al. (2007) affirm that “Patents and IP rights have been created as a society recognises the need to foster innovation and to reward the innovator”. These aspects are important because, for these authors, patents are a most commonly used measures of innovation and the key to the inventor protect rights about their creation.
According to WIPO (2014a), the Patent is a document which ensures that the producer has the right to decide on the exploration of their invention, having knowledge disclosed in return. In the patent, there is the representation of ‘technologic frontier’ of the produced technology since more accurate knowledge is there (Merola, Ayres & Antunes, 2008).
USP Agency of Innovation (2014) points out that “patent is a temporary title of property on an investigation or utility model, granted by the State to the inventors or other individuals/companies holding rights on the creation, which guarantees their exclusivity on the economical use of it”. Knowledge protection, according to Merola et al. (2008), is needed due to the possibility of a future commercialization. It is from the decision of patenting an invention that there is the possibility of generating income (Danguy, Rassenfosse & Potterie, 2013).
From the types of patents provided for in article 2, first item, of Brazilian Industrial Property Law – LPI (9.279/1996) (BRASIL, 1996), which represents the country’s technologic development, in this study, we emphasize two: 1) invention (making something new) and 2) utility models (an improvement of a product or an existing process). “A patent for an invention is granted by government to the inventor” (Atun et al., 2007, p. 281).
In order to obtain a patent, an invention must comply with three requirements: industrial application, novelty, that is, inventive activity (something never seen before or improved) and descriptive sufficiency (for invention patents – as a ‘manual for instructions’) (INPI, 2012; Severi, 2013).
A patent is granted after technical examination of merits, if the goal of the patent meets the requirements of patentability. Even before this examination, the application is published. There is an 18-month period of secrecy, although the publishing might be anticipated at the request of the applicant (Article 30 of the Industrial Property Law - LPI - 9.279/1996) (BRASIL, 1996). When the patent application is published, its content (regardless its patentability) becomes part of status of technique, that is, of what is so far publicly known.
The patent is a document whose representation of knowledge is in its most public form. It is noteworthy the knowledge produced, technology generated, possibilities of coverage of its commercial exploration. That is why constant ways of knowledge development must be guided by legal principles that guarantee inventors the possibility of future benefits and that it may be an incentive to carry innovations forward.
This study is quantitative, since it aims at organizing, characterizing and interpreting numerical data. Its execution happened by means of secondary data verification. They were obtained through Reuters Thomson Innovation patent database. To analyze the data, we used descriptive statist and document analysis of the patents from the base register, which comprehended 160 Scientific and Technologic Institutions (STIs) presents in the Formicit Report (MCTI, 2013, 2015).
Regarding the STIs, in this study, federal universities and state higher education institutions listed in the Formicit report from the Ministry of Science, Technology and Innovation (MCTI, 2013, 2015) were all grouped as universities. As for the Federal institutes of Education, Science and Technology and the public research institutes were grouped as Public Research Institutes (PRI).
The statistic analysis is performed to aim at showing differences between patent deposits done in partnership or not, through regression analysis and Chi-square test. In order to test the hypothesis proposed in the study, based on the theoretical background above presented, we used the Chi-square test because it makes possible to “determine significance of differences between two independent groups” (Siegel & Castellan Jr., 2006, p. 134). Because it is a non-parametric test, it enables data (values observed) to be analyzed and frequency (expected values) to be estimated.
In this study, the following hypothesis were tested. The first hypothesis stems from the view that, with the interaction between university, enterprises and government, we have to measure the productivity the number of patents as a quantitative indicator, among others, to verify the productivity of partnership research (Segatto, 1996). This occurs, according Póvoa (2008), because the putting into practice of innovations depends on the interaction between different agents of SNI and second Tigre (2006), may be related to regional development aspects of the country. When two parties interact, ie, share skills to create new skills (Fleury & Fleury, 2004; Penrose, 1959), it share resources, it may will produce more knowledge and also that more patents are filed because the parties now complement, generating mutual benefits.
These features make it possible to infer that there is differentiation between deposits and no partnership agreement with the country. Therefore, it has been hypothesized: H1: there is no association between geographic region and the existence of partnership regarding the total of patents deposited.
The second hypothesis comes from the perspective of regional Brazilian differences in technological areas focused on patent production. This proposition is guided in claims that technological development reflects choices and public policy objectives and social options, on the grounds that "the relationship between science and technology has an interactive character that also includes economic, political and technological environment of each country or region " (Tigre, 2006, p. 77). Thus, according to Rosenberg (2006, p. 42), "the effects of increased productivity superior technologies depend on its use in the appropriate places". This occur, according to Andersen (1998), for the technological development is cumulative and, when there are directions for this to occur, there are trends underlying the development of technologies. Tigre (2006, p. 57) points out that the "concentration of qualified human resources, physical infrastructure and productive capacity in a given region can contribute to significantly increase the collective efficiency of the individual companies". Thus, the behavior of companies by technologies are characterized with respect to time, place, economic sector and technological field, which implies economic changes is that guide daily actions, in addition to indicators of change (ANDERSEN, 1998). Rosenberg (2006, p. 218) states that "the technology is itself a body of knowledge about certain classes of events and activities," i.e., form of knowledge generated over time.
Based on these aspects, it is possible to assume that certain Brazilian regions have different technological characteristics. Therefore, it has been hypothesized: H2: there is no association between the technological area and geographic region regarding concentration of patent deposits.
The third hypothesis stems from the view that, as pointed out by Vaidya (2011), the formation of strategic alliances is the basis for a company generate benefits from transaction cost savings with the choice of alternatives for its development, resource dependence other organizations and the scope of reducing uncertainty. This is because a company always seeks conditions to grow and, therefore, according to Penrose (2006, p. 71) seeks "to organize the use of their 'own' resources with the acquired outside the company for the production and sale of goods and services with profit". So even with internal restrictions, is the competence of employees, the structure seeks to achieve market opportunities by combining internal with the external skills.
This may be a result of government initiatives to technological development, since there may be greater incentives for certain areas, as well as the largest injection of funds by companies for certain areas to be developed by Scientific and Technologic Institutions (STIs). So while there are alliances for the development of technology areas, provides to the companies and universities developing the more they are similar and most tend to provide benefits to both. Thus, the occurrence of partnership in the patent provides the sharing of information and/or know-how (Garcez & Sbragia, 2013; Lind et al., 2013) for the development of some technological areas. Therefore, it has been hypothesized: H3: there is association between technological area and the presence of partnership regarding the total of patent deposits.
Based on these indications, the next section presents the characterization of patent deposits of Brazilian STIs by showing the number of deposits, the amount by universities, public research institutes, and the technologic areas focused on.
Data collection form Thomson Innovation base allowed us to obtain information related to Brazilian Scientific and Technologic Institutions (STIs) patent deposits, from 2004 to 2013 (Graphic 1 ). The data were indentified considering their application date, through which we could notice there were 2985 patent deposits, in total. The patents deposits were grouped as “Inpadoc Family ID”, that is, patents published in different places and/or years, counted one single time to avoid double-counting.
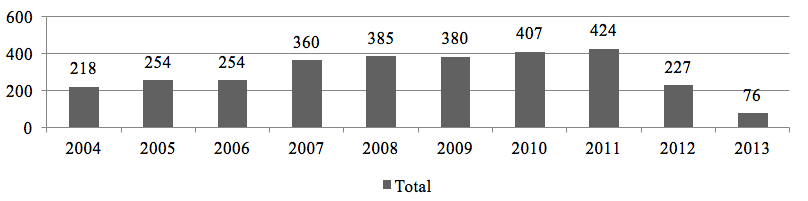
Graphic 1 : Brazilian Scientific and Technologic Institutions (STIs) patents deposits from 2004 to 2013.
Source: Own elaboration based on Thomson Innovation Database.
It is possible to note that, between 2004 and 2011, there is a numerical evolution in the deposits of patent families, and it maintains a constant tendency of growth until 2011. One can see that, during the years 2007 and 2010, there is an increase of Brazilian Scientific and Technologic Institutions (STIs) patent deposits data.
It is an important fact the decrease of deposits in 2012 and 2013. It might have happened due to the minimum period of 18-month secrecy for publishing the patent application, according to Reuters, a company that provides Thomson Innovation [8]. This minimum period would hinder its disclosure, what could have had consequences on the reduction of deposit numbers. Amadei and Torkomian (2009, p. 13) state that there are delays “between the deposits made at INPI and their release in the base, mainly the patents deposited under PCT”, which is something that could complement the reason for the decrease.
Except for the last two years (2012 and 2013), due to what was mentioned before, there is (Graphic 2 ):
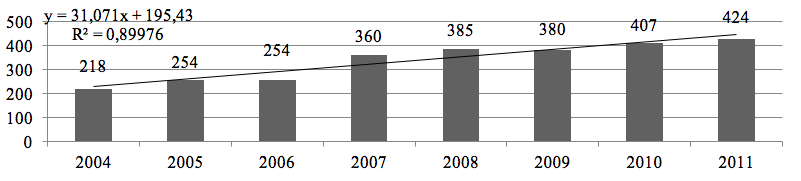
Graphic 2 : Brazilian Scientific and Technologic Institutions (STIs) patents deposits from 2004 to 2011.
Source: Own elaboration based on Thomson Innovation database.
The F statistic of regression presented p-value less than 0,001. It shows that the gradient, that is, the one applied to x (years with production), is significantly different from zero. In other words, if we do not consider the last two years (2012 and 2013), there are evidences that patents production grow throughout the years.
The analysis of data from 2004 to 2011 shows a tendency of growth both in number of patent deposits with partnership and patents deposited with sole proprietorship (Graphic 3 ):
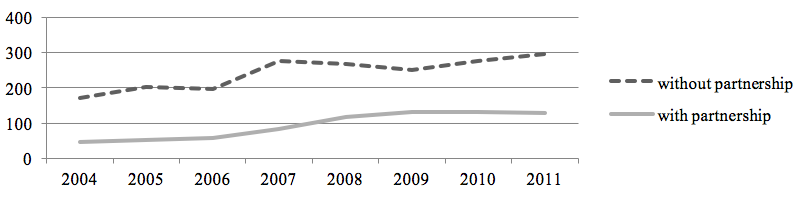
Graphic 3 : Brazilian STIs Patent Deposits with Sole Proprietorship and with partnership from 2004 – 2011.
Source: Own elaboration based on Thomson Innovation database.
It can be seen a sharp oscillation regarding amount of patent deposits without partnership, and it tends to growing development. There is indication of stability in growth rate of patents with shared proprietorship which represent development in partnership.
The analysis of percentage participation of total patent deposits, with and without partnership, makes it possible to observe that, even with growth in both, when there is no partnership, the percentage participation tends to decrease (Graphic 4 ).
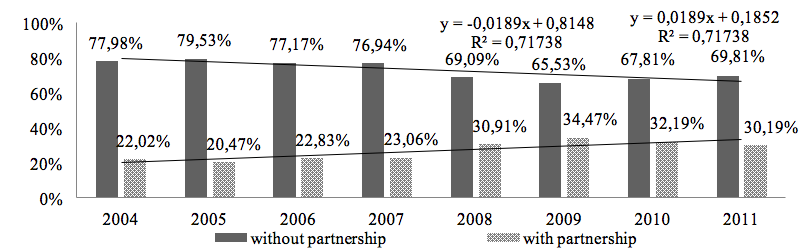
Graphic 4 : Percentage of Brazilian STIs’ Individual Patent Deposit and in Partnership from 2004 a 2011.
Source: Own elaboration based on Thomson Innovation database.
In Graphic 4 , due to the trend line, we can observe a decrease in the amount of patents without partnership and an increase in the ones sharing proprietorship. This indicates that there increasingly is joint technological development through Brazilian Scientific and Technologic Institutions (STIs), what widens the possibility of fruitfully developing knowledge.
Through the statistic analysis of patent deposits without partnership, it can be noticed that the F statistic of regression presented p-value less than 0,00796. It shows that the gradient, that is, the one applied to x (years with production), is significantly different from zero. In other words, if we do not consider the last two years (2012 and 2013), there are evidences that patent deposit without partnership decreases throughout the years.
On the other hand, among the ones with partnership, it can be seen that the F statistic of regression presented p-value less than 0,00796. It shows that the gradient, that is, the one applied to x (years with production), is significantly different from zero. In other words, if we do not consider the last two years (2012 and 2013), there are evidences that patent deposit with partnership increases throughout the years.
Some kinds of partners were found in the data collection, as shown in Chart 1:
1º Titular |
Universities |
Research Institutes |
Enterprise |
Funding Institutions |
Total |
44 Institutes |
205 |
72 |
196 |
67 |
540 |
113 Universities |
722 |
253 |
975 |
456 |
2406 |
Total |
927 |
325 |
1171 |
523 |
2946 |
Chart 1: Types of Partners of Public Institutes and Universities.
Source: Own elaboration based on Thomson Innovation database.
Chart 1 shows the amount of times in which a university, institute, company or funding institution appears as partner of a university or research institute. The goal was to identify the most frequent Scientific and Technologic Institutions (STIs) partners, considering the two aforementioned groups: universities and Public Research Institutes. Statistically, it can be seen that there is significance in Chi-square test, that is, p-value equal to 0,00001. In consequence, some differences in the profiles of universities and public institutes’ partners were spotted.
Graphic 5 shows the percentage distribution of partners found as patent co-holders of universities or public research institutions.
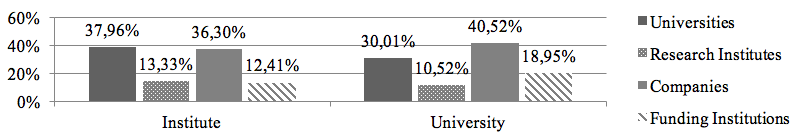
Graphic 5 : Proportion of types of Public Institutions and Universities’ partners.
Source: Own elaboration based on Thomson Innovation database.
The distribution observed in Graphic 5 shows that 40,52% of universities’ partners in patents deposits are companies, 30,01% are other universities, 18,95% are funding institutions and 10,52% are research institutes. Regarding research institutes, 37,96% of their partners are universities, 36,30% are companies, 13,33% are institutes and 12,41% are funding institutions.
It can be noticed that universities are more likely to approach market due to a high number of partnerships with companies, what would enable more applications of knowledge developed and deposited through patents. The research institutes, in turn, prefer universities and companies as partners, which indicate they search for competences and/or resources so that they can develop their abilities.
Some types of partnerships were identified in patent deposits. Also, it could be observed that the most frequent partnerships happen between universities and funding institutions, 28,52% (245), followed by partnerships between universities and companies, 25,03% (215) of total deposits (859). These two correspond to a little more than 53% of all partnerships found in the deposits collected.
From these information it is possible to see that the partnership deposits happen more often, 79,16%; in second place we have the ones with three partners, 17,69%, followed by the ones with four partners, 2,44%. The deposits with five or six partners respectively correspond to 0,58% and 0,12%.
A university combines teaching and research in several areas (PÓVOA, 2008), aiming at knowledge enhancement. A result from that may be noticed by development and deposit of patents.
Some kinds of partners were found in the data collection, as shown in Graphic 6 :
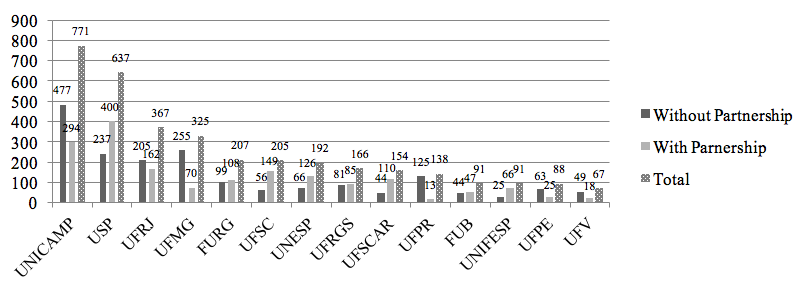
Graphic 6 : Brazilian Universities that most deposited patents from 2004 a 2013.
Source: Own elaboration based on Thomson Innovation database.
Note: Patent deposits of more than one university as proprietor were counted as one for each.
This survey indicates some aspects regarding technological development: the university that most deposits patents, is University of Campinas (UNICAMP), with 771. From these, 61,87% are made without partnership and 38,13% with partnership. In second place, there is University of São Paulo (USP), with 637. From these, 37,21% are made without partnership and 62,79% with partnership. This shows that USP has a bigger relationship with partners for developing technological innovation and, consequently, with the market. It tends to a better easiness for the process of licensing and, therefore, their application in products and processes for the market.
The other universities, for instance act almost the same as the first two in the ranking. For instance Federal University of Rio de Janeiro (UFRJ), Federal University of Minas Gerais (UFMG), Federal University of Paraná (UFPR), Federal University of Pernambuco (UFPE) present not-shared patents’ proprietorship with more frequency and, thus, less incidence of partnership. In turn, Federal University of Rio Grande (FURG), Federal University of Santa Catarina (UFSC), São Paulo State University (UNESP), Federal University of Rio Grande do Sul (UFRGS), Federal University of São Carlos (UFSCAR), Brasília University Foundation (FUB), Federal University of São Paulo (UNIFESP) and Federal University of Viçosa (UFV) present a bigger proportion of partnership approach.
The main Public Research Institutes that deposit patents are about 94,55% of the total. It can be noticed a concentration on IP protection in three of them: Oswaldo Cruz Foundation (FIOCRUZ), Brazilian Agricultural Research Corporation (EMBRAPA), National Nuclear Energy Commission (CNEN), with 68,26% of the total (Graphic 7 ):
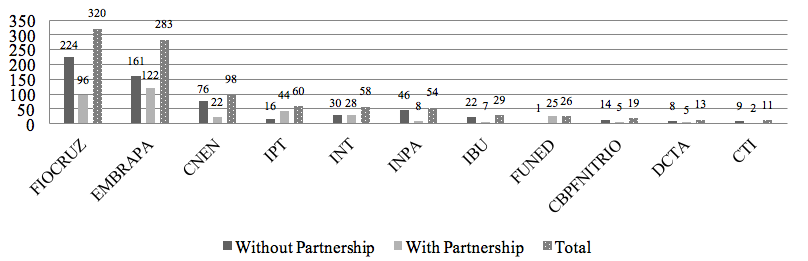
Graphic 7 : Main public research institutes that deposit most patents from 2004 a 2013.
Source: Own elaboration based on Thomson Innovation database.
Note: Patent deposits of more than one institute as proprietor were counted as one for each.
FIOCRUZ, the major applicant, presents 30% of deposits with partnership and 70% without it. EMBRAPA, in turn, has 43,11% of their patents with partnership and 56,89% without. CNEN, National Institute of Technology (INT), Renato Archer Technology Information Center (CTI), Butantan Institute (IBU), Brazilian Center Of Physical Research (NIT-RIO CBPFNITRIO), Science and Technology Department of Aerospace (DCTA) and National Institute for Amazonian Research (INPA) act almost FIOCRUZ, that is, mostly without partnerships. Institute for Technological Research (IPT) and Ezequiel Dias Foundation (FUNED) are different from the others because the deposits with partnership are more prevalent (96,15%).
The Scientific and Technologic Institutions (STIs) patent deposits analyzed show concentration in few of them. Moreover, it demonstrates an incipient process of partnership creation. This way, we can notice that the major concentration of deposits is made without partnerships.
A survey on the regional origins of patent deposits through the applicant institution origin makes it possible to observe the Scientific and Technologic Institutions (STIs) distribution. It results in the gathering of regional information (Graphic 8):
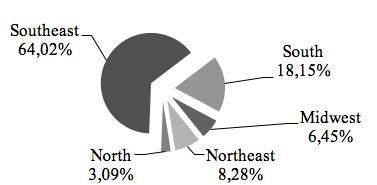
Graphic 8 : Distribution of STIs patent deposits per region in Brazil from 2004 a 2013.
Source: Own elaboration based on Thomson Innovation database.
Note: Among partnerships between STIs from different regions, we counted one for each. When it is intra-regional, we counted two.
We could notice some regional differences regarding Brazilian Scientific and Technologic Institutions (STIs) origins. Most of the institutions are from the Southeast of Brazil, with 64,02% of deposits, followed by institutions from the South, 18,15%. Institutions from the Northeast, Center-West and North respectively represent 8,28%, 6,45% , 3,09%.
Some aspects that might be related to this technological production, according to Dalmarco et al. (2011), occur due to the concentration of resources as researchers and number of STIs in the region and, as reported by Tigre (2006), due to qualification, financial resources and the environment where they are. In this way, what follows is a more detailed analysis of the aspects regarding STIs’ regional concentration, number of researchers and/or Doctors who take part in the regional process at universities and public research institutes.
Amadei and Torkomian (2009, p. 15) propose the use of regional differentiation of patent activity through relation between patenting and number of local researchers and/or Doctors. On this regard, Table 1 shows the relation between researchers and Doctors, calculated by an average of the reporting period, and the patent deposits obtained by region from 2004 to 2013, indicating the amount of these resources annually acting in each region, through which there are production and deposit of each patent during the period.
Table 1 : Relation researches, Doctors and deposits of patents per region.
Region |
Average number of local researches |
Average number of doctors* |
Patent Deposits ** |
Average number of local researches / Deposits |
Average number of doctors / Deposits |
Midwest |
8.271 |
5.188 |
200 |
41,36 |
25,94 |
Northeast |
18.627 |
10.936 |
257 |
72,48 |
42,55 |
North |
5.772 |
2.694 |
96 |
60,13 |
28,06 |
Southeast |
50.193 |
36.822 |
1986 |
25,27 |
18,54 |
South |
24.104 |
14.118 |
563 |
42,81 |
25,08 |
Sources: *CNPq - National Research counsil (2014); ** Own elaboration based on Thomson Innovation database.
From this relation, and considering the number of researchers per deposit, the Northeast region it the one which presents the lowest levels of productivity, because for every patent deposit made in the region, they needed 72,48 researchers. As for the proportion of Doctors per deposit, Northeast region presented the worst result, with 42,55. Southeast region, on the contrary, has the best results, both regarding researchers and Doctors per patent, that is, 25,27 and 18,57 respectively.
Also, the origins of regional distribution of patent deposits can be characterized by the presence or absence of partnerships for deposits made according to the region in the country (Graphic 9).
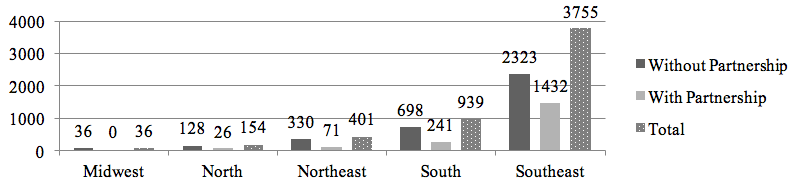
Graphic 9 : STI's Patent deposits considering their original regions 2004 a 2013.
Source: Own elaboration based on Thomson Innovation database.
Note: Patents with partnership between STIs were counted as one for each.
The region of origin that most makes deposits is the Southeast, with 66,83% of total, in which the state of São Paulo in the main on, with 54,75%, followed by Rio de Janeiro (27,86%), Minas Gerais (17,09%) and Espírito Santo (0,30%).
The patent deposits made without partnership in this region correspond to 35,66% of total. São Paulo is the most productive state (47,54%), followed by Rio de Janeiro (33,32%), Minas Gerais (18,69%) and Espírito Santo (0,46%). The protected innovations per patent with partnership, in turn, are concentrated in São Paulo (63,01%) followed by Rio de Janeiro (21,61%), Minas Gerais (15,27%), and Espírito Santo (0,12%).
The second region with more deposits is South of Brazil (18,38%). The state presenting higher percentage of deposits is Paraná (51,79%), followed by Rio Grande do Sul (37,46%) and Santa Catarina (10,75%). With partnership, the South is responsible for 8,16% of total deposits. From these, 46,64% were originated in STIs from Rio Grande do Sul, 34,53% in Santa Catarina and 18,83% in Paraná.
In Center-West, Northeast and North, the deposits originated represent, respectively, 6,08%, 5,97% and 2,75% of total deposits. The ones made without partnership correspond to 3,62%, 4,37% and 1,79% and the ones with partnership 2,45%, 1,59% and 0,95% of total deposits, respectively.
The analysis of technological areas found in patents deposited by Brazilian Scientific and Technologic Institutions (STIs) enables identification of highlighted areas (Graphic 10). In this part of the study we show the highlighted ones, that is, those with more concentration of deposits. The classification used was WIPO’s (2014e) IPC – International Patent Classification, from 2015/1.
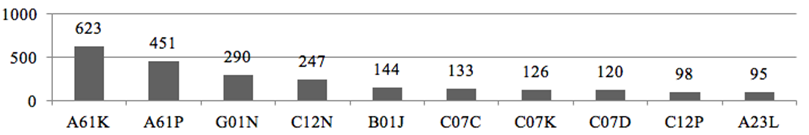
Graphic 10: Technological areas highlighted in deposited patents.
Source: Own elaboration based on Thomson Innovation database.
Note: A patent may have more than one technological area.
Technological areas presented in Graphic 10 represent around 41% of deposits made by Scientific and Technologic Institutions (STIs) (these areas are the ones with more concentration in the deposits, the ones that most repeat). Such areas stand out because there is concentration in area ‘A61K’ (10,99%) of total collected. Such area, human needs, by means of drugs and other biologic compositions, aims at discussing “abnormal or pathological conditions of the living body” (WIPO, 2014e) .
‘A61P’ (7,96%) also is related to production of medicines or chemical compounds (drugs) for therapeutic activity. WIPO (2014e ) emphasizes that when the goal of the invention is for therapeutic purposes, classification occurs both in areas ‘A61K’ and ‘A61P’.
The area ‘G01N’ (5,12%) analyzes materials to determine their physical or chemical properties in order to develop antibodies (WIPO, 2014e) . The fourth area emphasized is the ‘C12N’ (4,36%), Chemistry, whose materials use microorganisms to ward off plagues and/or preserve them and their medium culture (WIPO, 2014e) .
The fifth technological area is ‘B01J’ (2,54%), which is related to chemical section or physical processes for specific applications. It presents specifications about analysis of property changing of materials (WIPO, 2014e) .
All other areas emphasized are ‘C07C’ (2,35%), Chemistry, about acyclic and carbocyclic compounds; ‘C07K’ (2,22%), organic chemistry for peptides (amino acid molecules) production; ‘C07D’ (2,12%), same section, but related to heterocyclic compounds; ‘C12P’ (1,73%), chemistry, for use of fermentation to synthesize a desired chemical compound; ‘A23L’ (1,68%) which attributes features regarding conservation of food products and non-alcoholic beverages.
With this survey, it was found that areas with higher production of patents made by Brazilian STIs are directly related to ways of maintenance and/or conservation of elements regarding benefits to life, mainly by developing elements capable of repairing abnormalities like diseases with medicines/drugs etc., as well as for food products.
The first hypothesis refers to the association between geographical region and the existence of partnerships in total patents. It is so because this study proposes and shows regional differences regarding the amount of deposits. Considering the aforementioned, for H1, the cases analyzed by the tests consist of verifying the difference between the total of patent deposits per geographical region with or without partnership.
Thus, it was tested the null hypothesis H1 – there is no association between geographical region and the existence of partnerships regarding in total patents. Table 2 shows the result of the test of this hypothesis:
Table 2: Hypothesis 1 – Observed Values (2004 – 2013) versus Expected Values
Observed values X Expected values |
|||
W/P |
P |
Total |
|
Midwest |
0,234 |
0,542 |
0,776 |
Northeast |
5,870 |
13,605 |
19,476 |
North |
1,191 |
2,760 |
3,950 |
Southeast |
3,988 |
9,243 |
13,231 |
South |
3,808 |
8,825 |
12,633 |
Total |
50,065 |
||
Source: Own elaboration based on Thomson Innovation database.
Note: W/P – Without Partnership; P – With Partnership.
The Chi-square value found is 50,066, higher than the one presented in the table of critical values. With number of degrees of freedom equal to 4, the Chi-square value is “9,488” (Siegel & Castellan Jr., 2006, p. 359), therefore, the hypothesis H1 is rejected. Consequently, it is evident that there is association between geographical region and the existence of partnership.
The second hypothesis refers to the association between technological area and geographical region where the institution is from. Considering the aforementioned, for H2, the cases analyzed by the tests consist of verifying the difference between the total patent deposits per technological area regarding concentration per geographical region. The hypothesis H2 proposed is that – there is no association between technological area regarding patents concentration. Table 3 shows the result of the test of this hypothesis:
Table 3: Hypothesis 2 - Observed values (2004 – 2013) versus Expected values
Observed values X Expected values |
||||||
Area |
Midwest |
Northeast |
North |
Southeast |
South |
Total |
A61K |
1,624 |
0,303 |
3,698 |
0,015 |
0,002 |
5,643 |
A61P |
2,046 |
4,286 |
0,390 |
0,005 |
0,591 |
7,319 |
G01N |
0,001 |
0,141 |
3,065 |
0,335 |
0,834 |
4,377 |
C12N |
23,709 |
11,075 |
2,218 |
0,003 |
0,0003 |
37,005 |
B01J |
1,300 |
0,966 |
0,45 |
0,134 |
7,766 |
10,617 |
64,961 |
||||||
Source: Own elaboration based on Thomson Innovation database.
The Chi-square value found is “64,961”, higher than the one presented in the table of critical values. With number of degrees of freedom equal to 16, the Chi-square value is “25,296” (Siegel & Castellan Jr., 2006, p. 359), therefore, the null hypothesis H2 is rejected. Thus, it is evident that there are differences between the total patent deposits per technological area regarding concentration per geographical region.
The third hypothesis refers to the association between technological area and existence of partnership regarding total deposits. For H3, the cases analyzed by the tests consist of verifying the difference between the total patent deposits per technological area with or without partnership (Table 4). The null hypothesis H3 proposed is that – there is no association between technological area and the presence of partnership regarding total patent deposits.
Table 4: Hypothesis 3 – Values Observed X Expected
Observed values X Expected values |
|||
Area |
W/P |
P |
Total |
A61K |
0,172 |
0,307 |
0,479 |
G01N |
0,066 |
0,117 |
0,183 |
C12N |
0,083 |
0,149 |
0,232 |
B01J |
0,566 |
1,019 |
1,580 |
C07C |
0,028 |
0,050 |
0,078 |
Total |
2,554 |
||
Source: Own elaboration based on Thomson Innovation database.
Note: W/P – Without Partnership; P – With Partnership.
The Chi-square value found is 2,554, lower than the one presented in the table of critical values. With number of degrees of freedom equal to 4, the Chi-square value is “9,488” (Siegel & Castellan Jr., 2006, p. 359), therefore, the null hypothesis H3 can’t be rejected. Thus, it is evident that there are no differences between the total patent deposits per type of technological area with or without partnership.
This study aimed at characterizing and analyzing the production of patent deposits made by Brazilian STIs. We tried to show competences of such institutions’ technological development, like the technological areas they developed, how the production of patent deposits both with and without partnerships is, besides searching for evidences of regional similarities and differences.
The importance of technological development for the country’s evolution is something that demands, among other things, the creation of competences so that improvements are generated. They may occur through cooperation processes, like the ones that happen between STIs and their partners. Thus, these partnerships might be pointed as source for developing technology.
The patents often become a reflex of it, being a quantitative indicator, besides a possible source of resources for both. The partnerships made by universities and institutes are closer to companies. This relationship with companies may be a sign that there are efforts on developing technological innovation that might be sold and, thus, generate returns for both parties.
Another factor is the universities’ patent deposits. UNICAM and USP are the universities that most patent deposits. Also, in the regional distribution of patent deposits of public research institutes, there are three of them, FIOCRUZ, EMBRAPA and CNEN, which make 68,26% of the deposits. It results in a concentration of patent deposits in the areas they work.
Regarding regional distribution, considering the applicant institution’s region of origin, Center-West presents 6,45%, North 3,09%, Northeast 8,28%, Southeast 64,02% and South 18,15% of patent deposits, what reinforces that scientific-technological development in the country is concentrated in Southeast and South Brazil.
Some research limitations need to be observed: when considering ‘patent deposits’, there are possibilities of grouping applications even if the patent hasn’t been or will be granted. That is because, as the technical analysis for obtaining a patent might take several years, there is possibility that the application is not accepted, that the applicant gives it up, that it is blocked on the absence of annuity payment, among others.
Other factor considered conditioning is the possibility of losing some information when searching on Thomson Innovation database, because it may happen that the data are not registered uniformly, some information is missing, even with the attempt of collection of all patents deposited by STIs considered in this study.
Also, as Thomson Innovation database is recurrently updated, it might be possible that applications originated between 2012 and 2013 were not available yet. Although the database is update every week, what is secrecy is not there. This implies that, in case a similar research is made again, there might be difference regarding amount of deposits and results of a possible analysis according to when it is done. However, although there is limitation, it can be understood that it does not damage this research, because it is still possible to evaluate STIs technological production.
This research aimed at contributing to the existing knowledge in the area by means of survey and analysis of data mentioned. Its results allowed us to identify concentration per areas of deposits and geographical distributions, as well as to obtain more information about patents deposited individually and/or in partnership by Brazilian STIs, what emphasized the growing role technological cooperation has been gaining from patents development in Brazil. It is expected that the characterization we got from the production of patents deposited by Brazilian STIs, in the period studied, has contributed to improving knowledge and propositions for developing future studies.
Thanks to São Paulo Research Foundation – FAPESP for project financing "Technologies Identification Promising: an Application to the Green Technologies" process number 2012 / 22686-9, through which it was possible to access searched the database and hence the development of this work.
Abrantes, A. C. S. de. (2011). Introdução ao Sistema de Patentes: aspectos técnicos, institucionais e econômicos. Rio de Janeiro: Lumen Juris.
Albuquerque, E. D. M. E. (1996). Sistema nacional de inovação no Brasil: uma análise introdutória a partir de dados disponíveis sobre a ciência e a tecnologia. Revista de Economia Política, 16(3), 56–72.
Amadei, J. R. P., & Torkomian, A. L. V. (2009). As patentes nas universidades: análise dos depósitos das universidades públicas paulistas. Ciência Da Informação, 38(2), 9–18. Retrieved from http://revista.ibict.br/ciinf/index.php/ciinf/article/view/1054/1319
Andersen, B. (1998). The evolution of technological trajectories 1890-1990. Structural Change and Ecnonomic Dynamics, 9, 5–34. Retrieved from http://www.sciencedirect.com/science/article/pii/S0954349X97000362
Atun, R. a., Harvey, I., & Wild, J. (2007). Innovation, Patents and Economic Growth. International Journal of Innovation Management, 11(02), 279–297. http://doi.org/10.1142/S1363919607001758
Bonaccorsi, A., & Piccaluga, A. (1994). A theoretical framework for the evoluation of university – industry relationships. R&D Management, 24(3), 229–241.
BRASIL. Constituição da República Federativa do Brasil de 1988 (1988). Brasil. Retrieved from http://www.planalto.gov.br/ccivil_03/constituicao/constituicao.htm
BRASIL. Lei de Propriedade Industrial (1996). Brasil. Retrieved from http://www.planalto.gov.br/ccivil_03/leis/l9279.htm
BRASIL. Lei de Inovação (2004). Brasil. Retrieved from http://www.planalto.gov.br/ccivil_03/_ato2004-2006/2004/lei/l10.973.htm
Cecere, G., Corrocher, N., Gossart, C., & Ozman, M. (2014). Technological pervasiveness and variety of innovators in Green ICT: A patent-based analysis. Research Policy, 43(10), 1827–1839. http://doi.org/10.1016/j.respol.2014.06.004
CNPq. (2014). Indicadores de Pesquisa. Retrieved December 23, 2014, from http://www.cnpq.br/web/guest/indicadores1
Costa, P. R. da, Porto, G. S., & Feldhaus, D. (2010). Gestão da cooperação empresa-universidade: o caso de uma multinacional brasileira. RAC, 14(1), 100–121. Retrieved from http://www.scielo.br/pdf/rac/v14n1/07.pdf
Dagnino, R. (2003). A Relação Universidade-Empresa no Brasil e o “Argumento da Hélice-Tripla”. Revista Brasileira de Inovação, 2(2), 267–307.
Dalmarco, G., Dewes, M. D. F., Zawislak, P. A., & Padula, A. D. (2011). Universities ’ Intellectual Property : Path for Innovation or Patent Competition ? Journal of Technology Management & Innovation, 6(3), 159–170.
Danguy, J., Rassenfosse, G. de, & Potterie, B. van P. de la. (2013). On the origins of the worldwide surge in patenting: an industry perspective on the R&D–patent relationship. Industrial and Corporate Change, 1–38. http://doi.org/10.1093/icc/dtt042
Dias, A. A., & Garnica, L. A. (2013). O processo de Transferência de Tecnologia. In G. S. PORTO (Ed.), Gestão da inovação e empreendedorismo. São Paulo: Elsevier.
Etzkowitz, H., & Leydesdorff, L. (1996). Emergence of a Triple Helix of university–industry–government relations. Science and Public Policy, 23, 7.
Ferreira Júnior, I., & Segatto, A. P. (2011). Alianças estratégicas colaborativas e o ambiente institucional-regulatório em empresas de biotecnologia - segmento saúde humana na região sul do Brasil. Gestão & Produção, 20(3), 727–739. http://doi.org/10.1590/S0104-530X2013000300016
Fleury, M. T. L., & Fleury, A. C. C. (2004). Alinhando estratégia e competências. RAE, 44(1), 44–57.
Garcez, M. P., & Sbragia, R. (2013). The Selection of Partners in Technological Alliances Projects. J. Technol. Manag. Innov, 8(Special Issue ALTEC). Retrieved from http://www.jotmi.org/index.php/GT/article/view/1119
Gusberti, T. D. H., Dorneles, C., Dewes, M. de F., & Cunha, L. S. (2014). Monitoramento da Multidisciplinariedade no Processo de Transferência de Tecnologia em uma Universidade: Proposta de uma Análise de Cluster. Revista de Administração E Inovação - RAI, 11(3), 309–322. http://doi.org/1809-2039
Henderson, R., Jaffe, A. B., & Trajtenberg, M. (1998). Universities as a source of commercial technology: a detailed analysis os university patenting - 1965-1988. The Review of Economics and Statistcs, 80(1), 119–127. Retrieved from http://www.jstor.org/stable/2646734
INPI. (2012). Conheça o INPI. Retrieved March 17, 2014, from http://www.inpi.gov.br/portal/artigo/conheca_o_inpi
Lind, F., Sthyre, A., & Aaboen, L. (2013). Exploring university-industry collaboration in research centres. European Journal of Innovation Management, 16(1), 70–91. Retrieved from www.emeraldinsight.com/1460-1060.htm
Marcovich, J. (1999). A cooperação da Universidade Moderna com o Setor Empresarial. Revista de Administração, 34(4), 13–17.
MCTI. (2013). Política de Propriedade Intelectual das Instituições Científicas e Tecnológicas do Brasil: Relatório Formicit 2012. Brasília. Retrieved from http://www.mcti.gov.br/formict/
MCTI. (2015). Política de Propriedade Intelectual das Instituições Científicas e Tecnológicas do Brasil: Relatorio Formicit 2014. Brasília. Retrieved from http://www.mct.gov.br/upd_blob/0237/237597.pdf
Merola, F., Ayres, N. A., & Antunes, A. M. S. (2008). A exploração econômica da patente e a percepção da proteção pela universidade. In A. M. . Antunes & J. L. Magalhães (Eds.), Patenteamento & Prospecção Tecnológica no Setor Farmacêutico. Rio de Janeiro: Interciência.
OECD. (1997). National Innovation Systems. Retrieved from http://www.oecd.org/science/inno/2101733.pdf
Penrose, E. (1959). The theory of the growth of the firm. New York: Oxford University Press.
Penrose, E. (2006). A Teoria do Crescimento da Firma. Campinas: Editora da Unicamp.
Plonski, G. A. (1999). Cooperação universidade–empresa: um desafio gerencial complexo. Revista de Administração, 34(4), 5–12.
Plonski, G. A. (2005). Bases para um movimento pela inovação tecnológica no brasil. São Paulo Em Perspectiva, 19(1), 25–33.
Porto, G. S. (2000). A decisão empresarial de desenvolvimento tecnológico por meio da cooperação empresa-universidade. Universidade de São Paulo.
Porto, G. S. (2007). A decisão de cooperação universidade empresa sob a otica dos lideres dos grupos de pesquisa do CNPq da USP. Faculdade de Economia, Administração e Contabilidade de Ribeirão Preto (FEA/RP-USP).
Póvoa, L. M. C. (2008). Patentes de universidades e institutos públicos de pesquisa e a transferência de tecnologia para empresas no Brasil. Universidade Federal de Minas Gerais - UFMG. Retrieved from http://www.bibliotecadigital.ufmg.br/dspace/handle/1843/AMSA-7FBNZ5
Rapini, M. S. (2007). Interação Universidade-Empresa no Brasil : Evidências do Diretório dos Grupos de Pesquisa do CNPq. Estudos Econômicos, 37(1), 211–233.
Rosenberg, N. (2006). Por dentro da caixa preta: tecnologia e economia. Campinas: Editora da Unicamp.
Sábato, J., & Botana, N. (1968). La ciencia y la tecnología en el desarrollo futuro de América Latina. Revista de La Integración, n. 3.
Segatto, A. P. (1996). Análise do processo de cooperação tecnológica Universidade – Empresa: um estudo exploratório. Universidade de São Paulo - USP.
Segatto-Mendes, A. P. (2001). Teoria de Agência Aplicada à Análise de Relações entre os Participantes dos Processos de Cooperação Tecnológica Universidade - Empresa. Universidade de São Paulo - USP.
Segatto-Mendes, A. P., & Rocha, K. C. (2005). Contribuições da teoria de agência ao estudo dos processos de cooperação tecnológica universidade-empresa. Revista de Administração Da USP - RAUSP, 40(2).
Segatto-Mendes, A. P., & Sbragia, R. (2002). O processo de cooperação universidade-empresa em universidades brasileiras. Revista de Administração, 37(4), 58–71.
Severi, F. (2013). Introdução à Propriedade Intelectual. In G. S. Porto (Ed.), Gestão da inovação e empreendedorismo. São Paulo: Elsevier.
Siegel, S., & Castellan Jr., N. J. (2006). Estatística Não-Paramétrica para Ciências do Comportamento (2nd ed.). Porto Alegre: Artmed Editora.
Stal, E. (2006). Inovação: como vencer esse desafio empresarial. São Paulo: Clio Editora.
Stal, E., & Fujino, A. (2005). As relações universidade-empresa no Brasil sob a ótica da lei de inovação. Cadernos de Pós-Graduação - Administração, 4(1), 269–283.
Tidd, J., Bessant, J., & Pavitt, K. (2008). Gestão da inovação. Porto Alegre: Bookman.
Tigre, P. B. (2006). Gestão da Inovação: a economia da tecnologia no Brasil (5th ed.). Rio de Janeiro: Elsevier.
Vaidya, S. (2011). Understanding Strategic Alliances: an Integrated Framework. Journal of Management Policy and Practice., 12(6), 90 – 100.
Vyas, N. M., Shelburn, W. L., & Rogers, D. C. (1995). An analysis of strategic alliances: forms, functions and framework. Journal of Business & Industrial Marketing, 10, 47 – 60.
WIPO. (2014a). International Patent Classification. Retrieved December 26, 2014, from http://www.wipo.int/classifications/ipc/en/
WIPO. (2014b). World Intellectual Property Organization. Retrieved September 24, 2014, from http://www.wipo.int/patents/en/
WIPO. (2014c). World Intellectual Property Organization. Retrieved December 18, 2014, from http://images.webofknowledge.com/WOKRS5132R4.2/help/pt_BR/DII/hs_wipo_country_coverage.html
Zeng, S. X., Xie, X. M., & Tam, C. M. (2010). Relationship between cooperation networks and innovation performance of SMEs. Technovation, 30(3), 181–194. http://doi.org/10.1016/j.technovation.2009.08.003
1. Doctorate Student at Federal University of Parana (UFPR). Email: eduardodecarli@ufpr.br
2. Professor at Administration Graduate Program and Administration Pos-Graduate Program at Federal University of Parana (UFPR). Email: aps@ufpr.br
3. Professor at Administration Pos-Graduate Program at São Paulo University (USP). Email: geciane@usp.br
4. Professor at Administration Graduate Program and Administration Pos-Graduate Program at Federal University of Parana (UFPR). Email: jose.frega@gmail.com
5. Professor at Administration Graduate Program at Federal University of Parana (UFPR). Email: fsa@ufpr.br
6. Universities and Research Institutes are considered Scientific and Technologic Institutions (STIs).
7. Thomson Innovation is a base of Thomson Reuters which has as data basis 47 organs from several countries, being INPI the Brazilian one (WIPO, 2014e).
8. Reuters gave this information by e-mail when asked about the decrease in deposits made by Brazilian Scientific and Technologic Institutions (STIs) in 2012 and 2013.