![]() ISSN 0798 1015
ISSN 0798 1015

![]() ISSN 0798 1015
ISSN 0798 1015
Vol. 38 (Nº 13) Año 2017. Pág. 1
Luis Eduardo RAMÍREZ Polo 1; Fred De Jesús MEDOZA Mola 2; Alexander PARODY 3; Fernando GONZALEZ Solano 4; Lauren J. CASTRO Bolaño 5; Miguel Angel JIMENEZ Barros 6
Recibido: 23/09/16 • Aprobado: 29/10/2016
ABSTRACT: Public transit systems are designed to reduce traffic and time on the way people travel. In many stations it is probably to find high agglomeration of passengers, specially awaiting main routes. It is necessary to find the optimal slack in the buses schedule that minimize passengers expected waiting time or number of waiting passengers. This paper shows the analysis in a bus rapid transit station in Barranquilla-Colombia where different scenarios were analyzed, evaluated which would be the best configuration for inter-arrival times of buses and find the optimal slack in non-rush hour in the main station. |
RESUMEN: Los sistemas de transporte público están diseñados para reducir tráfico y tiempo en viajes. En muchas estaciones es probable encontrar alta aglomeración de pasajeros, especialmente esperando rutas principales. Es necesario encontrar la holgura óptima en el horario de los buses que minimicen el tiempo de espera de los usuarios, o el número de usuarios esperando. Este artículo muestra el análisis en una estación de transferencia rápida en Barranquilla-Colombia donde se analizaron diferentes escenarios, se evaluó cual sería la mejor configuración para los tiempos de espera de los buses y encontrar la holgura óptima en horas valle en la estación principal. |

The planning and scheduling of public transportation covers a very wide research area and is one of the main topics in operations research and simulation being distribution some of the key functions in logistics systems (Montoya-Torres, López Franco, Nieto Isaza, Felizzola Jiménez, & Herazo-Padilla, 2015). Researchs of networks design, scheduling of vehicles to obtain the optimal slack time, the process of generating a public transportation system have been approached. (Amézquita Díaz , Reyes López , & Ochoa Villa , 2010) Currently the bus rapid transit systems (BRT) are implemented in many principals cities around the world (more than 70 cities) and 156 no principals cities have introduced BRT elements into their transit network (Data, 2015), each system implemented has been working with different characteristics like infrastructure, costs, operations, speed, capacity and level of integration depending the conditions of the city where is working. (Hidalgo & Herrman, 2004) (Hidalgo & Carrigan, 2010). In Latin America, BRT have been implemented in Brazil, Ecuador, Peru, Mexico and Colombia in main cities like Curitiba, Quito, Guayaquil, Lima, Ciudad de Mexico, Guadalajara, Bogotá, Calí, Medellín, Barranquilla and others, where they are considered one of the best solution for urban mobility (Wright, 2002) (Mosquera Becerra, et al., 2013) giving solutions to traffic congestion, and TransMilenio in Bogotá is the centerpiece of a long-term urban mobility (Cain, 2007). The same situation was happening with Quito and Curitiba being world pioneers of BRT (Rodriguez, Vergel-Tovar, & Camargo, 2016).
The information from the cities mentioned before, was gathered from passengers who arrived at stops randomly, their waiting time depend on how many people are there and how often is the traffic at that time (Osuna & Newell, 1972). Due to the flexibility and the low costs, bus transit systems are most attractive to meeting the growing transportation requirements (Zhao, Jiamin; Sathis, Bukkapatnam; Dessouky, Maged M, 2003). For a common passenger, move in Bus is more economical and flexible that any another transportation system. Despite its great importance to the community, often the same system for its operation and often share space with the common traffic, waiting for generating pasegeros and uncertainty, these systems are considered unreliable (Zhao, J; Sun, X, 2015). The main idea of making an appropriate schedule of the buses is a program that can reduce the dispertion of wait time of passengers significantly (Zhao, Bukkapatnam, & Dessouky, 2003), This hypothesis have been supported by different studies measuring time as buses under normal conditions handled on a single line. (headways of 10 minutes or less), the objective of this study is to find a time ensure consistency between the arrival time of the buses and the number of customers who are waiting for them. (Zhao, J; Dessouky, M; Bukkapatnam, S, 2006).
The way the bus progresses along the different stops where it picks up passengers is not considered necessarily constant as well as the free capacity that should be on every bus stop, if a bus is delayed more than usual in any arrival, collect more passengers than expected, leaving the next Bus with fewer passengers to pick up. (Salzborn, 1980) Proposed a mathematical model with primary objective minimize the number of buses and a secondary criterion was the minimization of the passenger waiting time. (Park, 2005) Applied genetic algorithms and simulation in optimizing bus schedules in an urban transit network. Based on the mode of arrival of buses, a simple Genetic algorithm combined with problem with specific operators was used to determine optimized headways in a case where buses arrive following a deterministic process. (Wirasinghe, Hurdle, & Newell, 1977).
Determined optimal transit service characteristics try to minimize the sum of the transit operating costs and passenger time costs for a coordinated rail and bus transit system (Jarzab, Ligthtbody, & Maedea, 2002). The logistics integration aims to facilitate the solution of real problems in vehicle fleet and personnel flow, which integrates intelligently process information, the proposed mathematical model and finally the optimization techniques or set that these issues can be resolved flow of personnel. The success of this tool will depend on the successful integration of all the information attached to the process, must be real and not atypical (Villalobos, 2008). Today in Colombia there are automatic route systems to support the forecast of the personnel flow as it moves within a mass transportation system which greatly benefits to the flow of passengers such as published by (Rodriguez, Benito, & Ruiz, 2013), however this software like any other has limitations as the absence of digital maps with high reliability, real-time information updates and the margin of error in atypical events such as bad weather usually have a lag in the process simulation. An assisted routing software system or an assistant run under the assumption of reaching an optimal solution in this case try to establish the amount of ideal routes and schedules according to the influx of personnel present (Rodriguez, Benito, & Ruiz, 2013).
The software features a great advantage and rapid communication interface in different points of the system, each one feeding back information and making decisions without the intervention of a human. The system algorithms run to obtain a logical point to bring the software to have the ability to process and transform data into decisions. These types of tools have restrictions or conditions which prevents a loop in its iteration for decision making, which is why the cost and the goal of reaching a saddle point in a minimization gives a delimitation within the area of potential we could reach the tool shed (Villalobos, 2008). Today the routes support systems are widely used in developed cities. However, in Latin America and other developing countries have not yet invested enough resources to research and develop of these algorithms and desicion support systems, which prevents the correct flow and high influx of input and output of personnel in the terminals.
Barranquilla is the fourth most populated city in Colombia after Bogotá, Medellin and Cali. Founded in 1637, has a population of 1,897,989 inhabitants in its metropolitan area it is considered a city of national growth and the Caribbean for his strategic location on the Caribbean Sea and next to the Magdalena river that flow through Colombia from the center to the north (DANE, 2015). In 2004 the government of Colombia approved the project for mass transit in the city of Barranquilla with a coverage of 36% of the areas in the city, whose passengers are rising in the last quarter of 2015 reaching a number of 8.6 million passengers transported, equivalent to 11.5% of all users of the city. In addition, it was increasing the use of massive transit systems compared to traditional systems in the last 3 years.
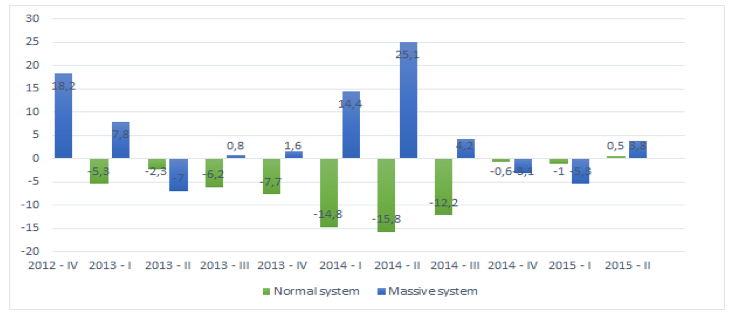
Figure 1: Annual percentage of passengers last 3 years in Barranquilla (DANE, 2015)
The objective of this paper is to show the design of schedules and strategies of the programming of the buses that travel through the main routes in the massive transport in the city of Barranquilla, using a simulation model to improve planning process inside the bus station at non rush hours in order to improve the flow of passengers that makes transshipment and taking the principal route. First, we present the current configuration of the massive transport system by collecting data and showing the current situation; as a second step we present the the simulation model built that represent the passenger flows through the bus station with the current data collected to represent the real situation and finally show the improvement scenarios supported by statistical tools in the programming of routes looking for improve cost and service of the buses.
The cost finding the optimal software developed for a specific function will always be expensive but at the same time for this type of system it costs are not greater than the benefit that could be generated. In many companies, if this condition is known then they would accept the use of software which help not only find a good methodology but also reduce the cost of the problem that the software improves within the company (Larragaña, 2003). To represent a system through a mathematical or simulation model, we must have the correct equation and variables and each dependent variable must be properly related to each of the independent variables to lead a coherent logical order to make the algorithm and solve iterations. To develop the model, different types of variables were considered to determine the actual behavior of the system and proceed to collect the distributions and values of each parameters associated. In this particular case, to represent the main terminal of bus rapid transit the typical conditions of the week at non-peak times where buses have a normal inter-arrival time of 10 minutes. The purpose of collect this information was to establish the behavior of real value of passenger traffic and achieve the determination of the rate of input and output data sharing within the main station, which will supply the simulation. In this case, the classical behavior is analyzed at non- rush hour in the main station, focusing only on the behavior of the main routes.
More than 10,000 data was collected in normal conditions of the system. Trying to measure time between arrivals, queue sizes and waiting time of the passengers there is two main provenances of the passengers:
Once collected this information from direct source, it was checked and analyzed through a statistical analysis using chi square models to find the distributions that best fit the reality was happening at the station
The design of the simulation model was conceived to include all vehicles leaving from the main station and pick up passengers waiting in the queue from entering by walk to the station or entering by another route to change bus. The time between arrivals of buses normally is 10 minutes. Each passenger inside the terminal await the arrival of the bus in a single queue. The bus has a capacity of 160 people (considering passengers sitting and standing).
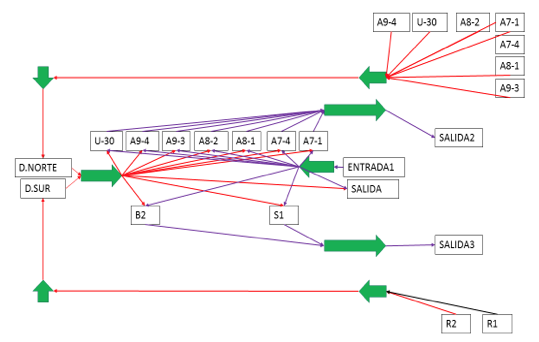
Figure 2: Process diagram in the main terminal
The model developed considers the ten possible entries where passengers can arrive to the terminal, grouped into: Seven bus routes from the north sector of the city, two bus routes from southern sector and the main station entrance passenger transfer. Besides a queue of infinite wait where passengers awaits the arrival of the main bus route that goes through the city, similarly three main outputs of the system was created: South and north buses, and out passengers that go out walking from the main station.
In regular conditions each bus with a capacity to carry 160 passengers (including passengers sitting and standing) that will come out of the main station begin to picking up passengers into the station each 10 minutes between buses waiting for the arrival of passengers to wait in the lines. Passengers that will take this bus and coming from different places either by bus or walking to the station waiting in the same place.
To evaluate the system were created the following indicators:
After evaluating the initial conditions proceeded to design an experiment changing inter-arrival times of buses to evaluate the impact in the waiting time and size of the queue. To determine the correct parameters of the simulation model including the number of runs required to validate the model, one based on a random table to define different types of seeds to generate randomness allocation is performed. We proceeded to a pilot run that served to determine the number of runs that necessary, considering the variability of the system by calculating the ideal sample size n with 90% confidence. This procedure was replicated for each of the cases analyzed changing the inter-arrival time between 5 and 23 minutes discreetly increasing in one minute, and tree different types of buses with a capacity of 180, 80 and 45 passengers each for a total of 54 instances evaluated.
To calculate the number of working replicas, we use the following formula:

In all scenarios of the simulation model 40 replicates were used despite the result of n was lower, also in each scenario different seeds was contemplated to improve the model variability.
The experiments were run, and we proceeded to find the best function to represent the relationship between the variables used in the model. Specifically relating a variable:
A: Time between arrivals of the buses
B: Capacity of the bus.
Y1: Waiting time of passengers
Y2: Capacity used of the bus.
A P value of 0.05 was used to demonstrate relationship statistically significant between each variable. Using a statistical software to determine the best relationship of this variables a polynomial regression model was obtained the relation between the times between arrivals of the buses (A), the capacity of the bus (B) and the waiting time of passengers (Y1). The P value of the model was almost cero and the R-square statistic indicates that the model, adjusted explains 92.5363% of the variability over time in queue of passengers.
The best polynomial regression model obtained was:

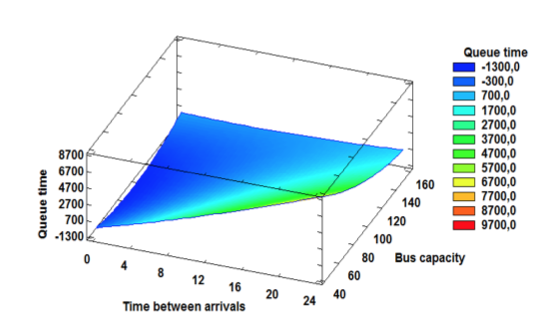
Figure 3: Surface plot of waiting time
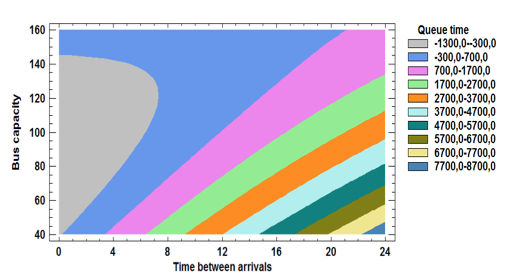
Figure 4: Contour graphics of waiting time
Other response variable analyzed was the used bus capacity or how busy was the bus leaving the main station. This case was made in the similar way, one regression analysis resulting in a model with a P-value of 0.00002 and a 91.3889% of R2 statistical implying that the relationship between the variables analyzed is very high and it can be said that the model works with a confidence level of 95%.
The model obtained was:
![]()
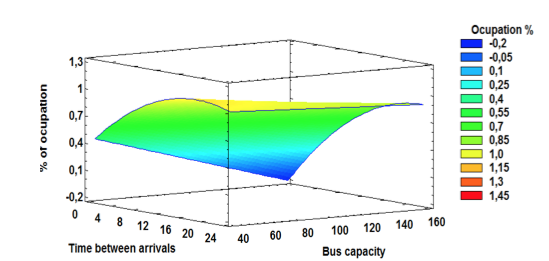
Figure 5: Surface response for occupation percentage
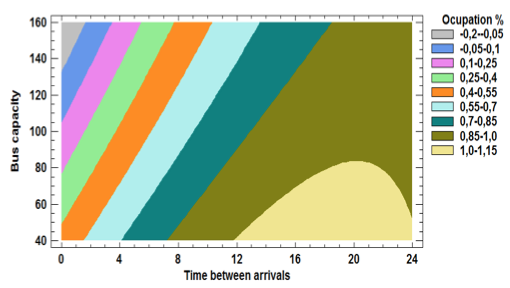
Figure 6: contour surface of occupation
These equations were used to obtain the best conditions to operate the main terminal, replacing in the equations the values of the different variables to the value that the terminal considered optimal. For example, whether the bus leaves from the terminal with full of capacity the correct value of the time between arrivals according to Table 1 is :
Bus capacity (persons) |
Time between arrivals (minutes) |
Average of passangers waiting time (minutes) |
45 |
12,4 |
5,8 |
80 |
18,2 |
4,73 |
160 |
23,02 |
12,63 |
Table 1 : Model results for a bus leaving with full capacity
However, for proper planning was considered an output bus from the main terminal to 50% of capacity, because the bus leaves after other stations and is not suitable for other passengers waiting at these places find a bus full. These results are shown in Table 2
Bus capacity (persons) |
Time between arrivals (minutes) |
Average of passangers waiting time (minutes) |
45 |
1,2 |
0,22 |
80 |
3,9 |
1,83 |
160 |
9,4 |
3,6 |
Table 2 : Model results for a bus leaving with half its capacity
The interesting thing about this result is that the main terminal is currently working with a similar value in time and capacity buses sending 160 passengers capacity with interarrival time of 10 minutes.
In many countries the mass transit systems based on bus has been the best solution to meet the mobility needs of the majority of the population as in the case of Colombia and several emerging countries. However, if this system is badly planned, managed or poorly controlled instead of improving the operation it wont be a real solution. The ideal mass transit systems must be a system which passengers can travel comfortable at a reasonable price and in a minimum of time and from the overall perspective improves the economic conditions, traffic and environmental, all this depends on how well you makes planning and management of the entire system. For that reason the system operator should apply this type of methodology in this case used to find the time between arrival of the buses, which is one of the biggest problems when has to making decisions. The correct application of techniques in these systems derived from operations research can help to improve the use of the resources, increasing the quality of their service. In addition, this methodology can be used to analyze other routes and terminals, to find the perfect schedule peak and off-peak time of the economic system in peak and off-peak, and improve resource management by improving service levels. They can also be considered to improve resilience if it finds any event, knowing the different buses with their available capabilities, that could generate a correct combination that will make the system continues to operate under normal conditions.
Currently, the results were only analyzed for the main station, excluding the other ones that belong to the system, with the whole system of transport and handling in rush hour. By conditions that are not controlled and it is difficult to have a measure such as traffic, behavior passengers and climate, lends itself to pursue a further research, , having in mind that this is an important starting point.
Mosquera Becerra, J., Reis, R. S., Frank, L., Ramirez-Marrero, F. A., Welle, B., Arriaga Cordero, E., . . . Padin, C. (2013). Transport and health: a look at three Latin American cities. Cadernos de Saúde Pública, 29(4), 654-666.
Amézquita Díaz , E. A., Reyes López , R. J., & Ochoa Villa , D. A. (2010). Análisis de Flujo Vehicular, Análisis de Congestión, Semaforización y Estacionamientos Guadalajara. Guadalajara: Universidad de guadalajara.
Cain, A. (2007). Aplicability of transmilenio rapid system of Bogotá, Colombia to the United States. Trasnportation research record: Journal of trasnportation research board, 45-54.
DANE. (2015). Informe de estadisticas de movilidad en Barranquilla. Barranquilla.
Data, G. B. (2015). Global BRT Data. Recuperado el 20 de 07 de 2015, de http://brtdata.org/
HIdalgo, D. (2005). Comparación de alternativas de transporte público masivo- una aproximación conceptual. Revista de ingnenieria Vol 21, 5-2005.
Hidalgo, D., & Carrigan, A. (2010). Lessons learned from major bus improvements bus improvements in Latin America and Asia Modernizing Public Transportation. World Resources Institute.
Hidalgo, D., & Herrman, G. (2004). The Bogotá model for sustainable transportation: inspiring developing cities through the world. Journal of trailog 82, 11-15.
Jarzab, J. T., Ligthtbody, J., & Maedea, E. (2002). Characteristics of bus rapid transit projects: An overview. Journal of publics transportation, 5(2), 31- 46.
Larragaña, P. (2003). Estimación de distribución de algoritmos aplicados a la optimización de problemas combinados. Inteligencia artificial. Revista iberoamericana de inteligencia artificial, 7(19), 149- 168.
Montoya-Torres, J. R., López Franco, J., Nieto Isaza, S., Felizzola Jiménez, H., & Herazo-Padilla, N. (2015). A literature review on the vehicle routing problem with multiple depots. Computers & Industrial Engineering, 115–129.
Osuna, E. E., & Newell, G. F. (1972). Control strategies for an idealized public transportation system. Transportation Science, 52-72.
Park, S. J. (2005). Bus network scheduling with genetic algorithms and simulation. Maryland: Master's thesis, University of Maryland.
Rodriguez, D., Vergel-Tovar, E., & Camargo, W. (2016). Land development impacts of BRT in a sample of stops in Quito and Bogotá. Transport Policy, 4-14.
Rodriguez, J. M., Benito, J. A., & Ruiz, R. E. (2013). Herramienta software para la implementación de algoritmos basados en técnicas meta heurísticas, orientados a optimizar el establecimiento de rutas para el flujo de información en comunicaciones de multidifusión. Vinculos, 66-79.
Salzborn, F. (1980). Scheduling Bus Systems with Interchanges. Transportation Science, Vol. 14, No. 3, 211-231.
Villalobos, A. R. (2008). Integración de un SIG con modelos de cálculo y optimización de rutas de vehículos CVRP y software de gestión de flotas. Dirección y organización, 7-14.
Wirasinghe, S., Hurdle, V., & Newell, G. (1977). Optimal parameters for a coordinated rail and bus transit system. Transportation Science, 11(4), 359-374.
Wright, L. (2002). Bus rapid transit. Sustainable transport: a sourcebook for policy-makers in developing citie. Deutsche Gesellschaft für Technische Zusammenarbeit.
Zhao, J., Bukkapatnam, S., & Dessouky, M. (March de 2003). Distributed Architecture for Real-Time Coordination. IEEE Transactions on Intelligent Transportation Systems, 4(1), 43-51.
Zhao, J; Dessouky, M; Bukkapatnam, S. (2006). Optimal Slack Time for Schedule-Based Transit Operations. Transportation Science, 40(4), 529–539.
Zhao, J; Sun, X. (2015). The research on small express depretiation of fixed assets in the road-long distance passengers trasnport. 978-1-4799-1891-1.
Zhao, Jiamin; Sathis, Bukkapatnam; Dessouky, Maged M. (2003). Distributed Architecture for Real-Time coordination of bus holding in transit networks. IEEE Transactions on Intelligent Transportation Systems, 43-51.
1. Universidad Autónoma del Caribe, Department of Industrial Engineering, Barranquilla, Colombia. Email: luis.ramirez@uac.edu.co
2. Universidad Autónoma del Caribe, Department of Industrial Engineering, Barranquilla, Colombia. Email: fred.mendoza@uac.edu.co
3. Universidad Autónoma del Caribe, Department of Industrial Engineering, Barranquilla, Colombia. Email: alexander.parody@uac.edu.co
4. Universidad Autónoma del Caribe, Department of Industrial Engineering, Barranquilla, Colombia. Email: fernando.gonzalez69@uac.edu.co
5. Universidad de la Costa, Department of Industrial Engineering, Barranquilla, Colombia. Fundación Centro de Investigación en Modelación Empresarial del Caribe, Barranquilla, Colombia. Email: lcastro24@cuc.edu.co
6. Universidad de la Costa, Department of Industrial Engineering, Barranquilla, Colombia. Email: mjimenez47@cuc.edu.co