![]() ISSN 0798 1015
ISSN 0798 1015

![]() ISSN 0798 1015
ISSN 0798 1015
Vol. 38 (Nº 26) Año 2017. Pág. 4
FERREIRA, Weslley Silva 1; DOMPIERI, Márcia Helena Galina 2; SANTOS, Adriana 3; RUSSO, Suzana Leitão 4; PAIXÃO, Ana Eleonora 5
Recibido: 11/12/16 • Aprobado: 12/01/2017
ABSTRACT: When looking for a hotel, the client checks the needs, requirements including cost, comfort, services offered and the location. In the hotel business there is no specific way to manage the company, but there is how to control the quality of services. The variable of the study were the "number of guests", that can be an indicator of the quality of supply of services. In this work we used this variable to apply a statistical method of quality control called "control chart". The data used were the daily number of guests registered over three months, from June first to August 31th, 2016. We identified outliers, which in this case, are positive, since the higher the occupation, the better for the property. |
RESUMO: Quando se procurar um hotel, o cliente verifica as necessidades e os requisitos, incluindo custo, sobretudo itens relacionados a conforto, serviços oferecidos e também localização. No ramo da hotelaria não existe uma forma específica de administrar a empresa, mas há como fazer o controle da qualidade dos serviços. O estudo do comportamento da variável “quantidade de hóspedes” pode ser um indicador da qualidade do fornecimento dos serviços. No presente trabalho utilizou-se a referida variável para aplicação de um método de controle estatístico de qualidade denominado “carta de controle”. Os dados utilizados foram os registros diários de hóspedes registrados ao longo de três meses, de 01 de junho a 31 de agosto de 2016. Os outliers identificados foram positivos, uma vez que quanto maior a ocupação, melhor para o estabelecimento. |

The hotel industry is an important field of the service sector responsible for job creation, especially in coastal areas of the country, its main purpose is to provide lodging, entertainment, food, security, and other services related to the well-being of customers.
In order to improve the services provided, quality assessment systems and methodologies are used, which seek to verify the existence of failures and to eliminate them or if they do not exist. Quality plays a fundamental role in the industrial, commercial and business areas, being at the center of business strategy themes in an increasingly competitive space.
According to Santos and Matschuck (2015), tourism represents an important source of income increase, investment, social inclusion, progress in the city where it is located and a better quality of life. For Feyerscgutte and Godoi (2008), tourism development in a locality or region is a process that occurs only successfully through information, knowledge and awareness that we must always change to improve our way of seeing and dealing with Reality, perceive and protect our Natural, Human and Cultural heritage; Potential through appropriate methods, techniques and procedures.
The present work aims to present an application on "statistical quality control", using the control charts in data of guest in one hotel establishment, in order to verify how the tourist behavior occurs in three months (June), school holidays (July) and low season (August), in the coastal city of Aracaju / SE.
For Costa et al. (2008, p.15) "the permanent control of processes is a basic condition for maintaining the quality of goods and services". However, there is no single, exclusive or universal definition for quality. Juran (1993) considers quality as suitability for use. Deming (2000) suggests that quality is to meet and, where possible, exceed consumer expectations.
There are still those who define quality as the value of the good or service, which quantifies the level of satisfaction of the consumer with respect to various aspects such as price, reliability, durability, aesthetics, punctuality, taste, comfort, among others. (COSTA et al., 2008, p.15).
Numerous researchers have focused on the investigation of statistical quality control techniques, such as Duncan (1986), Juran (1993), ntgomery (1991) and Vieira (1999). Cochran (1977), Duncan (1986), Chen; Elsayed (2000) and Montgomery (2009) are also presented as theoretical and applied approaches on sampling methodology, essential for sample size sizing, the basis for quality control work.
Vieira (1999) states that products must meet the requirements of consumers, as a consequence, a product only has quality when it is suitable for use. The author draws attention to two aspects: the quality of the process and that of conformation, and in order to distinguish them, it must be considered that all goods and services are produced in different quality grades, it is a variation that is intentional, Because any improvement in the quality of the project increases costs.
According to Montgomery (1991) quality characteristics can be of several types: physical, such as weight, length or voltage; Sensory as appearance, color or taste; And also time, such as maintenance, utility, durability or reliability.
By Vieira (1999) states: "since it is impossible to inspect the internal quality of a product, it is necessary to monitor the performance of the entire manufacturing process, always seeking to reduce variability by using control charts."
According to Russo et al (2012), the use of variable control charts is intended to provide information:
1) For quality improvement,
2) Process capability,
3) For product specification decisions,
4) To make decisions about the production process,
5) To make decisions about newly produced parts and to decide if one or more items can be released for the next process, or if some inspection or repair action is required.
According to Costa et al. (2008, p. 18) "The formal beginning of statistical process control occurred around 1924, when Walter A. Shewart developed and applied the control charts at Bell Telephone Laboratories."
Vieira (1999) states that three parallel lines are displayed in the usual control chart: the central, representing the mean value of quality; The upper one, representing the upper limit of control (UCL) and lower, which represents the lower limit of control (LCL), the samples being represented by points, and for better visualization of the evolution of quality over time these points are united By segments of lines.
There are control charts by attributes and by variables. By attribute, the graphs analyze the behavior of proportions and numbers, being the chart np the most known, it inspects the variation of the number of nonconforming items in constant quantities of samples. By variable - analyze the behavior of measurable characteristics such as density, length and weight, in which the best known graph is the ![]() – R, which over time inspects the mean and amplitude of a variable. (VIEIRA, 1999, p.37).
– R, which over time inspects the mean and amplitude of a variable. (VIEIRA, 1999, p.37).
The data used in this study were obtained from the daily amount of guests of a hotel establishment (Table 1), located in the city of Aracaju / Sergipe/Brasil, whose data were recorded over 92 consecutive days, in the period of June First to August 31th, 2016.
We used to analyze these data the Statistica® software, licensed to the Department of Statistical and Actuarial Sciences of the Federal University of Sergipe (DECAT-UFS). It is a program of statistical methods with several tools for visualization of database, generation of graphs, descriptive analyzes, exploratory, grouping and modeling, among other functions.
It works with categorical variables, qualitative and quantitative, and is used not only in Statistics, but also in the most diverse areas such as Social, Agrarian, Biological Sciences and Engineering.
Table 1. Data registered by the hotel.
Day |
Guests |
Day |
Guests |
Day |
Guests |
Day |
Guests |
1 |
104 |
24 |
174 |
47 |
100 |
70 |
70 |
2 |
106 |
25 |
177 |
48 |
85 |
71 |
60 |
3 |
109 |
26 |
100 |
49 |
141 |
72 |
78 |
4 |
69 |
27 |
76 |
50 |
142 |
73 |
97 |
5 |
81 |
28 |
117 |
51 |
151 |
74 |
87 |
6 |
64 |
29 |
91 |
52 |
144 |
75 |
85 |
7 |
77 |
30 |
88 |
53 |
212 |
76 |
49 |
8 |
70 |
31 |
90 |
54 |
107 |
77 |
73 |
9 |
77 |
32 |
64 |
55 |
109 |
78 |
75 |
10 |
91 |
33 |
59 |
56 |
105 |
79 |
67 |
11 |
155 |
34 |
44 |
57 |
85 |
80 |
97 |
12 |
111 |
35 |
77 |
58 |
87 |
81 |
69 |
13 |
62 |
36 |
76 |
59 |
86 |
82 |
63 |
14 |
91 |
37 |
142 |
60 |
90 |
83 |
129 |
15 |
65 |
38 |
169 |
61 |
75 |
84 |
80 |
16 |
97 |
39 |
186 |
62 |
54 |
85 |
63 |
17 |
86 |
40 |
78 |
63 |
83 |
86 |
65 |
18 |
109 |
41 |
62 |
64 |
77 |
87 |
87 |
19 |
69 |
42 |
79 |
65 |
81 |
88 |
80 |
20 |
65 |
43 |
71 |
66 |
90 |
89 |
62 |
21 |
111 |
44 |
68 |
67 |
71 |
90 |
51 |
22 |
126 |
45 |
106 |
68 |
67 |
91 |
72 |
23 |
175 |
46 |
150 |
69 |
58 |
92 |
69 |
Source: Primary data - hotel establishment.
Firstly, before the construction of the control charts, it is necessary to calculate the central values and the control limits, using the equations (Russo et al, 2006):
|
|
where:
![]() = Mean of subgroup averages;
= Mean of subgroup averages;
![]() = Mean of the i-th subgroup;
= Mean of the i-th subgroup;
g = Number of subgroups;
![]() = Mean amplitude of subgroups;
= Mean amplitude of subgroups;
Ri = Range of the i-th subgroup.
Table 2. Equations for ![]() and R charts
and R charts
|
Mean |
Range |
Upper Control Limit |
UCL = |
UCL = D4. |
Low Control Limit |
LCL = |
LCL = D3. |
Source: Montgomery (1991).
The value of A2 depends on the size of the samples and is given by Table 3, and D3 is also given in table, however for samples of sizes 7, 8, 9 and 10, because if they are smaller than 6, one should do LCL = 0
Table 3. Correction factors for charts ![]() and R.
and R.
Sample size n |
|
R Charts |
||||
A2 |
d2 |
1/ d2 |
d3 |
D3 |
D4 |
|
2 |
1,880 |
1,128 |
0,8862 |
0,853 |
- |
3,267 |
3 |
1,023 |
1,693 |
0,5908 |
0,888 |
- |
2,575 |
4 |
0,729 |
2,059 |
0,4857 |
0,880 |
- |
2,282 |
5 |
0,577 |
2,326 |
0,4299 |
0,864 |
- |
2,115 |
6 |
0,483 |
2,534 |
0,3946 |
0,848 |
- |
2,004 |
7 |
0,419 |
2,704 |
0,3698 |
0,833 |
0,076 |
1,924 |
8 |
0,373 |
2,847 |
0,3512 |
0,820 |
0,136 |
1,864 |
9 |
0,337 |
2,970 |
0,3367 |
0,808 |
0,184 |
1,816 |
10 |
0,308 |
3,078 |
0,3249 |
0,797 |
0,223 |
1,777 |
Note: The symbol "-" in column D3 means that the LCL is not considered.
Source: Montgomery (2009).
In case there are points out of control, identify them and eliminate them to do the charts, in which it is necessary to recalculate the central limits for mean and range, which must be determined by the equations below, and then calculate the new upper control limit and lower control limit:
|
|
where:
![]() = Mean of the means of the subgroups discarded;
= Mean of the means of the subgroups discarded;
gd = Number of subgroups discarded;
Rd = Amplitudes of subgroups discarded.
Table 4. Equations for revised charts
|
Mean |
Amplitude |
Upper Control Limit Revised |
|
|
Lower Control Limit Revised |
|
|
Source: Montgomery (2009).
where ![]() , and d2, A, D1 e D2 are factors taken from Table 5 and used to calculate the revised control limits.
, and d2, A, D1 e D2 are factors taken from Table 5 and used to calculate the revised control limits.
Table 5. Factors for limits revised of ![]() and R.
and R.
Sample |
|
R Charts |
||||||||
Factors for Control Limit |
Factor for Central Value |
Factors for Control Limit |
||||||||
n |
A |
A2 |
A3 |
d2 |
d3 |
D1 |
D2 |
D3 |
D4 |
|
2 |
2,121 |
1,881 |
2,659 |
1,128 |
0,853 |
0 |
3,687 |
0 |
3,269 |
|
3 |
1,732 |
1,023 |
1,954 |
1,693 |
0,888 |
0 |
4,357 |
0 |
2,574 |
|
4 |
1,500 |
0,729 |
1,628 |
2,059 |
0,880 |
0 |
4,699 |
0 |
2,282 |
|
5 |
1,342 |
0,577 |
1,427 |
2,326 |
0,864 |
0 |
4,918 |
0 |
2,114 |
|
6 |
1,225 |
0,483 |
1,287 |
2,534 |
0,848 |
0 |
5,078 |
0 |
2,004 |
|
7 |
1,134 |
0,419 |
1,182 |
2,704 |
0,833 |
0,205 |
5,203 |
0,076 |
1,924 |
|
8 |
1,061 |
0,373 |
1,099 |
2,847 |
0,820 |
0,387 |
5,307 |
0,136 |
1,864 |
|
9 |
1,000 |
0,337 |
1,032 |
2,970 |
0,808 |
0,546 |
5,394 |
0,184 |
1,816 |
|
10 |
0,949 |
0,308 |
0,975 |
3,078 |
0,797 |
0,687 |
5,469 |
0,223 |
1,777 |
|
11 |
0,905 |
0,285 |
0,927 |
3,173 |
0,787 |
0,812 |
5,534 |
0,256 |
1,744 |
|
12 |
0,866 |
0,266 |
0,886 |
3,258 |
0,778 |
0,924 |
5,592 |
0,284 |
1,716 |
|
13 |
0,932 |
0,249 |
0,850 |
3,336 |
0,770 |
1,026 |
5,646 |
0,308 |
1,692 |
|
14 |
0,902 |
0,235 |
0,817 |
3,407 |
0,763 |
1,118 |
5,696 |
0,328 |
1,672 |
|
15 |
0,775 |
0,223 |
0,789 |
3,472 |
0,756 |
1,204 |
5,740 |
0,347 |
1,653 |
|
16 |
0,750 |
0,212 |
0,763 |
3,532 |
0,750 |
1,282 |
5,782 |
0,363 |
1,637 |
|
17 |
0,728 |
0,203 |
0,747 |
3,588 |
0,744 |
1,356 |
5,820 |
0,378 |
1,622 |
|
18 |
0,707 |
0,194 |
0,718 |
3,640 |
0,739 |
1,423 |
5,857 |
0,391 |
1,609 |
|
19 |
0,688 |
0,187 |
0,698 |
3,689 |
0,734 |
1,487 |
5,891 |
0,403 |
1,597 |
|
20 |
0,671 |
0,180 |
0,680 |
3,735 |
0,729 |
1,548 |
5,922 |
0,414 |
1,586 |
|
21 |
0,655 |
0,173 |
0,663 |
3,778 |
0,724 |
1,606 |
5,950 |
0,425 |
1,575 |
|
22 |
0,640 |
0,167 |
0,647 |
3,819 |
0,720 |
1,659 |
5,979 |
0,434 |
1,566 |
|
23 |
0,626 |
0,162 |
0,633 |
3,858 |
0,716 |
1,710 |
6,006 |
0,443 |
1,557 |
|
24 |
0,612 |
0,157 |
0,619 |
3,895 |
0,712 |
1,759 |
6,031 |
0,452 |
1,548 |
|
25 |
0,600 |
0,153 |
0,606 |
3,931 |
0,708 |
1,807 |
6,055 |
0,460 |
1,540 |
|
Source: Montgomery (1991).
From Table 6, which provides the descriptive statistics of the data, it is possible to identify that the lowest recorded occupancy was only 44 guests, while the largest was 212, with 168 being the range, with a mean of approximately 93 and standard deviation of 34 guests.
Table 6. Descriptive statistics of data.
Minimum |
Maximum |
Mean |
Variance |
Standard deviation |
Sum |
44 |
202 |
92,79 |
1157,64 |
34,02 |
8436 |
It can be seen from Figure 1 that there is an increase in the number of guests in June, coinciding with the celebrations of the June festivities - São João and São Pedro holidays - attracting tourists from other cities and regions. In July, which coincides with school holidays, there are also considerable increases in tourists in coastal cities in the Northeast. It is also noticeable that since August, the number of guests declines, once the low season in the region begins, coinciding with the period of "back to school".
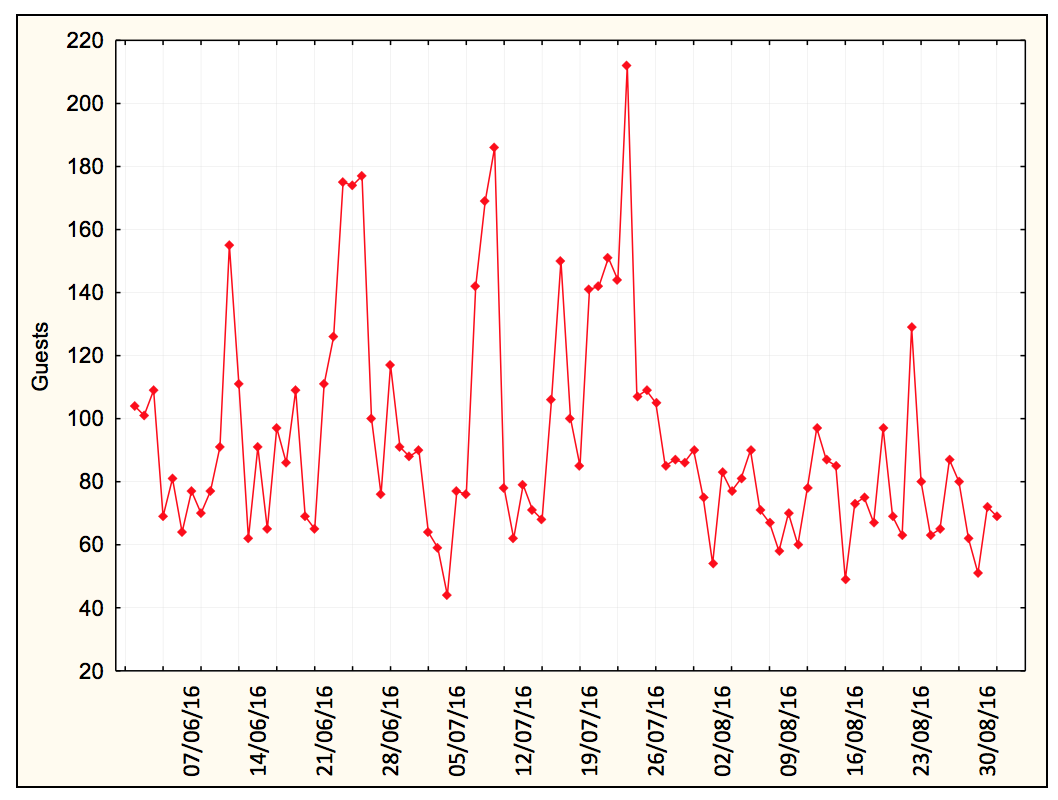
Figure 1- Graph with the number of guests in the period
With regard to the occupation as a function of the days of the week, it can be seen from Figure 2 that on Thursdays, Fridays and Saturdays there is a greater occupation, which decreases abruptly on Sundays and Mondays.
The Figure 3 shows the mean control chart (![]() ) of hotel guest data, with lower control limit of 46.943 and upper control limit 138.64, with central limit value 92.793 and that of range (R) limited between zero and 79.667, with the central value being 24.389.
) of hotel guest data, with lower control limit of 46.943 and upper control limit 138.64, with central limit value 92.793 and that of range (R) limited between zero and 79.667, with the central value being 24.389.
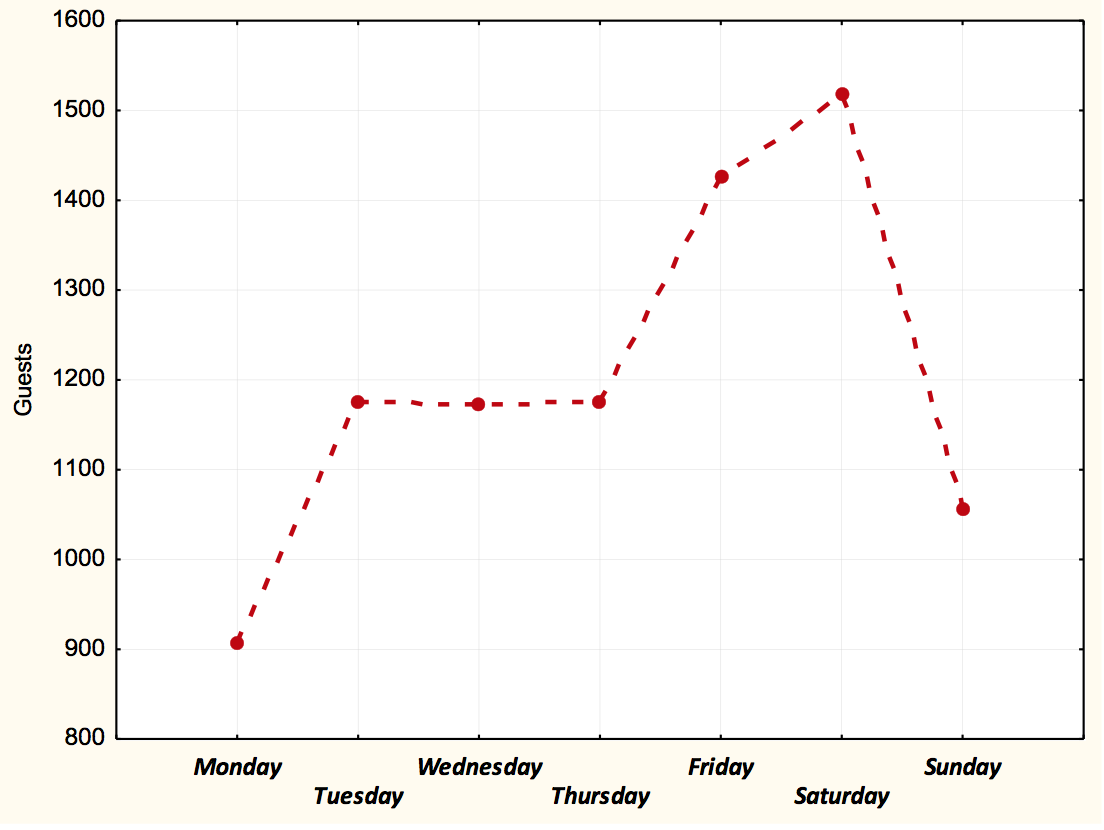
Figure 2- Graph with the number of guests, according to the days of the week, in the period
You can verify that there are some dots above the upper limit. In the case of the present work, such outliers are positive, since the greater the occupation, the better for the establishment, however, in a production process, it would be necessary to identify and correct the special causes of variation, since they would indicate that the process would not be under control.
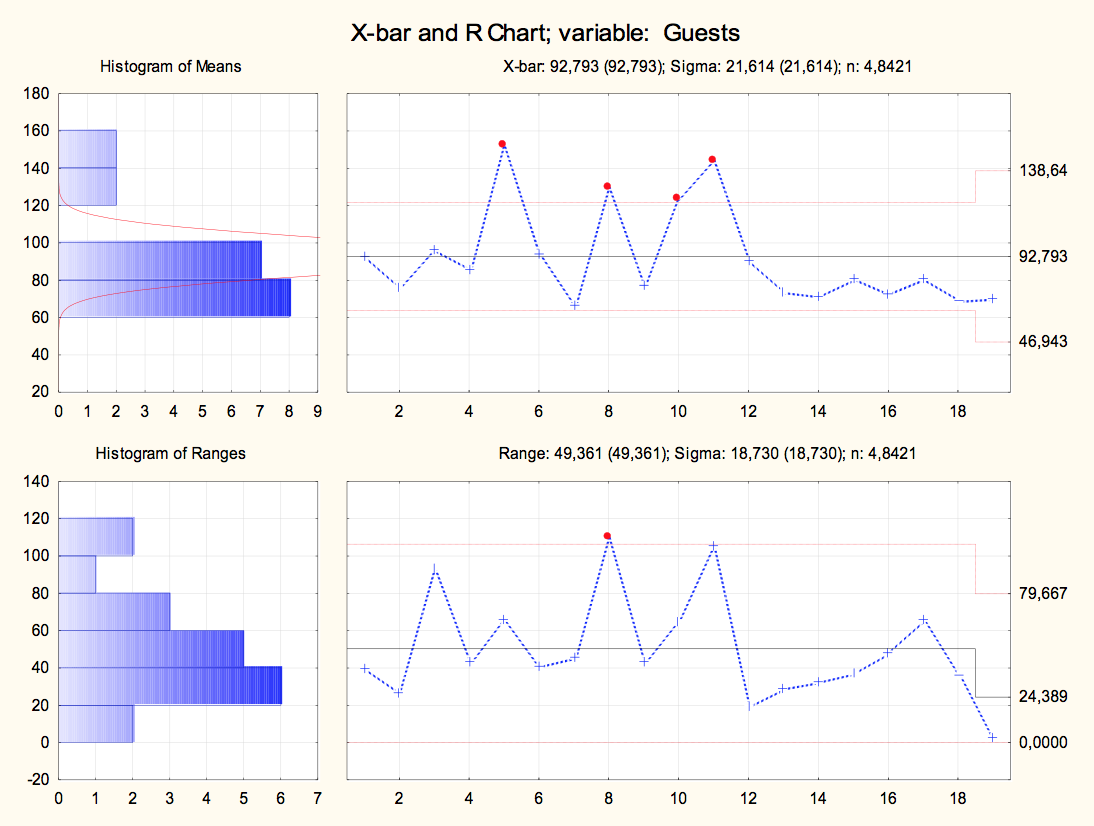
Figure 3- Charts ![]() of number of guests.
of number of guests.
For such correction it would be necessary to identify the out-of-control points to eliminate them and thus calculate new values for the lower and upper control limits and also the central value for the mean and for the range. As an example, 13 of the 92 daily records were eliminated, since they were above the upper control limit, so that the process reached statistical control (stability).
The figure 4 shows the new graphics, now with the process in control. In the graph of Mean, the revised controls limits assumed the values of 57.60 and 104.90 for lower control limit revised and upper control limit revised respectively, being 81.25 the new central control value and for the range, zero the lower control limit revised and 74.07 the upper control limit revised with a revised core value of approximately 32.46.
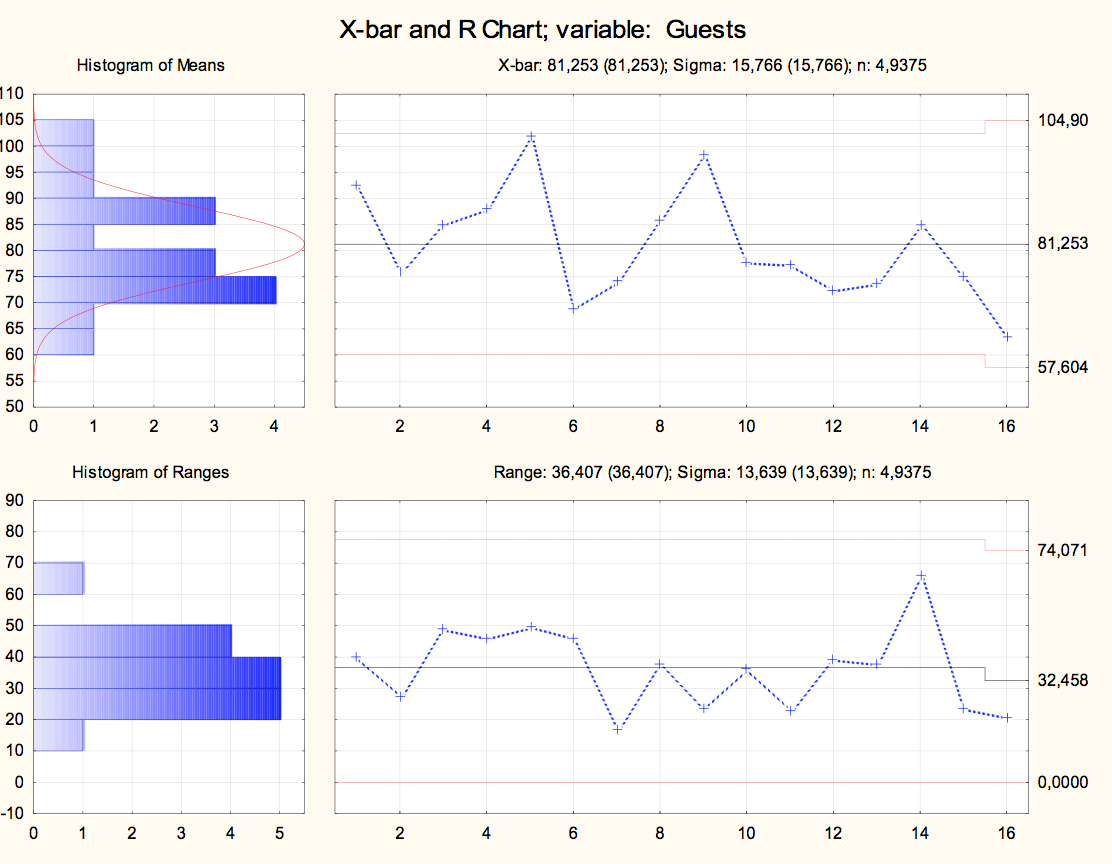
Figure 4- Charts ![]() Revised of number of guests
Revised of number of guests
Throughout the work it was verified that the control chart is an important instrument that deals with the follow-up of a process and statistically determines ranges denominated control limits, bounded by an upper line (upper control limit) and another lower line (limit lower control), in addition to a middle line, whose purpose is to verify if the process is under control, ie, free of special causes. The results showed that the process was "out of control", because it presented points above the upper limit, soon after their identification they were eliminated, adjusting it.
CHEN, A.; ELSAYED, E. A. (2000) An alternative mean estimator for processes monitored by SPC charts. Int. J. Prod. Res., 38(13), 3093-3109.
COCHRAN, W.C. Sampling techniques. New York: John Wiley & Sons, 1977. 422 p.
COSTA, A. F. B.; EPPRECHT, E.; CARPINETTI, L. C. Controle estatístico da qualidade. 2. ed. São Paulo: Atlas, 2008.
DEMING, W. E. Quality, Productivity and Competitive Position. Massachusetts Institute of Technology, Center for Advanced Engineering Study, Cambridge. MA, 1992.
DUNCAN, A.I. Quality control and industrial statistics. Illinois: Richard D. Irwin Inc., 1986.
FEUERSCHÜTTE, S. G.; GODOI, C. K. (2008) Competências de Empreendedores Hoteleiros: um estudo a partir da metodologia da história oral. Turismo: Visão e Ação, v. 10, n. 1, art. 3, p. 39-55.
JURAN, J.M.; GRYNA, F.M. Controle da qualidade: métodos especiais de apoio à qualidade. São Paulo: Makron Books, 1993. 193 p.
MONTGOMERY, D.C. Introduction to statistical quality control. New York: John Wiley & Sons, 1991.
MONTGOMERY, D.C. Introduction to Statistical Quality Control (6nd Ed), John Wiley & Sons. (2009).
RUSSO, S. L.; FABRIS, J. P; CAMARGO, M. E. (2012) Applications of Control Charts Arima for Autocorrelated Data. INTECH Open Access Publisher.PP.31-53. http://cdn.intechopen.com/pdfs-wm/38136.pdf Acess in June 2016.
RUSSO, S. L.; RODRIGUES, P. M. M; CAMARGO, M. E .(2006). Aplicação de Séries Temporais na Série Teor de Umidade da Areia de Fundição da Indústria Fundimisa. Revista Gestão Industrial, pp.36-46.
SANTOS, R. A.; MATSCHUCK, T.C. (2015) A Sustentabilidade e a Cadeia Produtiva Hoteleira: Um Estudo de Caso no JW Marriott, Rio de Janeiro. Revista Turismo - Visão e Ação - Eletrônica, v. 17, n. 2, art. 3, p. 444-474.
SHEWHART, W.A. Economic control of quality of the manufactured product. Van Nostrand, New York. 1931.
VIEIRA, S. Estatística para a Qualidade. Rio de Janeiro: Elsevier, 1999.
1. Statistical Graduate, Department of Statistics and Actuarial Sciences, Federal University of Sergipe, Brazil. Email: weslleyvox@hotmail.com
2. Statistical Undergraduate, Department of Statistics and Actuarial Sciences, Federal University of Sergipe, Brazil. Email: marciageografia@gmail.com
3. Statistical Undergraduate, Department of Statistics and Actuarial Sciences, Federal University of Sergipe, Brazil. Email: dralin@bol.com.br
4. Associate Professor of Department of Statistics and Actuarial Sciences and Professor of Postgraduate Program in Intellectual Property Science (PPGPI), Federal University of Sergipe. Email: suzana.ufs@hotmail.com
5. Professor of Postgraduate Program in Intellectual Property Science (PPGPI), Federal University of Sergipe. Email: aepaixão@gmail.com