![]() ISSN 0798 1015
ISSN 0798 1015

![]() ISSN 0798 1015
ISSN 0798 1015
Vol. 38 (Nº 26) Año 2017. Pág. 31
José Antonio DE FRANÇA 1; Rogério Lucio Soares da SILVA Junior 2
Recibido: 15/12/16 • Aprobado: 30/01/2017
ABSTRACT: Electric power is an essential input for growth and development, and it is generated by large hydroelectric power plants in Brazil. Its supply is sustainable so long its use and investiment allocation are rational. Since the last decade of the 20th Century, Brazil has restructured its electric power industry, allowing the participation of private capital. Given the importance of electric power for the economy’s growth, we have empirically investigated how the ROA (Return on Assets) relates to the CM (Contribution Margin), PNSR (Productivity of Net Sales Revenue) and TPCR (Return on equity) in the context of production, when the company is efficient, and using a sample comprising financial statements of 11 companies listed in BM&FBOVESPA from 2003 to 2013. In order to obtain an answer to this question, we aimed at identifying and associating levels of ROA with scores of stochastic frontier efficiency through parametric and nonparametric methodology anchored in DEA (Data Envelopment Analysis) approach and linear regression. Results showed that the efficient company combines CM with a smaller rate of TPCR and varied rates of PNSR in achieving the highest ROA rate. Results are consistent and relevant because they satisfy the requirements of the methodology employed, and show significant differences of performance/efficiency between electric power companies. These results differ from previous research for showing evidence that the efficiency/inefficiency of a company stems from the combination of return variables with performance variables, thus making it possible for future research to explore a possible connection between ROA and supply interruptions. |
RESUMO: Energia elétrica, insumo básico para alavancar crescimento e desenvolvimento, é obtida pela geração em grandes hidrelétricas no Brasil. A oferta desse insumo é tão sustentável quanto forem racionais seu uso e alocação de investimentos. O Brasil reestruturou sua indústria de energia elétrica a partir da última década do século XX, permitindo a participação do capital privado. Dada a importância desse insumo para o crescimento da economia, investiga-se, empiricamente, como o ROA (Return on Assets) se relaciona com a MC (Margem de Contribuição), PRLV (Produtividade da Receita de Líquida de Vendas) e RCT (Retorno do Capital de Terceiros) no nível de produção em que a firma é eficiente, utilizando amostra composta por demonstrações financeiras de 11 firmas listadas na BM&FBOVESPA de 2003 a 2013. Para obter resposta à investigação tem-se por objetivo identificar e associar níveis de ROA com scores da fronteira de eficiência estocástica, por meio de metodologias não-paramétrica e paramétrica ancoradas nas abordagens DEA (Data Envelopment Analysis) e regressão linear. Os resultados mostram que firma eficiente combina MC com menor nível de RCT e níveis variados de PRLV na obtenção do maior nível de ROA. Os resultados são consistentes e relevantes porque satisfazem os requisitos das metodologias utilizadas, mostram significativas diferenças de desempenho/eficiência entre as firmas de energia elétrica, diferenciam-se de pesquisas antecedentes por mostrarem evidências de que firma eficiente/ineficiente resulta da combinação de variáveis de retorno com variáveis de desempenho, e permitem pesquisa futura explorar possível conexão entre ROA e interrupções no fornecimento de energia elétrica. |

The growth and development of a country depends on a combination of factors that make up its basic infrastructure such as: communication, technology, transportation, production, education, among others. One of the important pillars of this infrastructure is the electric power industry that must be sustainable enough to signal the economic agents that they can produce efficiently and safely. Electricity is an immediate commodity and its supply can be as efficient as it is rational to use and allocate investments in generation, transmission and distribution processes. In the absence of these conditions, the supply of energy may be insufficient and, due to scarcity, restrict economic growth.
Shortage or interruption in the supply of electricity can cause economic and domestic losses in the United States and Canada, in 1977 and 2003, Italy in 2003, Indonesia in 2005, Colombia in 2007, Argentina in 2006, Brazil in 1999 (Canzian, 2009). In Brazil, in addition to the 1999 blackout, interruptions in the supply of electricity have been recurrent, either with investments made by the government or by the private initiative.
From the 1999 blackout, Brazil began a restructuring of its electric power industry, from a state monopoly to private capital, through privatizations of companies and concessions to explore the business. Since then, the business has been explored by the government, private enterprise and both, as Joskow (2003) and Hirota (2006) argue, in line with what has been happening in other developed and developing countries, in the perspective of better performance and efficiency.
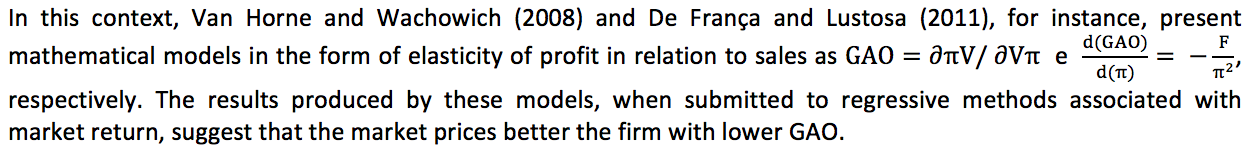
Performance and efficiency has motivated researchers to develop studies under various interests using a variety of methodologies, such as stochastic efficiency frontier modeling applied to segments such as education, production and finance. Using the stochastic efficiency frontier modeling, Halkos and Salamouris (2004) investigated the efficiency / inefficiency of Greece's financial system; Tannuri-Pianto et al. (2009) investigated the production of electric energy in Brazil combining physical and financial variables.
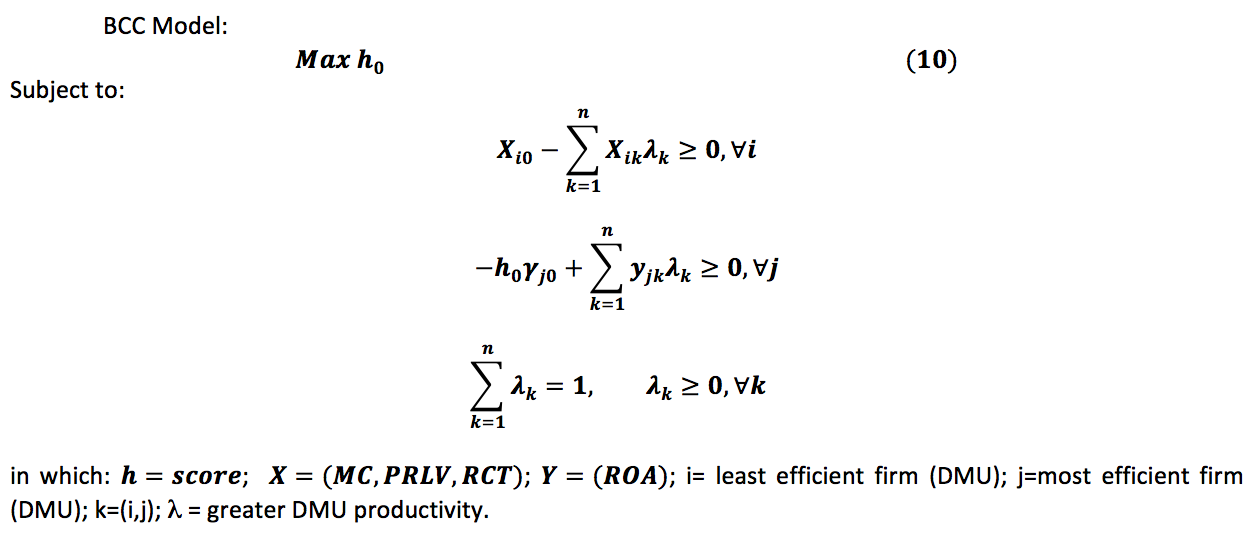
As contextualized, electric energy is a relevant input of the growth matrix of a country, and studying the performance and efficiency of the firms of this industry, under the aspect of asset performance, is the main challenge and motivation of this research. In this sense, accounting variables that signal return are retrieved from the published financial statements of these firms, which show how the firms, based on the sample, place themselves in relation to the performance in the frontier of stochastic efficiency, using the non-parametric DEA (Data Envelopment Analysis), results-oriented (output), with constant return of scale (CCR) and variable return of scale (BCC). The sample covers the period from 2003 to 2013, composed of 11 Brazilian electric power companies listed on the BM & FBOVESPA and the financial statements were retrieved from the Economatica repository. In this context, the problem that the research intends to answer is how ROA (Return on Assets) relates to the Contribution Margin (MC), the Net Sales Revenue Productivity (PRLV) and the RCT (Return of third parties) at the level of production in which the firm is efficient.
To obtain the evidence that can support the answers to the research problem, the objective is to identify and associate ROA levels, by firm and sample mean, with the stochastic efficiency frontier scores obtained through the application of DEA and the Tests of hypotheses produced by multivariate linear regression model.
The choice of the 11 firms in the sample and the period from 2003 to 2013 are related to the availability and consistency of the accounting variables required to feed the research models described in an analytical way later in section 3.
The results of the research are consistent and relevant because they signal, individually and on average, the efficiency / inefficiency of firms' performance based on the return on investments (ROA) of the electric power business in Brazil, and so they differ from others Available research on the subject, and may contribute to subsequent research to investigate the possible relationship between low performance / inefficiency and blackouts that have been recurring since 1999.
Subsequent sections are devoted to the theoretical discussion (2) where the main available studies on the topic are presented and discussed; Methodology and sample (3) are defined the models with their respective arguments, as well as the analysis and description of the sample; Analysis of the results (4) dialogues with the outputs of the tests produced by the models and in a comparative way the answers to the research problem are obtained; Conclusions (5) summarize the research findings and contributions; and references that relate the studies that support the theoretical discussion.
In this section we discuss some of the main contributions of previous research on the performance of firms using the non-parametric Data Envelopment Analysis (DEA) model and other parametric methodologies such as linear regression. In general this model is used to measure efficiency / inefficiency in the production of tangible and intangible goods. In this research the product is information, which is intangible, extracted from the standardized financial statements for decision making of Brazilian companies of the electric energy business.
The main purpose of the DEA method is to compare the performance of certain quantities of Decision Maker Units (DMUs) that perform similar tasks and differ in the quantities of input consumed related to production. DMU can be a firm, a department, a cost center, or any decision-making structure from which efficiency is expected.
The DEA estimation approach uses the CCR models originally attributed to Charnes et al. (1978) and BCC whose credit is attributed to Banker et al. (1984). The CCR model is known as the Constant Returns to Scale (CRS) model and the BCC model is also known as the VRS (Variable Returns to Scale) model. By working with constant returns to scale, the CCR model creates a nonparametric linear surface, in parts, involving the data so that inputs or inputs produce proportional variation in outputs. The BCC model, by working with variable returns of scale, replaces the axiom of proportionality between inputs and outputs by the convexity axiom, as shown by Mello, Meza, Gomes and Neto (2005).
In the context of the intangible product, Halkos and Salamouris (2004) studied the financial system of Greece in order to measure the efficiency / inefficiency of the banks, using the DEA technique. They used as input the financial indices suggested as efficient by accounting, for the period from 1997 to 1999. In order to reach the objective of the research, they proposed a model composed by a set of empirical references to compare efficient banks with inefficient banks. They declare that they have found evidence that the greater the total assets of the bank, the greater its efficiency, but also that they found several variations in performance accompanied by a reduction in the number of small banks caused by mergers and acquisitions.
With the purpose of measuring the efficiency and performance of European banks, Beccalli, Casu and Girardone (2006), based on data produced by price accounting, used the DEA and SFA (Stochastic Frontier Analysis) technique to investigate whether changes in the Stock prices could be explained by changes in operating efficiency. Corroborating Berger and Humphrey (1992), they declare that measures of operational efficiency are the best indicators to evaluate the performance of the banks, when compared to the traditional accounting indicators. Their results suggest that changes in bank efficiency impact changes in stock prices.
Farrell (1957), studying the measurement of productive efficiency of agribusiness firms in the United States, initially considering the manufacture of single product under conditions of constant return of scale, describes and proposes an efficiency measurement method that uses the production function, input-oriented prices and measures, with the aid of the isoquant diagram, which it uses to explain the evaluation model.
In this line of reasoning, Lovell (1992) discusses the relationship between the concepts of productivity and efficiency, and considers some hypotheses related to determinants of firm performance, when evaluated by efficiency and productivity. He argues that productivity varies due to differences in production technology and context. Their findings suggest that efficiency can be defined as technical and economic, depending on the measurement environment, and that efficiency and productivity are evaluated for two reasons: The first is because they are indicators of success and performance by which the production units are evaluated; the second is by measuring and separating its effects from the production environment, which can explore hypotheses related to sources of efficiency or productivity differentials.
Efficiency studies, as a measure of optimal firm performance, are based on studies by Knight (1921), whose contributions subsidized Kaldor's (1934) studies with the discussion of firm balance, and later with studies Of Coase (1937) on the nature of the firm.
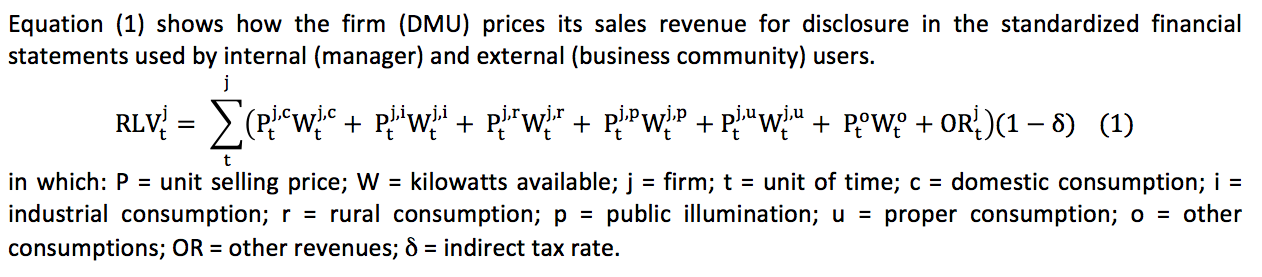
More recently, efficiency signaling has been studied in the field of firms' performance through the degree of operational leverage (GAO), as discussed by Hodgin and Kiymaz (2005); Jorgensen et al (2009) and De França and Lustosa (2011). These studies elect operational leverage as a measure of profit elasticity that can be captured by the market and signal that one or more firms are efficient or inefficient in relation to market reactions. But these studies use parametric modeling metrics, in which results are obtained by the average data set of the observations.
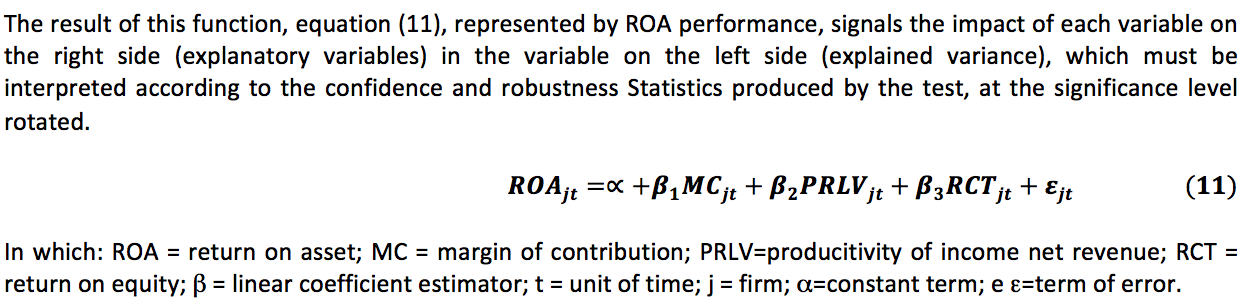
The methodology used is positivist, making use of non-parametric and parametric models. The non-parametric model uses the DEA approach and the parametric model makes use of analytical approaches, and multivariate linear regression with panel data with random effects. The DEA approach investigates the efficiency / inefficiency, by firm and on average, in the generation of performance in relation to the stochastic efficiency frontier, taking as input the input variables and as a result (output) the dependent variable ROA (Return on Assets ).The random effects approach is used to test the aggregate statistical significance of each input in the performance generation, in the set of firms, in the extension of the sample, since it is the most adequate. These approaches were run on a set of average and individual values data covering the variables of interest of the research, using DEA-Solver and gretl applications.
The variables of interest of the research were derived from the accounting variables and are (a) the return of the asset (ROA); (B) productivity of net sales revenue (PRLV); (C) return on equity (RCT); And (d) contribution margin (MC). The results of the tests run with the DEA model are individual by firm and average of aggregates. In the DEA model, a firm is called a DMU from which performance and efficiency are expected. The results obtained through the multivariate linear regression model refer to the set of observations, in average terms, per variable in the sample extension.
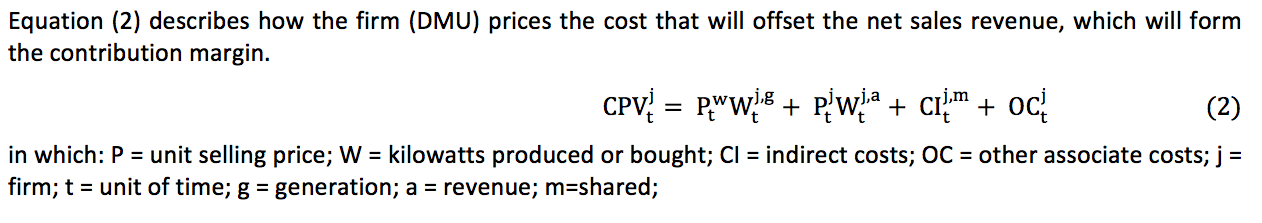
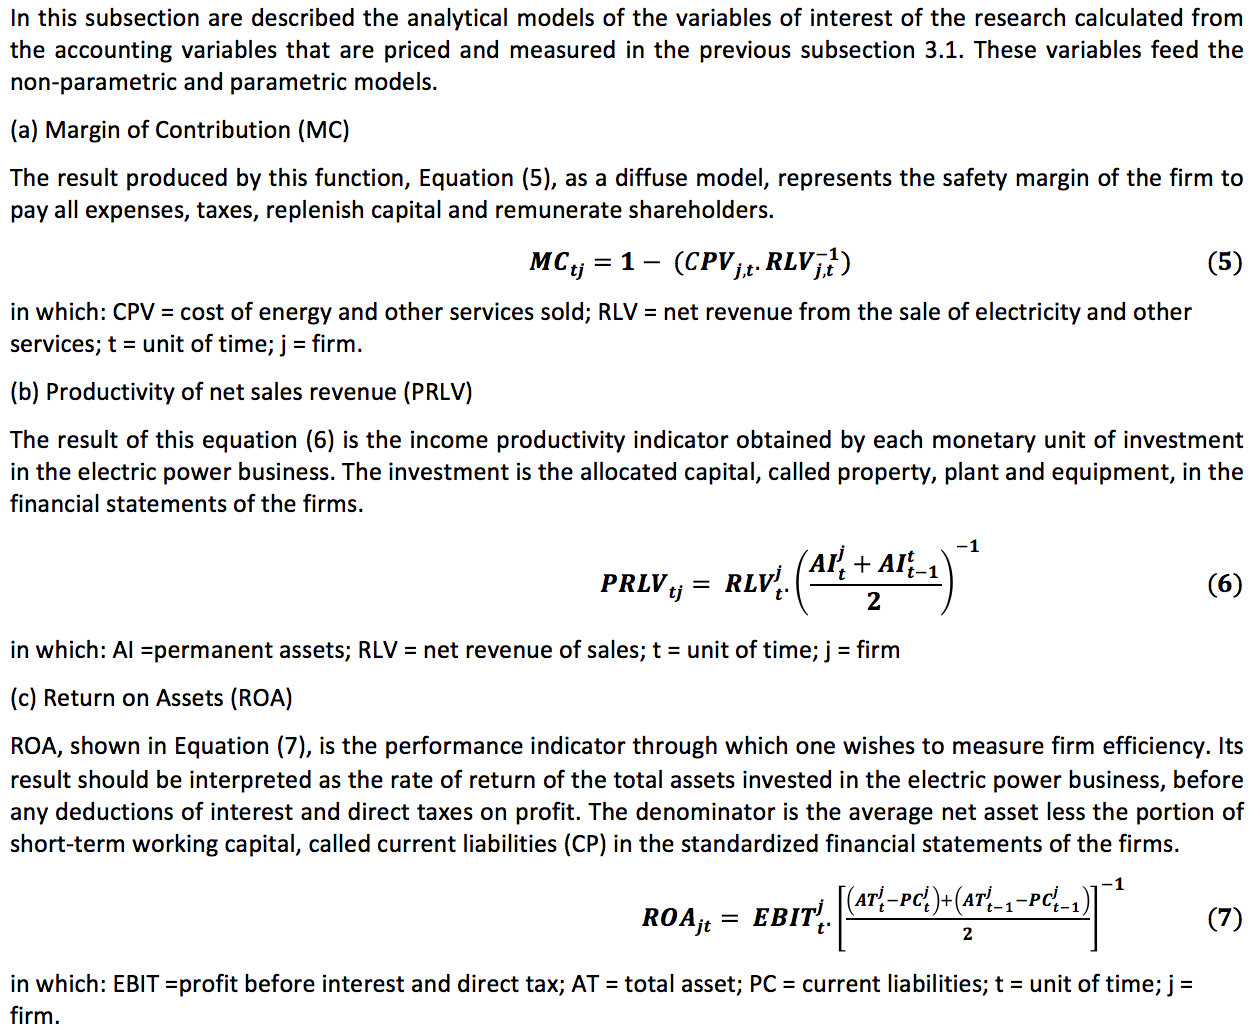
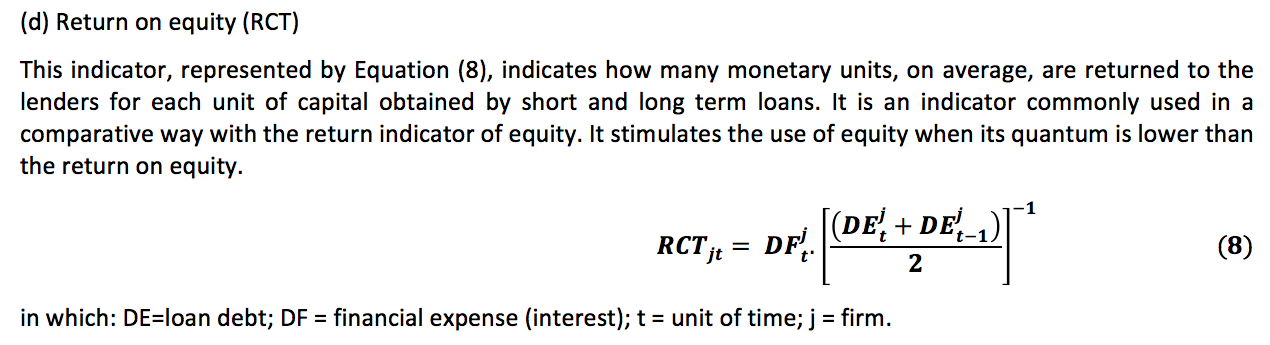
In this subsection we describe the analytical models used to calculate and price the accounting variables that are used to calculate the variables of interest of the research.
(a) Net Sales Revenue (RLV)
(b) Cust of Products Sold (CPV)
(c) Net profit (LL)
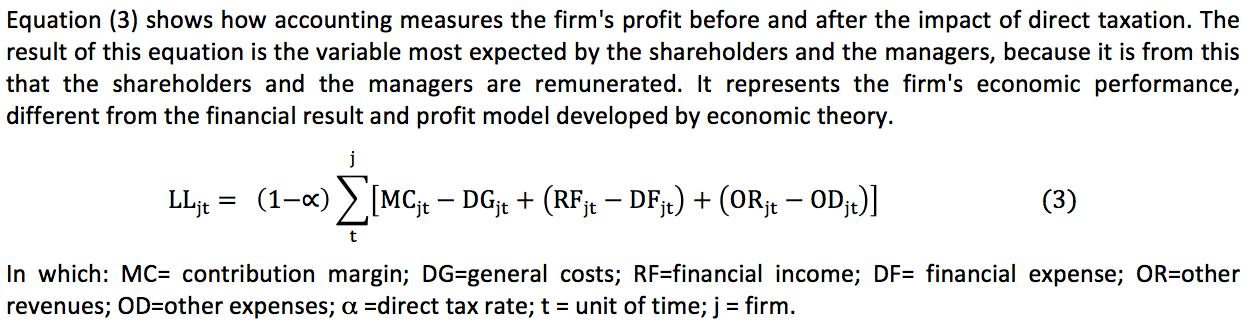
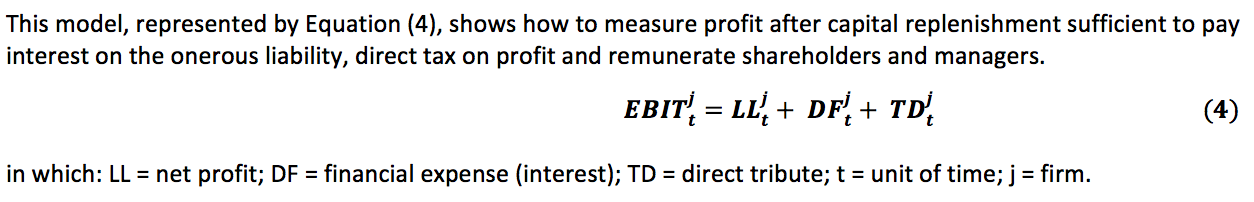
(d) Profit before interest and taxes (EBIT)
The sample firms were retrieved from the Economatica repository. The initial search retrieved the standardized financial statements of the electric power business firms in Brazil from 1996 to 2013. However, the financial statements of several repository firms present inconsistency and data omission restrictions. After the data treatment, due to these restrictions, only the 11 firms, from 2003 to 2013, listed in Table 1, are consistent. The financial statements in functional currency (R $) are updated by the variation of the IPCA (Extended Consumer Price Index) in the base 2013.
Table 1: Firms of the electric power business in Brazil, from 2003 to 2013 with consistent data that meet the search criteria.
SAMPLE BRAZILIAN ELECTRICITY FIRMS |
|||||
F1 |
DMU1 |
AES SUL |
F7 |
DMU7 |
COSERN |
F2 |
DMU2 |
BAND |
F8 |
DMU8 |
ELEKTRO |
F3 |
DMU3 |
CELPE |
F9 |
DMU9 |
ELETROPAULO |
F4 |
DMU4 |
CEMAR |
F10 |
DMU10 |
PAUL F LUZ |
F5 |
DMU5 |
COELBA |
F11 |
DMU11 |
TRACTBEL |
F6 |
DMU6 |
COELCE |
|||
F=FIRMA=DMU (Decision Maker Unit)
The accounting variables selected are (a) net sales revenue (RLV); (B) cost of goods sold (CPV); (C) immobilized asset (AI); (D) current liabilities (CP); (E) shareholders' equity (PL); (F) net income (LL); (G) loan debt (DE); (H) financial expenses (DF); (I) total assets (AT); And (j) earnings before interest and taxes (EBIT). From these accounting variables, the variables of interest of the research, shown in Table 2, were calculated using the models described in subsections 3.1 and 3.2 above.
Table 2: Average performance indicators extracted from the averages of the
accounting variables of the 2003 to 2013 financial statements of the eleven
Brazilian electric power companies totaling 121 annual observations per variable
Firm |
MC |
PRLV |
RCT |
ROA |
F1 |
0,16961 |
1,04274 |
0,27220 |
0,09198 |
F 2 |
0,21645 |
0,88414 |
0,23234 |
0,18549 |
F 3 |
0,28465 |
1,66629 |
0,17539 |
0,13784 |
F 4 |
0,39989 |
1,05083 |
0,15524 |
0,23277 |
F 5 |
0,38033 |
1,30499 |
0,28207 |
0,24377 |
F 6 |
0,28273 |
0,90919 |
0,18155 |
0,19076 |
F 7 |
0,28478 |
1,24475 |
0,17759 |
0,25819 |
F 8 |
0,28478 |
1,24475 |
0,45955 |
0,25819 |
F 9 |
0,14422 |
1,29880 |
0,18366 |
0,12728 |
F 10 |
0,26003 |
2,07540 |
0,14791 |
0,24296 |
F 11 |
0,57010 |
0,75739 |
0,10018 |
0,26959 |
MC=margin of contribution; PRLV=productivity of sales net revenue; RCT=return on equity; ROA=return on asset.
In a preliminary way the data in Table 2 already show that the firm F10, followed by the firms F3, F5, F9, F7 and F8, F4 and F1, are the most productive, with PRLV higher than 1, showing that the revenue produced by the firm In each year is higher than the value of the investment. But F11 is the one with the highest MC, related to the lower PRLV, lower return on equity, and higher ROA. Thus, even preliminarily, the data show that the highest ROA is associated with the highest MC and the lowest RCT, but is contrary to the expectation that higher PRLV would imply higher MC. Firm F1 associates the 2nd lowest MC with the lowest ROA and the 8th highest PRLV, corroborating the evidence presented by the F11 firm that higher / lower MC would imply higher / lower ROA, regardless of PRLV. It is also observed that the ROA, in the extension of the aggregate data of the sample, varies between 9,198% and 26,959%, resulting in an average rate of around 20.353%, lower than the average RCT of 21.524%, ranging from 0, 10018 to 0.45955, showing that in this business segment the cost of equity, on average, is higher than the cost of equity. But individually, firms F4, F6, F7, F10 and F11 have higher ROA than RCT.
It is also important to note that firms F7 and F8, respectively DMU7 and DMU8, have the same MC, PRLV and ROA. This situation suggests inconsistency in the data managed by the repository, but at the level of this research there are no procedures that can be used to detect this probable anomaly.
In this section we analyze the descriptive statistics estimators, the coefficients of the correlation matrix, the results produced by the nonparametric (DEA) and parametric models (multivariate linear regression). The results are obtained from the variables generated by the models defined in subsections 3.2; 3.3 and 3.4, applied to the individual and medium sample data, as described in subsection 3.5. The non-parametric tests are run with the variables in the level to obtain the efficiency effect of the use of the inputs, and the parametric test is run with the variations of a period for all the variables, or first difference, so that the effect is mitigated accounting balances.
Table 3 shows the descriptive statistics estimators of the variables of interest of the survey, where the dispersion of the distribution is less than 1/2 standard deviation of the mean in the data of the variables MC, PRLV and ROA, and slightly more than 1 standard deviation of the Mean (1.017) in the data of the RCT variable, as shown by the coefficient of variation estimator. This result indicates that the scattering of the sample data is relatively moderate, which can be confirmed by observing the amplitude between the minimum and maximum limits of each variable. For the variables MC, PRLV and RCT, more than half of the observations are located below the mean, while for the variable ROA the position is opposite, that is, the average is placed in the first half of the data, as shown in the comparison of the estimators Of the average and median. However, because the statistical test of Table 3 used the 121 observations per variable (and not only the average sample size), the minimum and maximum values of the aforementioned Table 3 are smaller / larger than those shown in Table 2. However, , At this stage of data analysis it is still not possible to infer that the minima / maxima of all variables are linked to the same firm (DMU), which will be identified later in the analysis of the DEA model results in Table 7.
Table 3: Descriptive statistics of the 121 observations per variable of interest of the survey
of the 11 firms in the sample of the electric power business in Brazil from 2003 to 2013
Estimators |
MC |
PRLV |
RCT |
ROA |
Mean |
0,29796 |
1,22539 |
0,21524 |
0,20353 |
Median |
0,27956 |
1,08016 |
0,16314 |
0,20706 |
Standard deviation |
0,13244 |
0,58939 |
0,21892 |
0,09503 |
Coefficient of variation |
0,44450 |
0,48098 |
1,01707 |
0,46690 |
Minimum |
0,00594 |
0,42809 |
0,01237 |
0,00555 |
Maximum |
0,72227 |
3,28009 |
1,72524 |
0,42752 |
Score |
121 |
121 |
121 |
121 |
MC=margin of contribution; PRLV=productivity of net sales revenue;
RCT=return on equity; ROA=return on assets.
Table 4 shows the coefficients of the correlation matrix of the 121 observations of each variable of interest of the research. The test responses reveal that: (1) CM is directly related to PRLV and ROA, but to inverse information with RCT. This behavior is what one might expect considering that the investment in the business, for an installed capacity sized for a certain time interval and production level, is constant and this causes higher revenue to produce higher MC and higher ROA. Conversely, higher RCT produces lower MC considering that part of this RCT is cost of production of revenue. But even though the relationship between MC and PRLV is direct it would be expected to be more intense since 1.739% is close to an independence relation (orthogonality); (2) PRLV shows positive association with ROA and negative association with RCT. These relationships are expected considering that the more revenue the investment produces, the higher the return on investment should occur, and a higher equity cost impacts lower productivity; (3) the ROA is inversely associated with the RCT. This relationship is also expected considering that, on average, the RCT is higher than the ROA, as revealed by the analysis of the sample data (subsection 3.5), signaling that the direction of movement of the two variables would be opposite.
Table 4: Coefficients of the correlation matrix of the 121 observations per
variable in interest of this research concerning the 11 sample firms in
the electric power business in Brazil from 2003 to 2013
Estimators |
MC |
PRLV |
ROA |
RCT |
MC |
1 |
|||
PRLV |
0,01739 |
1 |
||
ROA |
0,66384 |
0,25186 |
1 |
|
RCT |
-0,14057 |
-0,03795 |
-0,19086 |
1 |
MC=margin of contribution; PRLV=productivity of net sales revenue;
RCT=return on equity; ROA=return on assets.
The results obtained with the nonparametric model, presented in Table 5, show rank and score of efficiency by firm of the sample, oriented to the result (output), with constant returns and variable of scale, based on the averages of each variable. The firms with score 1 are located on the stochastic efficiency frontier curve in the first position of rank (rank 1) and those with a score of less than 1 are inefficient and are placed below the curve, as shown by Melo; Meza; Gomes and Neto (2005), for producing lower return on assets with the same inputs available (MC, PRLV, RCT), corroborating the findings of Tannuri-Pianto et al. (2009). Table 5 shows in the information block on the left side the performance with variable return of scale (BCC) and on the right side the performance with constant return of scale (CCR). From the 11 firms of the sample, on average, efficiency with variable return of scale (BCC) was found in 8 because they showed a score equal to 1, that is, higher ROA (DMU1 with Score 0.999988 equals 1). When the return scale is constant (CCR), of the 11 firms only 4 confirm efficiency. Thus, firms 2, 9 and 6 (DMU2, DMU9 and DMU6) classified with rank 1 with variable return of scale (efficient), when the scale return is constant, the rank is less than 1 (inefficient), not touching the curve Frontier of efficiency. This rank change signals a benchmark change in which the ROA level of one model is higher / lower than the ROA level of the other model. In this context, according to the scores shown, firms 5, 4 and 3 (DMU5, DMU4 and DMU3) are not efficient in any of the forms of scale return. The measure of inefficiency suggests that firms could obtain higher ROA with the same inputs (MC, PRLV, RTC) they have, since efficiency, in a diffuse way, is to increase the level of production by maintaining the quantities of input or maintaining the level of production reducing the amount of inputs. Thus, DEA scores suggest that the level of inefficiency, relative to the DMU benchmark, increases as these scores are less than 1.
Table 5: Rank and score of the mean of 121 annual observations per variable
of the 11 firms (DMUs) of the 2003- 2013 sample run on a DEA
model targeting results (output)
Variable scale return (BCC) targeting production (output) |
Constant scale return (CCR) targeting production (output) |
||||
Rank |
DMU |
Score |
Rank |
DMU |
Score |
1 |
DMU11 |
1 |
1 |
DMU11_M |
1 |
1 |
DMU10 |
1 |
1 |
DMU10_M |
1 |
1 |
DMU2 |
1 |
1 |
DMU8_M |
1 |
1 |
DMU9 |
1 |
1 |
DMU7_M |
1 |
1 |
DMU8 |
1 |
5 |
DMU2_M |
0,98973268 |
1 |
DMU7 |
1 |
6 |
DMU9_M |
0,944533457 |
1 |
DMU6 |
1 |
7 |
DMU6_M |
0,909374276 |
8 |
DMU1 |
0,999884322 |
8 |
DMU4_M |
0,884463978 |
9 |
DMU5 |
0,930380567 |
9 |
DMU5_M |
0,829519781 |
10 |
DMU4 |
0,885758491 |
10 |
DMU1_M |
0,589258924 |
11 |
DMU3 |
0,535714495 |
11 |
DMU3_M |
0,527501679 |
DMU=sample firms; Rank=order of classification according to efficiency;
Score=level of efficiency; BCC=methodology with variable scale returns;
CCR=methodology with constant scale returns.
Table 6, which also presents results of the non-parametric model, shows the performance for each DMU / year, with constant return of scale (CCR) and variable return of scale (BCC) from 2003 to 2013. Unlike Table 5 above , Which shows the unique performance by DMU as a function of the means of the variables, Table 6 allows to observe how the performance of each firm / DMU behaves throughout the series, maintaining or alternating efficiency / inefficiency. The scores of each firm DMU_CCR and DMU_BCC in each year are in function of ROA weighted by the weights of the input / output variables defined in the models of functions 9 and 10 of the previous subsection 3.3. Due to these weights, DMUs that present themselves on the curve (efficient) when the test uses the average of the sample period, may not be efficient for the entire sample period when the test is individual. As an example, when the test is run with the averages (Table 5), DMUs 2, 6, 7, 8, 9, 10 and 11 are efficient with variable return scaling, and DMUs 7, 8, 10 and 11 are efficient With constant return of scale, but when the test is run individually, only the DMU7 and DMU9 remain on the efficient boundary curve with varying returns returns throughout the sample. The others alternate between efficiency / inefficiency.
This paradigm shift or benchmark signals that the results obtained with the test run by DMU / year provide better performance / efficiency visibility than when run with the averages. However, when the comparison between the test results is to identify the most inefficient DMU, there is no difference between them, with DMU3 being inefficient in the two ways in which the test was run, with constant and variable scale.
Table 6: Individual DMU / year (electric power firms in Brazil) from 2003 to 2013
with the application of the theoretical model of the DEA in the perspectives of constant
return of scale (CCR) and variable return of scale
Firma/DMU |
2003 |
2004 |
2005 |
2006 |
2007 |
2008 |
2009 |
2010 |
2011 |
2012 |
2013 |
DMU1_CCR |
0,7880 |
0,8623 |
0,0670 |
0,3268 |
0,3268 |
0,4359 |
0,4427 |
0,4673 |
0,8995 |
1 |
0,9059 |
DMU1_BCC |
0,7881 |
1 |
0,9993 |
0,3435 |
0,3435 |
0,4603 |
0,4692 |
1 |
1 |
1 |
1 |
DMU2_CCR |
1 |
0,9908 |
0,7561 |
0,9558 |
0,9558 |
1 |
1 |
0,9584 |
0,8315 |
0,6959 |
1 |
DMU2_BCC |
1 |
1 |
1 |
1 |
1 |
1 |
1 |
1 |
0,8744 |
0,7037 |
1 |
DMU3_CCR |
0,8936 |
0,5255 |
0,4014 |
0,5187 |
0,5187 |
0,6313 |
0,6219 |
0,5202 |
0,4651 |
0,1224 |
0,4367 |
DMU3_BCC |
0,9248 |
0,5291 |
0,4181 |
0,9997 |
0,9997 |
0,6523 |
0,7277 |
0,6163 |
0,4859 |
0,1534 |
0,4380 |
DMU4_CCR |
0,9271 |
0,7243 |
0,9186 |
0,9634 |
0,9634 |
1 |
0,9343 |
0,8431 |
0,6263 |
0,7923 |
0,6261 |
DMU4_BCC |
0,9436 |
0,7262 |
1 |
0,9635 |
0,9635 |
1 |
1 |
0,8804 |
0,7523 |
1 |
0,7683 |
DMU5_CCR |
0,8256 |
0,8149 |
0,7921 |
0,8475 |
0,8475 |
0,8435 |
0,7676 |
0,8246 |
0,5878 |
0,6903 |
0,5180 |
DMU5_BCC |
1 |
0,8430 |
0,8406 |
0,8479 |
0,8479 |
0,9283 |
1 |
0,8706 |
0,7573 |
0,9386 |
0,5805 |
DMU6_CCR |
0,5931 |
0,3741 |
0,5224 |
0,8986 |
0,8986 |
0,9848 |
0,7199 |
1 |
1 |
1 |
0,7564 |
DMU6_BCC |
0,6153 |
0,9999 |
0,6353 |
0,9100 |
0,9100 |
1 |
0,7627 |
1 |
1 |
1 |
1 |
DMU7_CCR |
0,8589 |
1 |
1 |
1 |
1 |
1 |
1 |
1 |
1 |
1 |
0,8845 |
DMU7_BCC |
1 |
1 |
1 |
1 |
1 |
1 |
1 |
1 |
1 |
1 |
1 |
DMU8_CCR |
0,8589 |
1 |
1 |
1 |
1 |
1 |
0,9910 |
0,9906 |
0,8784 |
0,9162 |
0,8845 |
DMU8_BCC |
1 |
1 |
1 |
1 |
1 |
1 |
0,9995 |
0,9975 |
1 |
0,9658 |
1 |
DMU9_CCR |
1 |
1 |
0,9053 |
0,9424 |
0,9424 |
0,7999 |
0,8303 |
0,8735 |
1 |
1 |
1 |
DMU9_BCC |
1 |
1 |
1 |
1 |
1 |
1 |
1 |
1 |
1 |
1 |
1 |
DMU10_CCR |
0,3555 |
0,8894 |
0,8665 |
1 |
1 |
1 |
1 |
1 |
0,9231 |
0,9302 |
1 |
DMU10_BCC |
0,3869 |
1 |
1 |
1 |
1 |
1 |
1 |
1 |
1 |
0,9765 |
1 |
DMU11_CCR |
1 |
1 |
1 |
1 |
1 |
1 |
1 |
1 |
0,8126 |
1 |
1 |
DMU11_BCC |
1 |
1 |
1 |
1 |
1 |
1 |
1 |
1 |
0,9270 |
1 |
1 |
DMU=decision maker unit (firm); CCR=model with constant scale return; BCC=model with variable scale return.
Table 7 below shows the needs for adjustments in the average performance in the input variables or inputs (MC, PRLV, RCT) and the output variable or product (ROA) to make the DMU efficient in BCC models And CCR. For any DMU with Score equal to (1,000) in both models, the data of the input and output variables in the Score and Projec columns do not change because the DMU reached the efficiency level. However, when the DMU Score is greater than 1 (> 1,000), the data in the Projec column differs from the Score column data, signaling the need for adjustments to make the DMU efficient. In this way, the performance in the BCC model shows that of the 11 DMUs 8 are efficient, displaying Equal Score (1,000) with the data of the same input and output variables in the Score and Projec columns, indicating that at the levels of installed capacity and technology used these DMUs Are at the optimal level of production efficiency. In the CCR model, of the 11 DMUs only 3 are efficient, reversing the position with the BCC model in which only 3 are inefficient.
Observing the Score column coefficient at the intersection with the DMU line, the signaling is that with the available inputs, the production of the inefficient DMU should have been higher, equivalent to the one that produced more than the Score (> 1,000) to satisfy a Of efficiency concepts that is to produce more, keeping the inputs constant. Now looking at the data in the Projec column, at the intersection with the line of each input and output variable, they suggest that the inefficient DMU would achieve efficiency with an equal score (1,000) if the data were adjusted to the levels of said column. In this context, the output variable ROA would be added to the equivalent of the percentage that exceeded the Score (1,000) for any of the two models, and the input variables would be reduced to satisfy the other concept of efficiency that would maintain the production level with smaller amount of inputs. These two concepts can be verified by reading the data in Table 7, in which for all inefficient DMUs the coefficient of the intersection cell of the Score column with the DMU line is greater than (1,000); In the Projec column the ROA (product) level is higher than in the Score column and at least one input (MC, PRLV, RCT) in the Projec column is smaller than in the Score column, and that input, for the sample data, Is the RCT that in the Projec column is smaller than the Score column for all inefficient DMUs. Thus, in average terms, the minimum and maximum of each variable are associated to different DMUs.
Table 7: Input projection for adjustment of the average performance per firm (DMU)
of electric power in Brazil from 2003 to 2013 with the application of the theoretical model
of the DEA in the visions of constant return of scale (CCR) and variable return of scale (BCC ):
|
Performance in BCC model targeting output | Performance in CCR targeting output |
|||||||||
DMU |
Score |
Projec |
DMU |
Score |
Projec |
DMU |
Score |
Projec |
DMU |
Score |
Projec |
DMU1 |
1,000 |
|
DMU7 |
1,000 |
|
DMU1 |
1,697 |
|
DMU7 |
1,000 |
|
MC |
0,170 |
0,170 |
MC |
0,285 |
0,285 |
MC |
0,170 |
0,170 |
MC |
0,285 |
0,285 |
PRLV |
1,043 |
1,043 |
PRLV |
1,245 |
1,245 |
PRLV |
1,043 |
1,043 |
PRLV |
1,245 |
1,245 |
RCT |
0,272 |
0,272 |
RCT |
0,178 |
0,178 |
RCT |
0,272 |
0,101 |
RCT |
0,178 |
0,178 |
ROA |
0,092 |
0,092 |
ROA |
0,258 |
0,258 |
ROA |
0,092 |
0,156 |
ROA |
0,258 |
0,258 |
DMU2 |
1,000 |
|
DMU8 |
1,000 |
|
DMU2 |
1,010 |
|
DMU8 |
1,000 |
|
MC |
0,216 |
0,216 |
MC |
0,285 |
0,285 |
MC |
0,216 |
0,216 |
MC |
0,285 |
0,285 |
PRLV |
0,884 |
0,884 |
PRLV |
1,245 |
1,245 |
PRLV |
0,884 |
0,884 |
PRLV |
1,245 |
1,245 |
RCT |
0,232 |
0,232 |
RCT |
0,460 |
0,178 |
RCT |
0,232 |
0,126 |
RCT |
0,460 |
0,178 |
ROA |
0,185 |
0,185 |
ROA |
0,258 |
0,258 |
ROA |
0,185 |
0,187 |
ROA |
0,258 |
0,258 |
DMU3 |
1,867 |
|
DMU9 |
1,000 |
|
DMU3 |
1,896 |
|
DMU9 |
1,059 |
|
MC |
0,285 |
0,285 |
MC |
0,144 |
0,144 |
MC |
0,285 |
0,285 |
MC |
0,144 |
0,144 |
PRLV |
1,666 |
1,294 |
PRLV |
1,299 |
1,299 |
PRLV |
1,666 |
1,666 |
PRLV |
1,299 |
1,151 |
RCT |
0,175 |
0,175 |
RCT |
0,184 |
0,184 |
RCT |
0,175 |
0,171 |
RCT |
0,184 |
0,082 |
ROA |
0,138 |
0,257 |
ROA |
0,127 |
0,127 |
ROA |
0,138 |
0,261 |
ROA |
0,127 |
0,135 |
DMU4 |
1,129 |
|
DMU10 |
1,000 |
|
DMU4 |
1,131 |
|
DMU10 |
1,000 |
|
MC |
0,400 |
0,400 |
MC |
0,260 |
0,260 |
MC |
0,400 |
0,400 |
MC |
0,260 |
0,260 |
PRLV |
1,051 |
1,048 |
PRLV |
2,075 |
2,075 |
PRLV |
1,051 |
1,051 |
PRLV |
2,075 |
2,075 |
RCT |
0,155 |
0,146 |
RCT |
0,148 |
0,148 |
RCT |
0,155 |
0,147 |
RCT |
0,148 |
0,148 |
ROA |
0,233 |
0,263 |
ROA |
0,243 |
0,243 |
ROA |
0,233 |
0,263 |
ROA |
0,243 |
0,243 |
DMU5 |
1,075 |
|
DMU11 |
1,000 |
|
DMU5 |
1,206 |
|
DMU11 |
1,000 |
|
MC |
0,380 |
0,380 |
MC |
0,570 |
0,570 |
MC |
0,380 |
0,380 |
MC |
0,570 |
0,570 |
PRLV |
1,305 |
1,082 |
PRLV |
0,757 |
0,757 |
PRLV |
1,305 |
1,305 |
PRLV |
0,757 |
0,757 |
RCT |
0,282 |
0,152 |
RCT |
0,100 |
0,100 |
RCT |
0,282 |
0,185 |
RCT |
0,100 |
0,100 |
ROA |
0,244 |
0,262 |
ROA |
0,270 |
0,270 |
ROA |
0,244 |
0,294 |
ROA |
0,270 |
0,270 |
DMU6 |
1,000 |
|
DMU6 |
1,099 |
|
||||||
MC |
0,283 |
0,283 |
MC |
0,283 |
0,283 |
||||||
PRLV |
0,909 |
0,909 |
PRLV |
0,909 |
0,909 |
||||||
RCT |
0,182 |
0,182 |
RCT |
0,182 |
0,128 |
||||||
ROA |
0,191 |
0,191 |
ROA |
0,191 |
0,210 |
||||||
MC=margin of contribution; PRLV=productivity of net sales revenue; RCT=return on equity;
ROA=return on assets; DMU=decision maker unit (firm); CCR=model with constant scale return;
BCC=model with variable scale return; Score = data of variables and of DMU;
Projec = data projected for efficiency of inefficient DMU.
After analyzing the non-parametric model based on the data in Tables 5 to 7 above, the research analyzes the responses of the parametric model presented in Table 8 below. The results of the multivariate linear regression of the ROA variable against the MC, PRLV and RCT variables were the first, with the first difference, with data in a balanced panel with random effects, of the 121 annualized observations of the eleven firms of the electric power business in Brazil, From 2003 to 2013. The data in first difference, because they are variations, have the motivation to mitigate the effect simultaneity of the absolute values of the accounting variables, and the Random Effect because it better reports the results of the tests. The basic tests of variance and serial autocorrelation of the residuals, necessary for the validation of the model, use the Breusch-Pagan and Hausman statistics, respectively. The Hausman statistic that tests the autocorrelation of the residuals presents a score lower than the values statistically significant of 10%, 5% and 1%, (a=0,1; a=0,05; a=0,01), signaling the absence of autocorrelation. The Breusch-Pagan statistic that tests the variance of the errors is less than the critical value at the 1% significance level, (a=0,01), pointing the absence of heteroscedasticity.
The statistical significance of the tests suggests that, with 90% and 95% confidence, for each variation of 1% in the estimator of the MC variable the ROA is increased 26.86%. Regarding the PRLV and RCT variables, statistical significance was not found, however, the signs of the estimators are in agreement with expected, since the increase in MC and PRLV implies an increase in ROA and an increase in the RCT has an impact on ROA reduction. significância estatística dos testes sugere que, com confiança de 90% e 95%, para cada variação de 1% no estimador da variável MC o ROA é incrementado 26,86%.
To test the multicollinearity of the variables, the variance inflation factor (FIV) was used. The results are less than 10 (implicit), indicating the lack of multicollinearity among the explanatory variables of the model.
Table 8: Random effects (GLS), using 110 observations from the 121 observations of
the sample of 11 firms of the electric power business in Brazil from 2003 to 2013
Dependent variable: d_ROA
Estimators |
Coefficiente |
Standard Error |
Statistics-t |
value p |
|
Const |
0.004615 |
0.009204 |
0.5014 |
0.6171 |
|
d_MC |
0.268625 |
0.132908 |
2.0211 |
0.0458 |
** |
d_PRLV |
0.005755 |
0.009291 |
0.6194 |
0.5370 |
|
d_RCT |
-0.000297 |
0.025978 |
-0.0114 |
0.9909 |
|
Breusch-Pagan Test: |
5.6595 |
* |
Hausman Test: |
0.2234 |
*** |
MC=margin of contribution; PRLV=productivity of net sales revenue;
RCT=return on equity; ROA=return on assets.
In summary, the DEA approach suggests that the firm performs on average when MC is associated with higher ROA and lower RCT, as shown in Table 7, as confirmed by the parametric test result presented in Table 8. But these results differ from the findings of Halkos and Salamouris (2004) who found evidence that the efficiency of Greek banks is associated with higher asset value.
The parametric approach indicates that the tested variables show signs according to the expected, considering the direct relationship between MC and PRLV with ROA, as well as the indirect relationship between ROA and RCT. Because of these relationships, an increase in PRLV and MC implies an increase in ROA, and conversely, an increase in the TCR impacts a reduction in ROA. With these results the hypothesis tests indicate that the ROA strongly depends on the MC and the statistical significance of the PRLV cannot be explained by the fact that the MC depends on the net sales revenue, confirming the signs of the analysis of the sample description in which the larger ROA is associated with the highest MC and the lowest RCT.
The main motivation of this research is to analyze the performance of electric power companies in Brazil, in the view of efficiency of the return of assets, in the period in which frequent interruptions occur in the supply of electric power, provoking disruption to society and to the Brazilian economy. parents. The data were extracted from the standardized financial statements of a sample of 11 firms, from 2003 to 2013, totaling 121 observations per variable of interest of the research. The accounting variables derived from the standardized financial statements were total assets, current liabilities, loans and financing debts, net income, shareholders' equity, financial expenses, direct taxes on profit, net sales revenue, cost of goods sold and property, plant and equipment.
The variables of interest of the research, non-stochastic, calculated from the accounting variables are MC, PRLV, RCT, and ROA. The methodology is positivist and uses non-parametric, DEA, and parametric models, multivariate linear regression, to investigate the efficiency / inefficiency of electric power business firms in Brazil. The DEA method was used in the production-oriented view (output) and in the modalities of constant return of scale (CCR) and variable return of scale (BCC). The findings of the research reveal that:
Based on the results revealed, it is believed that the research contributes significantly to the literature of the segment, with the possibility that subsequent research may explore whether there is any factual connection between the return on investments and the frequent interruptions in the supply of electricity in Brazil and that the research differs from the others because it brings evidence that the association of return variables with performance variables, non-parametric and parametric methods, shows that a firm is efficient in the combination of factors of production.
BANKER, R.D.; CHARNES, A.; COOPER, W.W. (1984.) Some models for estimating technical scale inefficiencies in data envelopment analysis. Management Science, v. 30, n. 9, p. 1078-109.
BECCALLI, Elena/ CASU, Barbara/ GIRARDONE, Claudia. (2006). Efficiency and stock performance in european banking. Journal of Business Finance & Accounting. n. 33(1) & 2, pp. 245-262.
BERGER, A. N.; HUMPHREY, D.B. (1992). Megamergers in banking and the use of cost efficiency as an antitrusti defence. Antitrust Bulletin. v. 33, pp. 541-600.
CANZIAN, F. (2015). Nos EUA, blecaute em 2003 durou mais de 90 horas. Folha de São Paulo, São Paulo, Nov, 13, 2009. Available at: http://www1.folha.uol.com.br/fsp/cotidian/ff1311200923.htm. Last access on: 21 Aug, 2015.
CHARNES, A.; COOPER, W.W.; RHODES, E. (1978). Measuring the efficiency of decision-making units. European Journal of Operational Research, v. 2, p. 429-444.
COASE, R.H. (1937). The Nature of the Firm. Economica, v.4, n.16, p.386-405, Nov.
DE FRANÇA, J.A.; LUSTOSA, P.R.B. (2011). Efficiency and operating leverage under perfect competition: reconciling the approches of economics and accounting. Contabilide Gestão e Governança, v.14, n.3, p.60-76, Sept/Dec.
FARRELL, M.J. (1957). The Measurement of Productive Efficiency. Journal of the Royal Statistical Society. Series A (General), v.120, n.3.
HALKOS, George E.; Salamouris, Dimitrios S. (2004). Efficiency measurement of the Greek commercial banks with the use of financial ratios: a data envelopment analysis appDAch. Management Accounting Research. n. 15, pp. 201-224.
HIROTA, H. H. (2015). O mercado de concessão de transmissão de energia elétrica no Brasil. Dissertação (Mestrado em Economia Aplicada) - Faculdade de Economia, Administração e Contabilidade de Ribeirão Preto,Universidade de São Paulo, 2006. Available at: <http://www.teses.usp.br/teses/disponiveis/96/96131/tde-26042007-114337/>. Last access on: 21 Aug 2015.
HODGIN, R.; KIYMAZ, H. (2005). Extending the Profit Elasticity Measure of Operating Leverage. In: Managerial Economics Texts. Journal of Economics and Economic Research, v. 6, n.3.
JORGENSEN, B. N.; SADKA, G.; LI, J. Capacity Constraints, Proft Margins and Stock Returns. Available at:<http://papers.ssrn.com:80/sol3/cf_dev/AbsByAuth.cfm?per_id=62431>. Last access on: 10 ago 2015.
JOSKOW, P. L. (2003). Electricity sector restructuring and competition: lessons learned. Cuadernos de Economia, 40(121).
KALDOR, N. (1934).The Equilibrium of the Firm. The economic journal, v. 44, n. 173, mar/1934.
KNIGHT, F.H. (1921). Risck, Uncertainty and Profit. Boston; Cambridge, 1921.
LOVELL, C.A. K. (1992). The Measurement of productive efficiency: techniques and Applications; Production Frontiers and Productive Efficiency. Oxord: Forthcoming, 1992.
MELO, J.C.C.B.S.; MEZA, L.A.; GOMES, E.B.; NETO, L.B. (2005). Curso de análise de envoltória de dados. XXXVII simpósio brasileiro de pesquisa operacional (SBPO), Gramado, 2005. Available at: http://www.uff.br/decisao/sbpo2005_curso.pdf. Last access on: 10 set 2015.
TANNURI-PIANTO, M. E.; SOUSA, M. C. S. ; ARCOVERDE, F. D. (2009). Fronteiras de Eficiência Estocásticas para as Empresas de Distribuição de Energia Elétrica no Brasil: Uma Análise de Dados de Painel. Est. Econ., São Paulo, v. 39, n. 1, p. 221-247.
VAN HORNE, J.C; WACHOWICH, J.M. (2008). Funtamentals of Financial Management.13.ed. London. Prentice Hall.
1. Doutor em Ciências Contábeis pela Universidade de Brasília (UnB) Doutorando em Ciências Econômicas pela Universidade Católica de Brasília (UCB) Professor Adjunto do Departamento de Ciências Contábeis e Atuariais da Universidade de Brasília – UnB - BRASIL. Email: franca@itecon.com.br
2. Doutor Em Ciências Econômicas Professor do Departamento de Ciências Econômicas da Universidade Católica De Brasília (UCB)