![]() ISSN 0798 1015
ISSN 0798 1015

![]() ISSN 0798 1015
ISSN 0798 1015
Vol. 38 (Nº 31) Año 2017. Pág. 19
CANO, Jose A. 1; VERGARA, José J. 2; PUERTA, Fabio A. 3
Recibido: 23/01/2017 • Aprobado: 12/02/2017
2. Design of a Balanced Scorecard
3. Results and discussion (BSC implementation)
ABSTRACT: This article presents the design and implementation of a Balanced Scorecard (BSC) in a medium-sized company in Colombia, providing synthetic indicators for objectives, perspectives and business strategies through key performance indicators (KPIs) and a hierarchical weighting method. The BSC combines the subjectivity in assigning weights to KPIs, objectives and perspectives, with the objectivity in the quantitative method of normalization and aggregation of indicators, facilitating SMEs monitoring the achievement of goals, support decision-making and implement action plans to achieve business goals. |
RESUMEN: Este artículo presenta el diseño e implementación de un Balanced Scorecard (BSC) en una PYME en Colombia, generando indicadores sintéticos para objetivos, perspectivas y estrategias a través de indicadores clave de desempeño (KPIs) y un método de ponderación jerárquica. El BSC combina la subjetividad en la ponderación de KPIs, objetivos y perspectivas, y la objetividad en la agregación de indicadores, facilitando en las PYMEs el monitoreo de metas, la toma de decisiones y la generación planes de acción. Palabras clave or |

BSC is a management approach for the implementation, adaptation and alignment of strategies, that classifies the vision and strategy of the enterprise into customer, financial, internal processes, learning and growth perspectives. (Kaplan and Norton, 2004; Papalexandris et al., 2004; Kaplan et al., 2010). BSC integrates a coherent set of financial and non-financial indicators in order to obtain an effective management system focused on results, and explain the interdependencies between its elements through cause-effect relationships and strategic maps (Bento et al., 2014; Korontai et al., 2016).
BSC is defined as a strong method for planning, developing and transforming the strategy (Ayvaz and Pehlivanlt, 2011), which has generated success in large companies, as wells as in small and medium enterprises (SMEs) (Rodrigues et al., 2014). Even Martello et al. (2008), Aidemark (2010), Lin et al. (2014), and Gao and Gurd (2015) report successful BSC implementations in healthcare systems, hospitals and nonprofit organizations, explaining that BSC provides a suitable control system that contributes to the improvement of organizational and personal performance.
Other authors such as Papalexandris et al. (2004) have implemented a BSC model to at a large software development company in Greece; Ortiz and Cortez (2013) and Millan et al. (2015) have applied a BSC at Venezuelan companies; Pessoa (2015) and Korontai et al. (2016) conducted study cases in Brazil at a micro-enterprise and at a business incubator respectively. These studies corroborate the applicability of BSC to any type of business, including those located in developing countries; reinforcing the idea that BSC has been widely accepted and successfully implemented in public and private organizations (Mendes et al., 2012), as well as in companies of different sizes, including SMEs (Machado, 2013).
On the other hand, BSC can be used together with decision-making methods, cognitive mapping and related techniques, and bonus systems in order to provide an effective and fair strategic decision support process (Ayvaz and Pehlivanlt, 2011; Gao and Gurd, 2015; Pessoa, 2015). Accordingly, the implementation and operation of the BSC is widely known, and its academic concepts, evolution, scope and usefulness are of special interest to multiple authors (Coe and Letza, 2014; Kaplan and Norton, 2004; Machado, 2013; Rodrigues et al., 2014); to the point of obtaining fourth generation BSC systems that adjust and adapt the basic BSC to the new organizations realities. BSC is easy to understand due to the initial breakdown of the strategy from four perspectives, which allow translating the strategy into operational terms, up to the point of turning strategies into tasks and commitments of the whole staff of the company (Kaplan and Norton, 2004).
Due to the characteristics of the BSC, the following section of the article explains the design and implementation of a Balanced Scorecard in a medium-sized company in Colombia, highlighting a hierarchical weighting method to create synthetic indicators for objectives, perspectives and business strategies. The third section discusses the results and managerial implications of the study. Finally, the article shows the most relevant conclusions.
The company in which will be designed and implemented a BSC, is an SME with 12 years of existence, has 45 direct employees, 10 subcontracted employees and is dedicated to the transport of stony aggregates, located in the city of Cartagena, Colombia. In this company is evident the absence of harmony among institutional objectives, the strategic direction and the real needs of the company. In addition to this, the company does not have methods or competitive managerial systems that guide its entire staff to the achievement and attainment of the strategic goals. For these reasons, it is necessary to design and implement a BSC, to align, disseminate and comply the business strategy.
Figure 1 shows the basic structure of the BSC to apply in the company under study. This structure departs from the strategy as an essential part, supporting it on financial, customer, internal processes, and learning and growth perspectives (Kaplan et al., 2010). In turn, each perspective has a certain amount of strategic objectives measured by key performance indicators (KPIs).
Figure 1. Basic structure of the proposed Balanced Scorecard
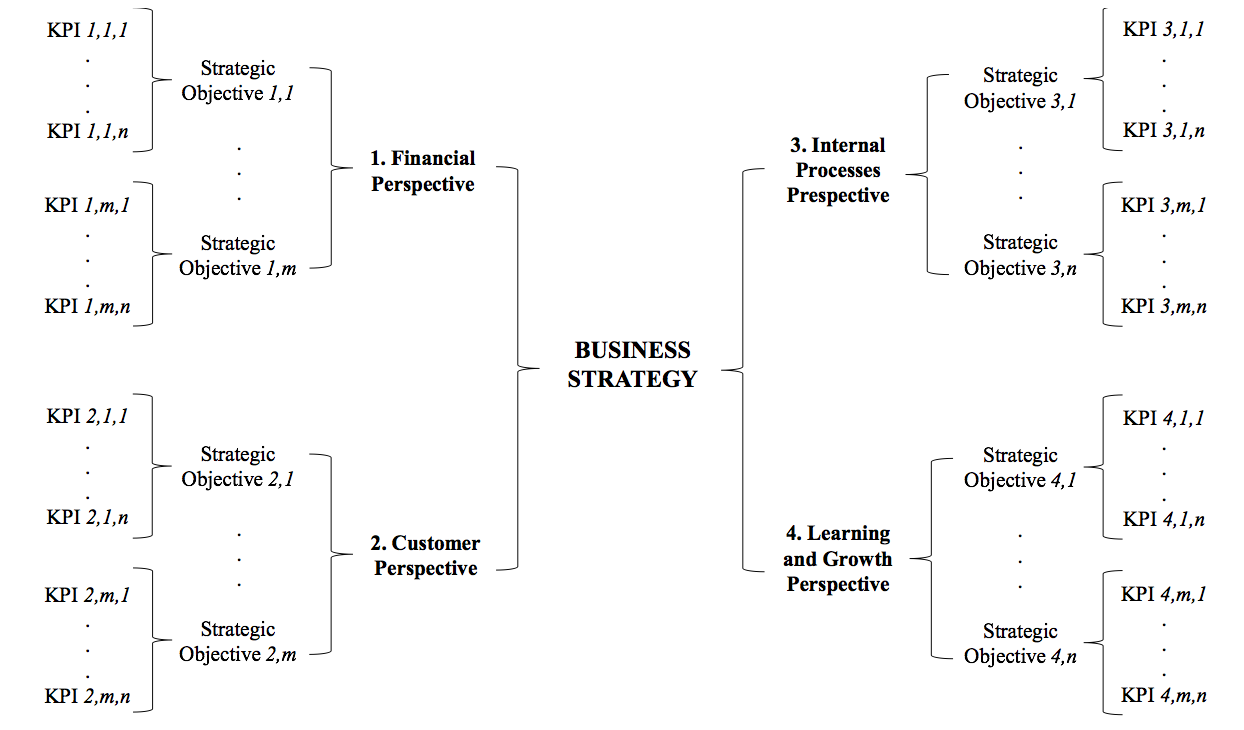
Source: Authors
Based on Neely et al. (2000), Kaplan and Norton (2004), Kaplan and Norton (2007), Kaplan et al. (2010), and Coe and Letza (2014), the methodology to implement and execute a BSC in the company under study are determined, as shown in Figure 2. These stages represent the deployment of the business strategy in the BSC and includes the synthesis of the strategy and a strategic map where the objectives of each perspective are interrelated. Figure 2 also shows a measurement matrix that includes KPI and aggregate indicators for the objectives, perspectives and business strategy. Likewise, the measurement matrix is updated with business information, which should be consistent, relevant, regular and accurate, to assure continuity and credibility in the BSC. The action plans complement the measurement matrix, developing action plans according to the results of the indicators. In this way, the design and deployment of BSC arise from the overall strategy and is broken down to generate the input requirements of business information.
Figure 2. Stages of deployment and evaluation of a BSC

Source: Authors
Figure 2 states that the sequence of stages to measure the goals' fulfillment and the execution of business strategy in the BSC, begins with the entry of input data, with which KPIs and aggregate KPIs are calculated. Therefore, depending on the values of the KPIs, the methodology generates action plans to ensure strategic objectives’ fulfillment. Consequently, the strategic performance measurement is performed from the specific information (input data and indicators), reaching overall results of the organization through a hierarchical aggregation of indicators. In this sense, the BSC clearly states that the four perspectives synthesize the business strategy. Objectives are set for each perspective, and the different objectives relate to each other in a strategic map. Figure 3 shows the strategic map developed for the company under study, describing the relationship between the objectives that begin from the learning and growth perspective.
Figure 3. Strategic map and relations between objectives and perspectives
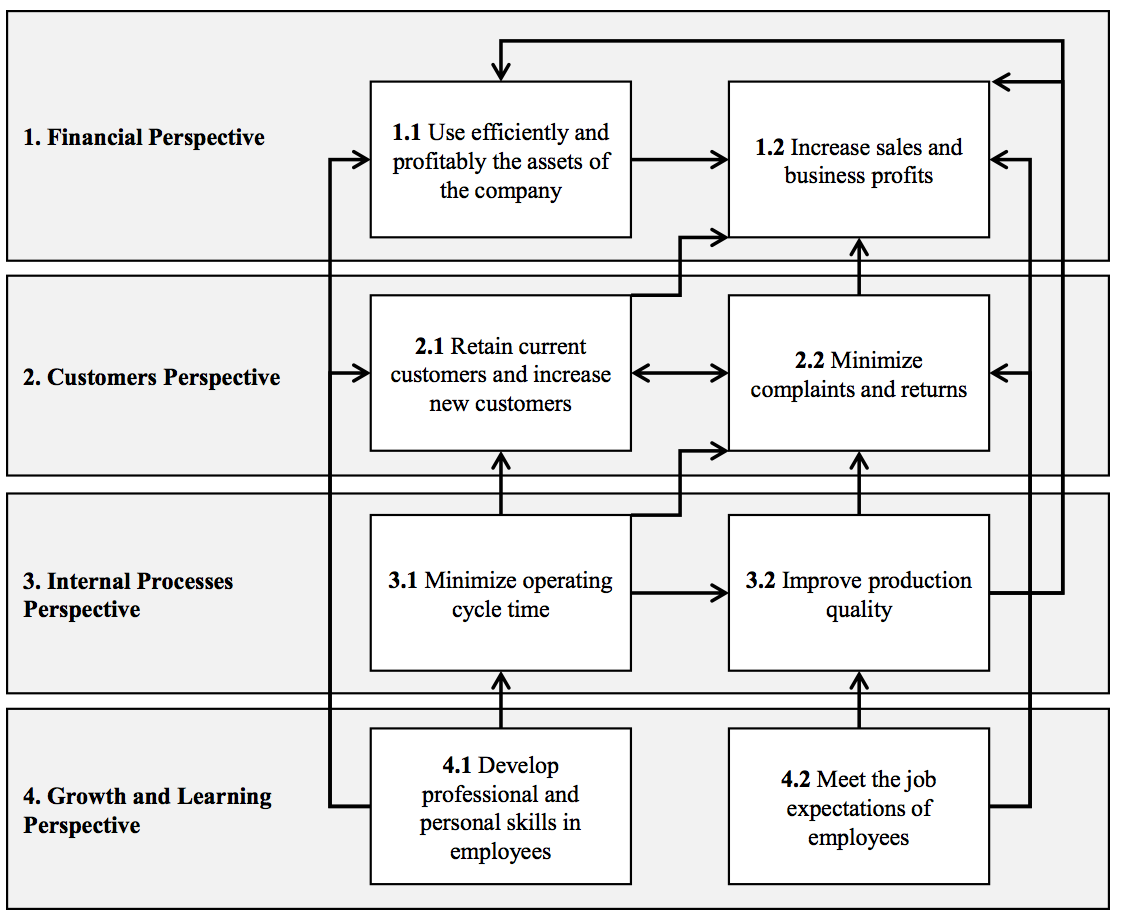
Source: Authors
The strategic map presents cause-effect relationships between objectives, and it shows that developing professional and personal skills in employees helps to use the assets of the company efficiently, retains existing customers, increases new customers and minimizes operating cycle time. In addition, it shows that meeting the expectations of employees and minimizing the operating cycle time (high employee motivation and shorter customer response times) improves production quality, minimizes complaints and returns, and this generates the efficient and cost-effective use of assets, and similarly increases sales and profits of the company. Furthermore, the strategies map suggests that minimizing complaints and returns retain existing customers and facilitate obtaining new customers for the organization, and thus, increases sales and business profits. After creating the strategic map and statement of business objectives, the design of a BSC must include a measurement matrix containing the KPIs that measure the achievement of the objectives. Table 1 presents the measurement matrix, which details the name, formula, description, formula, unit of measure (UM) and desired values (high or low values) for each KPI.
The measurement matrix presented in Table 1, must specify for each KPI the frequency of calculation (monthly in this case), assign a department or process responsible for managing the KPI, and assign goal values to then calculating its achievement. To calculate the performance of the KPI n belonging to objective m of the perspective i (Ii,m,n), it is necessary normalize the indicators and distinguish whether it is better for the organization to obtain high values in an indicator, as with profitability indicators; or low values in an indicator, as with indicators of defects, operational cycles, claims and complaints, among others. For this reason, equation (1) represents the calculation of goals achievement for KPIs in which higher values represents more benefits for the company; and equation (2) represents the calculation of goals achievement for KPIs in which lower values represents more benefits for the company.
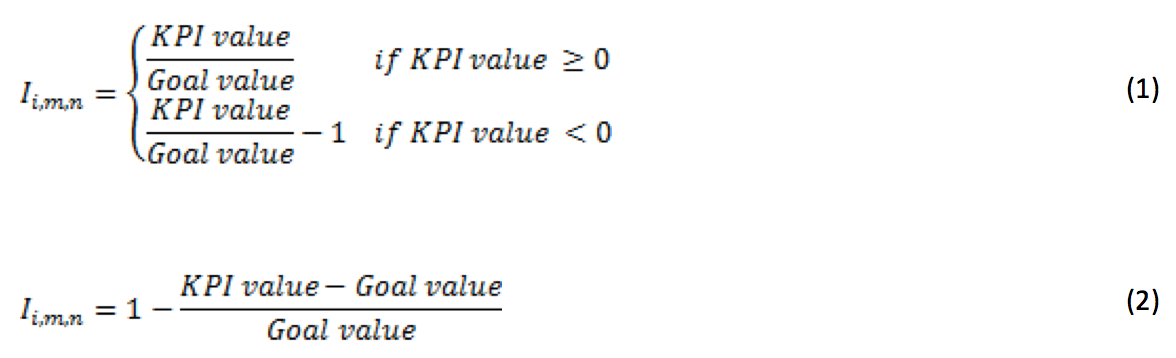
Equation (1) has two ways of calculating the KPI achievement depending on whether the indicator value is a positive or negative number. It is necessary to pose this condition because some KPIs use net profits at the numerator, which may be negative for a period, representing financial losses for the company. Hence, equation (1) ensures a standard scale for the achievement of KPI goals, and this allows applying aggregation methods for the calculation of synthetic achievement indicators for objectives, perspectives and business strategy.
Table 1. Measurement matrix
Perspective |
Objective |
KPI |
Description |
|
Formula |
|
UM |
Desired Value |
Financial |
1.1 |
Return On Assets (ROA) |
Ratio between profits and assets. Profitability generated with the total assets of the company. |
|
Net Income |
|
% |
High |
Total Assets |
||||||||
Return On Equity (ROE) |
Ratio between profits and shareholders’ equity. Profitability generated by the company's own resources. |
|
Net Income |
|
% |
High |
||
Shareholders Equity |
||||||||
1.2 |
Net Profit Margin |
Ratio between profits and sales. Represents the ability to generate profits through sales (operating income). |
|
Net Income |
|
% |
High |
|
Net Sales |
||||||||
Sales Growth |
Percentage change in sales over the previous period. Sales growth between two periods of analysis. |
|
Net Salest - Net Salest-1 |
|
% |
High |
||
Net Salest-1 |
||||||||
Customer |
2.1 |
Customers Growth |
Percentage change in the number of customers over the previous period. Customer growth between two periods of analysis. |
|
Customerst – Customerst-1 |
|
% |
High |
Customers t-1 |
||||||||
Customers Churn |
Percentage of customers lost in a period. Evaluates the retention and loyalty of customers. |
|
Lost Customers |
|
% |
Low |
||
Total Customers |
||||||||
2.2 |
Complaints and Claims |
Percentage of customer orders with complaints and/or claims. Measures the quality of sold products and quality of service. |
|
Orders with Complaints |
|
% |
Low |
|
Total Orders |
||||||||
Returned Orders |
Percentage of orders rejected by the customer. It measures the quality of products and services offered. |
|
Orders Rejected |
|
% |
Low |
||
Total Orders |
||||||||
Internal Processes |
3.1 |
Purchasing Cycle |
Response time of purchasing. It measures the responsiveness of the procurement process to supply the required products and services. |
|
Purchasing Response Time |
|
Hours |
Low |
Production Cycle |
Production time per batch. It measures the speed of the production system to process a batch. |
|
Production Time per Batch |
|
Hours |
Low |
||
Delivery Cycle |
Response time for customer orders. It measures the responsiveness of the company to meet customer orders. |
|
Customer Orders Response Time |
|
Hours |
Low |
||
3.2 |
Defective Products |
Percentage of units produced that do not meet quality and service specifications defined by customers. |
|
Defective Units |
|
% |
Low |
|
Total Units |
||||||||
Growth and Learning |
4.1 |
Investment in Training |
Ratio between the values invested in training and the total expenditure on staff. |
|
Investment in Training |
|
% |
High |
Staff Expenditure |
||||||||
Training Effectiveness |
Proportion of satisfied employees with training and total employees trained. |
|
Satisfied Employees |
|
% |
High |
||
Trained Employees |
||||||||
4.2 |
Satisfied Staff |
Ratio between satisfied employees working and total employees. Measure employee satisfaction and organizational climate. |
|
Satisfied Employees |
|
% |
High |
|
Total Employees |
Therefore, according to the standard values of the achievement of indicators (Ii,m,n), a quantitative assessment is assigned to each indicator, as shown in Table 2. Likewise, an action plan and time term for the implementation of each action plan are determined to ensure a process of continuous improvement and the achievement of established goals.
Table 2. Action plans for KPIs
Goal Achievement |
Quantitative Assessment |
Action plan |
Time term for Action Plan |
100% < (Ii,m,n) |
Excellent |
Preventive |
Long (12 to 18 months) |
80% ≤ (Ii,m,n) < 100% |
Good |
Improvement |
Medium (6 a 12 months) |
60% ≤ (Ii,m,n) < 80% |
Poor |
Improvement |
Short (3 a 6 months) |
(Ii,m,n) < 60% |
Not acceptable |
Corrective |
Short (3 a 6 months) |
Source: Authors
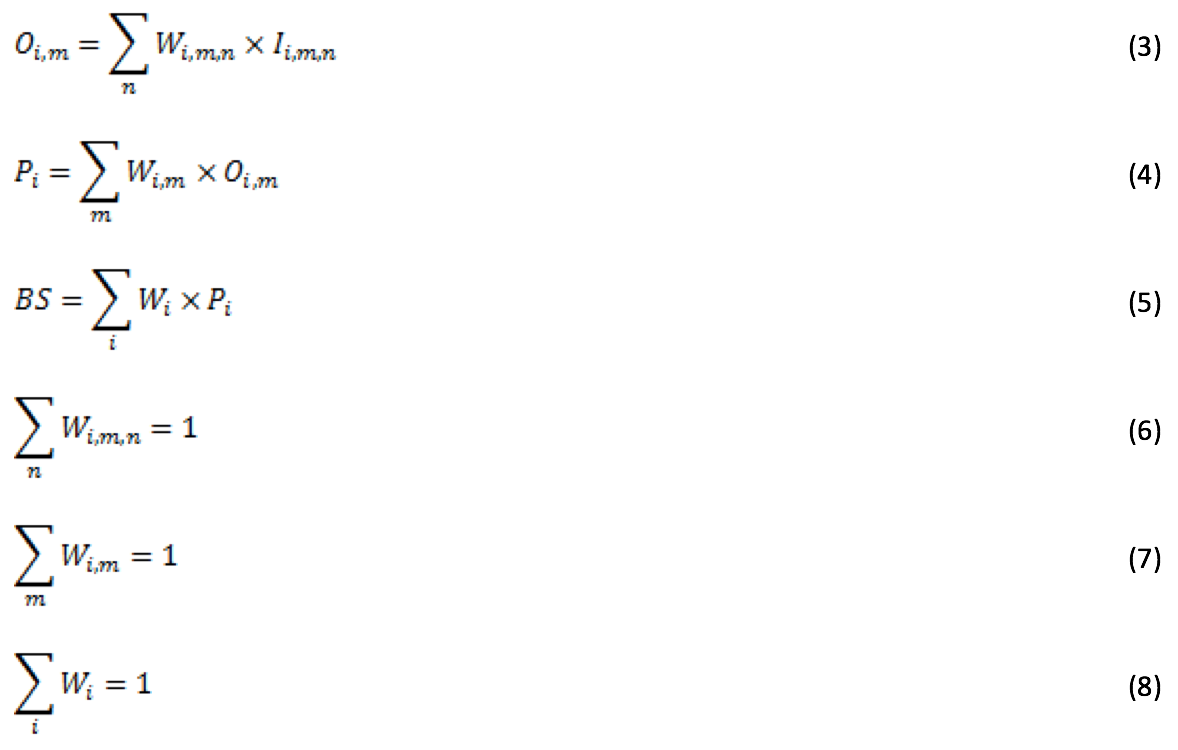
The details of the action plans will be consistent with the reality of the processes evaluated, and its scope and effectiveness depend on the management skills and resources available in the organization. With the calculation of the achievement of the KPI, the assessment of these indicators and the type of action plan to apply, it is possible to perform the aggregation of indicators to measure the achievement of objectives, perspectives and business strategy. For this, the methodology includes a hierarchical weighting method, which creates synthetic indicators for each hierarchical level of the BSC shown in Figure 1. Linear weightings generate synthetic indicators for each level of the hierarchy; and successive weightings originate aggregate indicators to interpret the performance achieved in objectives, perspectives, and business strategy. Table 3 shows the nomenclature for the hierarchical weighting approach.
Table 3. Nomenclature for the Hierarchical Weighting method in the BSC
Variable |
Description |
BS |
Achievement of the business strategy |
Pi |
Achievement of the perspective i |
Oi,m |
Achievement of the objective m belonging to the perspective i |
Ii,m,n |
Achievement of the KPI n belonging to objective m of the perspective i |
Wi |
Weighting of the perspective i |
Wi,m |
Weighting of the objective m belonging to the perspective i |
Wi,m,n |
Weighting of the KPI n belonging to objective m of the perspective i |
Source: Authors
The hierarchical weighting method begins weighting n KPIs to calculate the synthetic indicator of the objective m belonging to the perspective i, as shown in equation (3). Then, according to equation (4), the synthetic indicator for perspective i is calculated with the values obtained in equation (1) by weighting the m objectives belonging to this perspective. Lastly, equation (5) determine the achievement of the business strategy BS, creating a synthetic by weighting the results obtained in equation (4). Equations (6), (7) and (8) guarantee that the sum of the weight values is equal to 1 for the weighting of KPIs, objectives and perspectives. Such weight values depend on the preferences of the top managers leading the implementation of the BSC, should be consistent with the guidelines established in the business strategy and must be assigned before running the hierarchical weighting model, and that the weights assigned.
To start the implementation of the BSC, it is necessary to obtain the input information required by the KPIs defined in the measurement matrix. This input information must be reliable, periodical and timely to calculate the KPI formulas proposed in the BSC. Once the procedure for developing the BSC is ready, an information system based on MSExcel and Visual Basic Applications templates support the implementation of the model, so that the user of the BSC system only should enter the required input data exhibited in the measurement matrix. Therefore, the information system throw results for objectives, perspectives and business strategy, which are complemented with charts, graphs and visual interfaces, suggesting the implementation of action plans, and facilitating the reading and interpretation of the performance of the company, as well as the fulfillment of established goals.
In order to implement a BSC in the company under study, the primary information of the different business processes that make up the business structure of the company must be collected. This information presents monthly results of the company, to match the update frequency of the KPIs, and this information covers an operating year to calculate annual indicators of achievement for objectives, perspectives and business strategy. Table 4 shows the monthly input information for the BSC, as well as an annual value, which can be the sum of monthly values (T) or the average of monthly values (A), and the monetary values are equivalent USD (thousands). Based on the information in Table 4, it is necessary to determine the KPIs values and the achievement goals of each KPI for a year. The goals correspond to historical information of the company and average values of the industry of stony aggregates. Consequently, Table 5 presents for each KPI the goal achievement value (Ii,m,n), quantitative assessment, action plan assigned and the time term for the action plan. Likewise, Table 5 shows the goal achievement value for objectives (Oi,m), perspectives (Pi) and business strategy (BS), calculated by the hierarchical weighting method, where weights are given by the business managers, according to the importance of each indicator in its respective objective.
The results indicate that for the 15 KPIs analyzed, there are four preventive plans, six improvement plans and five corrective plans for the long, medium and short-term, respectively. The achievement values for objectives are ranging from 31% to 184%, in each perspective one objective presents achievement values above 90%, while the other objective in each perspective reaches values lower than 64%. It is noteworthy that the perspective with better performance is the financial, with an achievement of 126%, while the customers’ perspective has the lower performance, with an achievement of 49%. Applying the weighting of the perspectives, the achievement of the business strategy correspond to 81%, which is interpreted as good or acceptable, and suggests an improvement in order to achieve a fully satisfactory performance in the company.
Due to the versatility and simplicity offered by the BSC for SMEs, these companies can measure, synthesize and understand the strategy performance, suggest action plans and support top managers in decision-making processes. In the company under study, the results obtained with the BSC allow identifying the strengths and weaknesses through the analysis of KPIs, objectives and perspectives of the business strategy.
According to the information in Table 5, the customer perspective and the growth and learning perspective had lower performance, and due to this, it is required to detail the KPIs that cause poor performance of the objectives that make these perspectives and prioritize action plans ensuring a satisfactory achievement of the business strategy. Therefore, the results suggest to top managers to run in the short-term corrective plans for KPIs such as Customers Growth and Customers Churn, and improvement plans in the short-term to reduce complaints and claims. Such plans should focus on improving customer service processes, thereby increasing the number of retained customers, and avoiding desertion of customers.
For growth and learning perspective, it suggests running in the short-term corrective plans for KPIs of investment in training and training effectiveness, allocating more resources in skills development in employees, and designing training plans according to the real needs and expectations of employees, thus increasing the satisfaction of employees trained. According to the strategic map in Figure 3, these plans for the growth and learning perspective will support the retention of existing customers, increase new customers, minimize operating cycle time, and use of efficient and profitable assets of the company way.
Regarding the financial perspective, it should pay special attention to the KPI of net margin, which presents unsatisfactory results, and it is recommended to review the financial structure of the organization, determining if operative, financial and management costs are adequate. Once the cost structure of the company has been improved, the company should focus on increasing sales to meet the goals set for sales growth and net margin. Similarly, the company under study must execute short-term improvement plans to reduce defective products in the internal process perspective, thereby reducing reprocesses, wastes, operating costs, and improving other BSC perspectives and the achievement of business strategy.
Table 4. Input information for KPIs in the BSC
|
Input Information |
Values Yeart-1 |
Month |
Value Yeart |
||||||||||||
|
1 |
2 |
3 |
4 |
5 |
6 |
7 |
8 |
9 |
10 |
11 |
12 |
||||
1. Financial |
Net Income |
|
$ 16 |
$ 7 |
$ 1 |
$ 3 |
$ 3 |
$ 12 |
$ 9 |
$ 12 |
$ 7 |
$ 12 |
$ 16 |
$ 14 |
$ 112 |
(T) |
Total Assets |
|
$ 239 |
$ 242 |
$ 252 |
$ 238 |
$ 239 |
$ 246 |
$ 244 |
$ 240 |
$ 239 |
$ 239 |
$ 239 |
$ 243 |
$ 242 |
(A) |
|
Shareholders’ Equity |
|
$ 62 |
$ 63 |
$ 74 |
$ 61 |
$ 58 |
$ 63 |
$ 67 |
$ 63 |
$ 64 |
$ 63 |
$ 64 |
$ 67 |
$ 64 |
(A) |
|
Net Sales |
$ 2,490 |
$ 214 |
$ 217 |
$ 218 |
$ 215 |
$ 211 |
$ 209 |
$ 204 |
$ 216 |
$ 224 |
$ 209 |
$ 215 |
$ 217 |
$ 2,570 |
(T) |
|
2. Customers |
Total Customers |
16 |
15 |
15 |
16 |
15 |
16 |
17 |
19 |
21 |
17 |
15 |
13 |
16 |
16 |
(A) |
Lost Customers |
|
4 |
3 |
2 |
3 |
5 |
6 |
4 |
3 |
2 |
3 |
2 |
4 |
3 |
(A) |
|
Customer Orders |
|
20 |
15 |
25 |
30 |
26 |
34 |
32 |
33 |
30 |
36 |
38 |
39 |
358 |
(T) |
|
Claims and Complaints |
|
5 |
4 |
5 |
4 |
5 |
4 |
2 |
4 |
3 |
4 |
5 |
3 |
48 |
(T) |
|
Orders Rejected |
|
2 |
1 |
3 |
2 |
4 |
3 |
2 |
2 |
3 |
4 |
3 |
2 |
31 |
(T) |
|
3. Internal Processes |
Purchasing Response Time (h) |
|
32 |
35 |
38 |
48 |
48 |
49 |
32 |
28 |
30 |
33 |
45 |
42 |
38 |
(A) |
Production Time per Batch (h) |
|
25 |
22 |
24 |
27 |
26 |
23 |
28 |
23 |
25 |
27 |
23 |
25 |
25 |
(A) |
|
Customer Orders Response Time (h) |
|
10 |
8 |
7 |
9 |
10 |
12 |
9 |
7 |
11 |
9 |
9 |
10 |
9 |
(A) |
|
Defective Units |
|
10 |
11 |
15 |
17 |
18 |
20 |
15 |
10 |
12 |
13 |
12 |
10 |
163 |
(T) |
|
Total Units Produced |
|
100 |
100 |
100 |
100 |
100 |
100 |
100 |
100 |
100 |
100 |
100 |
100 |
1 200 |
(T) |
|
4. Growth and Learning |
Investment in Training |
|
$ 7 |
$ 6 |
$ 6 |
$ 6 |
$ 6 |
$ 6 |
$ 7 |
$ 7 |
$ 7 |
$ 6 |
$ 6 |
$ 6 |
$ 77 |
(T) |
Expenditure on Staff |
|
$ 69 |
$ 67 |
$ 66 |
$ 66 |
$ 66 |
$ 67 |
$ 68 |
$ 68 |
$ 68 |
$ 67 |
$ 67 |
$ 68 |
$ 806 |
(T) |
|
Satisfied Employees with Training |
|
15 |
16 |
17 |
17 |
17 |
19 |
20 |
21 |
22 |
18 |
16 |
15 |
18 |
(A) |
|
Trained Employees |
|
40 |
40 |
40 |
40 |
40 |
40 |
40 |
40 |
40 |
40 |
40 |
40 |
40 |
(A) |
|
Satisfied Employees |
|
35 |
36 |
36 |
36 |
35 |
36 |
36 |
36 |
36 |
36 |
36 |
35 |
36 |
(A) |
|
Total Employees |
|
45 |
45 |
45 |
45 |
45 |
45 |
45 |
45 |
45 |
45 |
45 |
45 |
45 |
(A) |
|
Table 5. Goal achievement for KPIs, objectives and business strategy
Perspective |
Objective |
KPI |
Value |
Goal |
Ii,m,n |
Wi,m,n |
Action Plan |
Oi,m |
Wi,m |
Pi |
Wi |
BS |
||
Assessment |
Plan |
Term |
||||||||||||
1. Financial |
1.1 |
ROA |
46% |
35% |
132% |
0.55 |
Excellent |
Preventive |
Long |
184% |
0.55 |
126% |
0.25 |
81% |
ROE |
174% |
70% |
248% |
0.45 |
Excellent |
Preventive |
Long |
|||||||
1.2 |
Net Profit Margin |
4% |
9% |
48% |
0.55 |
Not Acceptable |
Corrective |
Short |
56% |
0.45 |
||||
Sales Growth |
3% |
5% |
65% |
0.45 |
Poor |
Improvement |
Short |
|||||||
2. Customers |
2.1 |
Customers Growth |
2% |
5% |
36% |
0.55 |
Not Acceptable |
Corrective |
Short |
31% |
0.70 |
49% |
0.24 |
|
Customers Churn |
21% |
12% |
25% |
0.45 |
Not Acceptable |
Corrective |
Short |
|||||||
2.2 |
Complaints and Claims |
13% |
10% |
66% |
0.50 |
Poor |
Improvement |
Short |
90% |
0.30 |
||||
Returned Orders |
9% |
10% |
113% |
0.50 |
Excellent |
Preventive |
Long |
|||||||
3. Internal Processes |
3.1 |
Purchasing Cycle |
38 |
36 |
94% |
0.30 |
Good |
Improvement |
Medium |
91% |
0.50 |
77% |
0.27 |
|
Production Cycle |
25 |
24 |
97% |
0.30 |
Good |
Improvement |
Medium |
|||||||
Delivery Cycle |
9 |
8 |
84% |
0.40 |
Good |
Improvement |
Medium |
|||||||
3.2 |
Defective Products |
14% |
10% |
64% |
1.00 |
Poor |
Improvement |
Short |
64% |
0.50 |
||||
4. Growth and Learning |
4.1 |
Investment in Training |
10% |
17% |
56% |
0.60 |
Not Acceptable |
Corrective |
Short |
51% |
0.70 |
70% |
0.24 |
|
Training Effectiveness |
44% |
100% |
44% |
0.40 |
Not Acceptable |
Corrective |
Short |
|||||||
4.2 |
Satisfied Staff |
79% |
70% |
113% |
1.00 |
Excellent |
Preventive |
Long |
113% |
0.30 |
||||
Source: Authors
However, the company presents satisfactory financial results related to the return of assets and equity, and satisfactory results in the KPI of orders rejected. In internal processes, the company generates appropriate cycle times operations, which may improve in the medium term to give a faster response to customer requirements. In addition, the company exceeded its expectations of satisfied staff, promoting a pleasant working environment; even though it is required to reinforce the satisfaction of employees trained, as clarified above. Finally, the BSC analysis invites validating annually the goals for each KPI, based on the evolution of each indicator and the average values of the industry in which the company operates. These goals should be challenging and demanding to encourage the business processes to improve, taking the company to a continuous improvement process and therefore generating value and confidence to the stakeholders, and must be aligned with the cause-effect relations stated on the BSC.
The design and implementation of a BSC are adequate for small and medium enterprises due to its ease of understanding and application to measure the performance of business strategies. The proposed BSC translates the strategy into tactic and operative terms through perspectives, objectives and KPIs, which align business processes with the business strategy, including a continuous improvement process that involves all the employees of the company. Likewise, the proposed BSC is created to be applied in SMEs because of the use of simple and effective aggregation methods such as the hierarchical weighting process, creating synthetic indicators in hierarchy levels of the BSC (objectives, perspectives, business strategy), and creating action plans to ensure the achievement of strategic, tactic and operative goals.
In the company under study, the implementation of the BSC defines that the achievement of the business strategy is good or acceptable according to the established goals, suggesting an improvement in the business processes to reach a satisfactory performance in the company. Specifically, the company requires implementing corrective plans in the customer perspective and in the growth and learning perspective to reduce lost customers, complaints and claims, and to increase the satisfaction of employees that receive training. In the financial perspective and in the internal process perspective, the BSC suggests corrective plans in order to improve the net profit margin by reducing operative and management costs, defective products and increasing net sales.
Furthermore, the BSC identifies strengths in the company, highlighting in the company under study the return over assets, return over equity, product quality, operative cycle time, and the satisfaction of employees. The strengths and weaknesses identified have a direct relation to the achievement of goals, which were set according to historical information of the company and average values of the industry of stony aggregates.
Therefore, the design and implementation of the BSC encourage SMEs to reach business success adopting a strategic performance measurement system that have been successful in large companies, and to improve the quality of strategic management. Consequently, performance measurement systems like the BSC could have a great acceptance in SMEs if these systems adapt to the requirements and realities of these companies, and if they include subjectivity assigning weights and objectivity to normalize indicators and aggregate them.
AIDEMARK, L. (2010). Cooperation and Competition: Balanced Scorecard and Hospital Privatization. International Journal of Health Care Quality Assurance, 23(8), pp 730-748.
AYVAZ, E. and PEHLIVANLT, D. (2011). The use of time driven activity based costing and Analytic hierarchy process method in the Balanced Scorecard Implementation. International Journal of Business and Management, 6(3), pp 146-158.
BENTO, A., BENTO, R., AND WHITE, L. F. (2014). Strategic Performance Management Systems: Impact on Business Results. Journal of Computer Information Systems, 54(3), 25–33.
COE, N., and LETZA, S. (2014). Two decades of the balanced scorecard: A review of developments. Poznan University of Economics Review, 14(1), 63–75.
GAO, T. and GURD, B. (2015). Meeting the Challenge in Performance Management: the diffusion and implementation of the Balanced Scorecard in Chinese Hospitals. Health Policy and Planning, 30(2), pp 234-241.
KAPLAN, R., and NORTON, D. (2004). Strategy Maps: Converting Intangible Assets into Tangible Outcomes. Boston: Harvard Business School Publishing.
KAPLAN, R. S., NORTON, D. P., and RUGELSJOEN, B. (2010). Managing alliances with the balanced scorecard. Harvard Business Review, 88(1-2), 114-120.
KORONTAI, J.N., CARPEJANI, G., CORREIA, A.M.M., FREITAS, W.A., VEIGA, C.P. and DUCLÓS, L.C. (2016). Proposta de indicadores de desempenho para a incubadora tecnológica do Instituto de Tecnologia do Paraná / Brasil. Revista Espacios, 37(2), p. 20. Recuperado de: http://www.revistaespacios.com/a16v37n02/16370221.html
LIN, Z., YU, Z. and ZHANG, L. (2014). Performance Outcomes of Balanced Scorecard application in Hospital Administration in China. China Economic Review, 30(0) , pp 1-15.
MACHADO, M. C. V. (2013). Balanced Scorecard: an empirical study of small and medium size enterprises. Revista Brasileira de Gestão de Negocios, 15(46), 129–148.
MARTELLO, M., WATSON, J. and FISCHER, M. (2008), Implementing a Balanced Scorecard in a Not-for-profit Organization, Journal of Business and Economics Research, 6(9), pp.67-80.
MENDES, P., SANTOS, A. C., PERNA, F., and TEIXEIRA, M. R. (2012). The balanced scorecard as an integrated model applied to the Portuguese public service: A case study in the waste sector. Journal of Cleaner Production, 24, 20–29.
MILLAN, E., TORREALBA, A. and ORTIZ, M. (2015). Formulación de Indicadores de Gestión como herramienta de desarrollo empresarial. Para la empresa de transporte, Inversiones Los Chabalos, C.A. Revista Espacios, 36(17), p. 21. Recuperado de: http://www.revistaespacios.com/a15v36n17/15361722.html
NEELY, A., MILLS, J., PLATTS, K., RICHARDS, H., GREGORY, M., BOURNE, M., and KENNERLEY, M. (2000). Performance measurement system design: developing and testing a process-based approach. International Journal of Operations and Production Management, 20(10), 1119–1145.
ORTIZ, M. and CORTEZ, E.A. (2013). Cuadro de mando integral automatizado como modelo en la medición y el control de las estrategias formuladas por la empresa “Transporte Avea, C.A.”. Revista Espacios, 34(3), p. 12. Recuperado de: http://www.revistaespacios.com/a13v34n03/13340312.html
PAPALEXANDRIS, A., G. IOANNOU and G. PRASTACOS (2004). Implementing the Balanced Scorecard in Greece: a Software Firm's experience. Long Range Planning, 37(4), pp 351-366.
PESSOA, M.B.D. (2015). Proposta de uma metodologia inovadora utilizando-se de Mapeamento Cognitivo e Balanced Scorecard: um estudo de caso em uma microempresa. Revista Espacios, 36(11), p. 10. Recuperado de: http://www.revistaespacios.com/a15v36n11/15361110.html
RODRIGUES, P., AIBAR, B., and LIMA, L. (2014). Determinant Factors of the Implementation of the Balanced Scorecard in Portugal: empirical evidence in public and private organizations. Review of Business Management, 16(51), 199–222.
1. Universidad de Medellín. Ingeniero Industrial, Magister en Ingeniería Administrativa. jacano@udem.edu.co
2. Universidad Tecnológica de Bolívar, Colombia. Contador Público, Magister en Administración MBA. jvergara@unitecnologica.edu.co
3. Universidad Tecnológica de Bolívar, Colombia. Contador Público, Magister en Administración MBA. fpuerta@unitecnologica.edu.co