![]() ISSN 0798 1015
ISSN 0798 1015

![]() ISSN 0798 1015
ISSN 0798 1015
Vol. 38 (Nº 33) Año 2017. Pág. 20
Eduard Olegovich TOPLENINOV 1; , Leonid Alekseevich ELSHIN 2;
Received: 30/05/2017 • Approved: 15/06/2017
ABSTRACT: This article presents conceptual approaches to assessment and analysis of efficiency of the pharmaceutical industry development by the example of the Republic of Tatarstan based on the use of methods of normative scorecard. The results of the conducted research allow to identify the mechanisms and priority development fields for the sectors of the economy under study, on the basis of systematic analysis of the highlighted key series of indicators that describe various aspects of sectoral development: financial results of the industry development and capability to increase investment and innovation activity directly arising from them; structure of cost for the production, which determines the capabilities of output of competitive products; financial stability and liquidity of the industry development, which provides capability of financial security of the long-term progressive development; and use of labor resources, their composition and structure. Key development fields of the pharmaceutical industry of the Republic of Tatarstan during the current and perspective periods of development have been formulated and defined in the work based on the results of assessment of competitiveness of the previously formed business processes that describe sectoral development. |
RESUMEN: Este artículo presenta los enfoques conceptuales de la evaluación y el análisis de la eficiencia del desarrollo de la industria farmacéutica por el ejemplo de la República de Tatarstán basado en el uso de métodos de cuadro de mando normativo. Los resultados de las investigaciones realizadas permiten identificar los mecanismos y ámbitos prioritarios de desarrollo de los sectores de la economía objeto de estudio, sobre la base de un análisis sistemático de la serie de indicadores clave que describen diversos aspectos del desarrollo sectorial: resultados financieros de la industria Desarrollo y capacidad para incrementar las actividades de inversión e innovación que surjan directamente de ellas; Estructura del costo para la producción, que determina las capacidades de producción de productos competitivos; La estabilidad financiera y la liquidez del desarrollo de la industria, que proporciona la capacidad de seguridad financiera del desarrollo a largo plazo progresiva; Y el uso de los recursos laborales, su composición y estructura. Los principales ámbitos de desarrollo de la industria farmacéutica de la República de Tatarstán durante los períodos actuales y perspectivas de desarrollo han sido formulados y definidos en el trabajo basado en los resultados de la evaluación de la competitividad de los procesos empresariales previamente formados que describen el desarrollo sectorial. |

A balanced scorecard (BSC) is one of the complex tools of assessment of the efficiency of development of the socio-economic system of a various level. It was first developed by R. Kaplan and D. Norton (Kaplan and Norton, 2006). It relies on the principle of systemic analysis of the obtained results of the organization based on examination and evaluation of a comprehensive set of indicators that describe not just the financial and economic parameters of development, but also social and institutional ones. According to developers, the latter describe the efficiency of personnel development, business processes being implemented and relationships with customers. The conceptual need for using BSC is that it establishes causal relationships in the course of examination of factors that generate the dynamics and quality of the organization development. In accordance with the basic BSC approaches, "multidimensional indicators in a properly established system must consist of interrelated objectives and evaluation criteria of their achievement, consistent and complementary" (Kaplan and Norton, 2006). In other words, the need for the balanced scorecard application is justified by the need of transformation of the organization's mission into the system of tangible objectives and tasks. As such, the scope of the BSC use broadens the horizons of planning and generates a specific set of indicators of the organization’s efficiency, which is not limited to the assessment of the economic field, but also takes into account quite a wide range of institutional parameters. This approach allows to establish a link between the financial costs and specific results, and to develop the adapted current and future development needs of the targeted programs on this basis.
At the same time, one of the most significant drawbacks of the BSC method is that the authors of this method do not clearly describe the algorithm of balancing various indicators that describe the qualitatively diverse aspects of the socio-economic system development.
\Algorithms of assessment of the organizations’ efficiency, developed by Robert Kaplan and David Norton, have been further developed in the writings of other scholars. For instance, the Thomas Clark’s paper (Clarke 2001) justifies that the analysis of the organization’s activity should be carried out based on the so-called triple system of indicators that takes into account not just financial and economic, but also social and environmental results. The author argues that in the current economic conditions, the efficient operation of the organization cannot be ensured in the case of focusing only on economic parameters in the planning system. The institutional reality is that the modern organization aiming for sustainable development acts as one of the elements establishing the social background in the society. As such, the issue of promoting social obligations, which undoubtedly include the issues of environmental well-being of the territories, becomes strategically important.
Methodological tools of building the normative scorecard, whose foundations were laid in 1980 by I.M. Syroezhin, are presented in domestic science (Syroezhin, 1980). Later, the methodological tools of the normative scorecard were developed in the studies of Yu.A. Raeva, A.R. Gilmullin, T.A. Konovalova (Raeva 2005; Gilmullin 2009; Konovalova 2013).
The essence of this method is establishment of some reference sequence of the rate of change of indicators of the socio-economic development of the system. Then, the actual distribution of indicator growth rates is compared with the reference distribution, and the closer the matching of the actual and reference distributions of growth rates, the higher the efficiency of development of the socio-economic system under study. The method of the normative scorecard was originally used at the enterprise level, and then the possibility of using the method at the level of a larger-scale system (in particular – by the example of the sector) was justified.
Using the tools of the normative scorecard, a method to identify priority fields of the formation of an industrial cluster based on an integrated estimation of the efficiency of its development has been developed in this study (procedure of the method application is shown in Figure 1).
Designations used in the suggested method:
Dev – deviation of the actual rank of the rate of the sectoral development growth from the reference rank;
I – ranks inversion (I = Dev at Dev > 0, I =0 at Dev < 0);
n – total number of indicators of each set (in the developed method, n = 5 for each of the sets of the sectoral development indicators);
Ksp – Spearman test;
Kkn – Kendall test;
E – efficiency of sectoral development in one of the sections (sets of socio-economic indicators);
Eint – integral efficiency of the sectoral development.
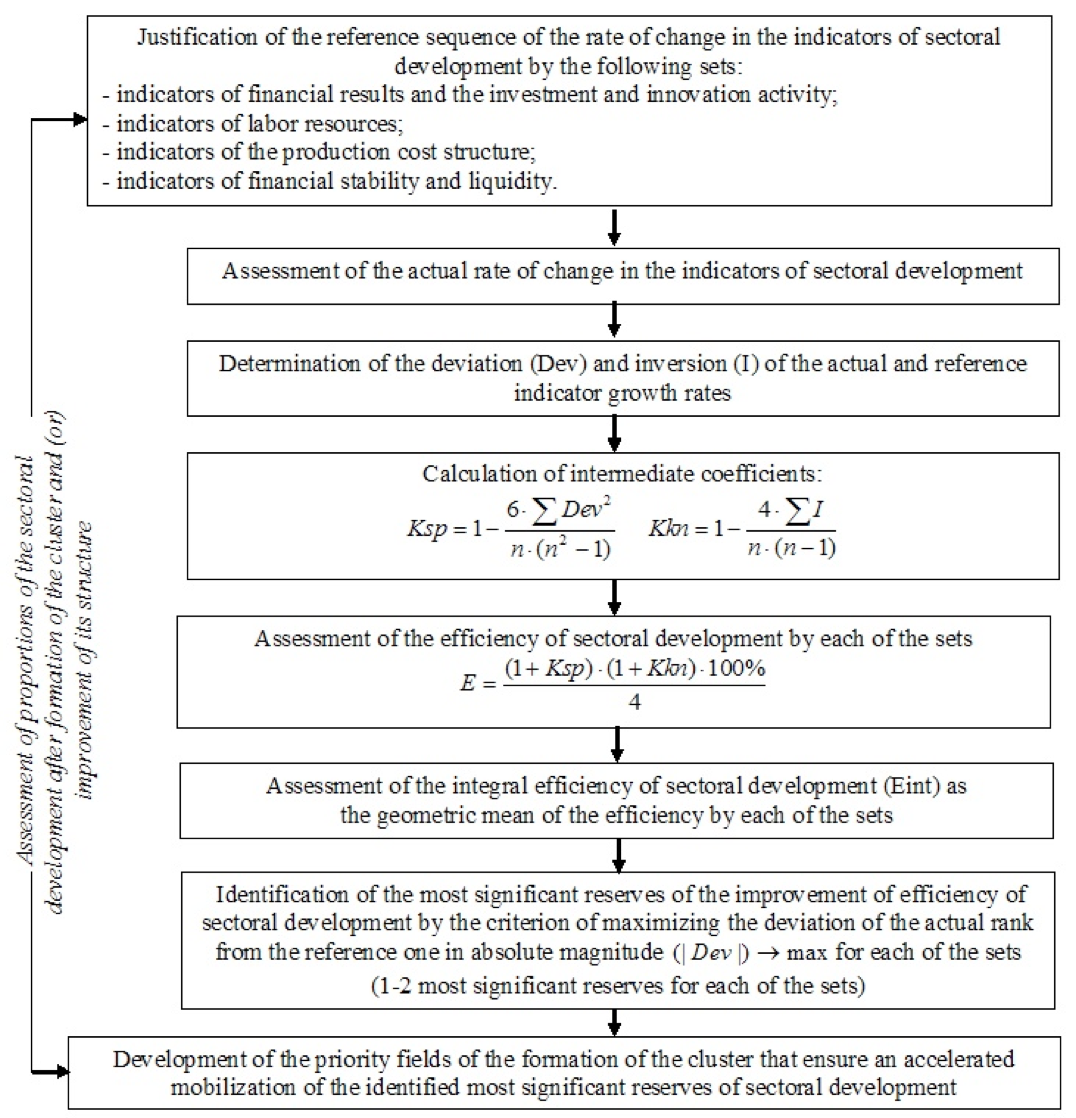
Figure 1. Procedure of the developed method to identify priority fields of the cluster formation
on the basis of integral estimate of the efficiency of sectoral development
Indicators "E" and "Eint" are measured in the range 0% to 100%, in accordance with the general method of the normative scorecard. Respectively, the efficiency of sectoral development for a particular set of indicators is considered to be above average at a value of "E" exceeding 50%.
As such, we have identified four main sets of indicators describing various aspects of sectoral development:
- financial results of the sectoral development and the capability to improve investment activity directly arising from them;
- production cost structure, which determines the capability of competitive production;
- financial stability and liquidity of the sectoral development, which ensures the capability of financial security of long-term progressive development;
- use of labor resources, their composition and structure.
The reference sequence of the indicators of the said sets within the developed method is shown in Figure 2.
The reference sequence of the rate of change in the indicators of financial results and the investment and innovation activity of the sectoral development within the developed method is as follows (Formula 1):
![]() (1)
(1)
where T is a real (leveling the inflation component) rate of the indicator change.

Figure 2 – Reference sequence of indicators of the sectoral
development within the developed method
Let’s describe the proportions of the reference sequence by the example of the set of indicators of financial results and the investment and innovation activity of the developed method to identify priority fields of cluster formation based on an integral estimate of the efficiency of the sectoral development:
1. The rate of growth of investment in innovation should be the largest in modern conditions, in an ideal scenario – outpacing the rates of changes in all other socio-economic indicators that are included in the method. This proportion arises from the need for constant technical and technological modernization of the sector, introduction of innovative approaches to managing human resources, sales, finance, and administration of the development of the enterprises in the sector in general (Enright and Ffowcs-Williams, 2001). In particular, implementation of this proportion indicates an increase in the level of innovation focus of the investment process in the sector.
2. Investment growth rate must be higher than the net profit growth rate in the sector. Satisfaction of this ratio shows the increase in production capacity and improvement of material and technical base that provides long-term sustainable growth of the enterprises in the sector. Indeed, if this reference ratio is not satisfied, the net profit growth rate will be higher than the investment growth rate, and therefore, there will be a tendency of the current consumption of resources in the dominant industry, as opposed to their reinvestment, which is not quite positive from the view of ensuring the long-term sustainable efficient development (McConnell and Brue, 2006).
3. The net profit growth rate must be higher than the gross profit growth rate, illustrative of the comparative decrease in non-operating, operational and other similar costs in the sector, i.e. of the increase in the efficiency of its development from the view of overhead costs optimization.
4. The excess of the gross profit growth rate over the revenue growth rate indicates an increase in the level of profitability of the sector functioning. Satisfaction of this ratio is an indicator of the comparative reduction in the level of production costs of the industry operation and saving of various types of material, energy and other forms of direct production costs (Porter 2002).
In accordance with the proposed method of identification of the priority fields of cluster formation based on an integral estimate of the efficiency of the industry development, the most important reserves can be defined for each of the sets using the criterion of maximizing the deviation of the actual rank of the rate of change in the indicators from the reference one in absolute magnitude Respectively, the fields of the formation and improvement of the cluster are developed within the identified most significant reserves.
In general, the novelty of the developed method to identify priority fields of the formation of an industrial cluster based on an integral estimate of the efficiency of sectoral development in comparison with already existing BSC (Balanced Scorecard) and NSC (normative scorecard) methodological tools is the following:
- the sets of production cost structure in the sector and the set of labor resources were first justified within the developed method in comparison with already existing approaches (Sölvell 2003; Safiullin, et.al. 2011; Markov, et.al., 2010; Zdunov 2009; Dudkin 1997; Larina and Kiselnikov, 1998);
- all the sets of indicators were adjusted to a unified system of coordinates, the capability of integral estimate of the efficiency of sectoral development are formed within the method, as opposed to already existing studies based on methodological tools of the normative scorecard;
- the capability of formation and improvement of clusters in the field of mobilization of the most significant reserves of increase in the efficiency of sectoral development for all the sets included in the method and individual indicators were justified for the first time.
The developed method was tested based on the data of regional statistics and information provided by OJSC “Tatchempharmpreparaty”. The rate of growth of the indicators of pharmaceutical industry in Tatarstan included in the method to identify the priority fields of the cluster formation based on an integral estimate of sectoral efficiency is presented in Table 1.
Table 1 – Source data required for testing the method to identify priority fields
of the cluster formation based on an integral estimate of efficiency
of sectoral development of the RT pharmaceutical industry
(Official Website of the Tatchempharmpreparaty Company)
Indicator name |
2010 growth rate to 2009, times |
2011 growth rate to 2010, times |
2012 growth rate to 2011, times |
2013 growth rate to 2012, times |
2014 growth rate to 2013, times |
Investment in innovation |
1.40 |
1.05 |
1.30 |
1.12 |
0.59 |
Investment (total) |
0.88 |
0.44 |
2.99 |
0.52 |
1.96 |
Net profit |
13.06 |
0.32 |
1.42 |
1.82 |
1.13 |
Gross profit |
3.00 |
0.54 |
1.37 |
1.63 |
1.06 |
Revenue |
1.21 |
1.16 |
1.37 |
1.10 |
1.23 |
Asset value |
1.07 |
1.09 |
1.18 |
1.18 |
1.15 |
Borrowed capital |
0.87 |
1.11 |
1.08 |
1.16 |
1.08 |
Accounts payable |
1.17 |
1.35 |
1.33 |
1.21 |
1.03 |
Accounts receivable |
1.33 |
1.14 |
1.25 |
1.30 |
1.37 |
Workforce headcount (total) |
0.96 |
1.00 |
0.97 |
1.01 |
0.97 |
Workforce size |
0.99 |
0.99 |
0.93 |
1.00 |
0.96 |
Number of workers employed in hazardous working conditions |
0.93 |
1.02 |
0.95 |
0.98 |
1.01 |
Headcount of ETP |
0.90 |
1.01 |
0.94 |
1.17 |
1.00 |
Share of informatization costs, % |
1.52 |
1.06 |
0.79 |
1.04 |
1.11 |
Share of wage costs, % |
1.05 |
0.91 |
0.97 |
1.10 |
1.04 |
Share of material costs, % |
0.99 |
0.96 |
1.05 |
0.97 |
1.05 |
Share of administrative costs, % |
1.13 |
1.03 |
1.04 |
0.99 |
1.02 |
The efficiency of development of the pharmaceutical industry of Tatarstan for the set of indicators of financial results and the investment and innovation activity in 2014 is calculated in Table 2, in accordance with the procedure of the developed method.
Table 2 – Assessment of the efficiency of development
of the RT pharmaceutical industry for the
set of financial results and the investment
and innovation activity (2014)
Indicators in the set |
Reference rank series
|
Growth rate, times |
Actual rank series |
Deviation of ranks (Dev)
|
Dev2 |
Inversion (I) |
1. Investment in innovation |
1 |
0.59 |
5 |
4 |
16 |
4 |
2. Investment (total) |
2 |
1.96 |
1 |
-1 |
1 |
0 |
3. Net profit |
3 |
1.13 |
3 |
0 |
0 |
1 |
4. Gross profit |
4 |
1.06 |
4 |
0 |
0 |
1 |
5. Revenue |
5 |
1.23 |
2 |
-3 |
9 |
0 |
6. Sum |
x |
x |
x |
x |
26 |
6 |
7. Spearman test (Ksp) |
-0.3 |
|||||
8. Kendall test (Kkn) |
-0.2 |
|||||
9. Efficiency of the development of pharmaceutical industry for this set of indicators, % |
14 |
|||||
The efficiency for the set of financial results and the investment and innovation activity of the development of the pharmaceutical industry of Tatarstan in 2014 is significantly below the average, which is 50%. Meanwhile, the most significant reserve for increasing the efficiency of sectoral development is the increase in the rate of growth of investment in innovation (this indicator should increase first, according to the reference sequence, but in fact it increases last, Dev=4).
Table 3 presents the calculation of the efficiency of the development of pharmaceutical industry of Tatarstan for the set of indicators of the production cost structure in 2014
Table 3 – Assessment of the efficiency of the development of the RT pharmaceutical industry
for the set of indicators of the production cost structure (2014).
Indicators in the set |
Reference rank series |
Growth rate, times |
Actual rank series |
Deviation of ranks (Dev)
|
Dev2 |
Inversion (I) |
1. Revenue |
1 |
1.23 |
1 |
0 |
0 |
0 |
2. Share of informatization costs, % of the total cost |
2 |
1.11 |
2 |
0 |
0 |
0 |
3. Share of wage costs, % of the total cost |
3 |
1.04 |
4 |
1 |
1 |
1 |
4. Share of material costs, % |
4 |
1.05 |
3 |
-1 |
1 |
0 |
5. Share of administrative costs, % |
5 |
1.02 |
5 |
0 |
0 |
0 |
6. Sum |
x |
x |
x |
x |
2 |
1 |
7. Spearman test (Ksp) |
0.9 |
|||||
8. Kendall test (Kkn) |
0.8 |
|||||
9. Efficiency of the development of pharmaceutical industry for this set of indicators, % |
85.5 |
|||||
The efficiency of development of the pharmaceutical industry of Tatarstan for the set of indicators of the production cost structure is significantly above the average. At the same time, despite the high level of efficiency of development of the pharmaceutical industry for this set of indicators, there is a reserve of its increase based on the reduction of the share of wage costs in the total amount of the overall costs (this indicator in the reference sequence ranks 3rd, and in fact it is 4th, respectively).
The efficiency of development of the pharmaceutical industry of Tatarstan for the set of indicators of financial stability and liquidity in 2014 is calculated in Table 4, in accordance with the procedure of the developed method.
Table 4 – Assessment of the efficiency of the development
of the RT pharmaceutical industry for the set
of the financial stability and liquidity (2014)
Indicators in the set |
Reference rank series |
Growth rate, times |
Actual rank series |
Deviation of ranks (Dev)
|
Dev2 |
Inversion (I) |
1. Revenue |
1 |
1.23 |
2 |
1 |
1 |
1 |
2. Asset value, mln rub. |
2 |
1.15 |
3 |
1 |
1 |
1 |
3. Borrowed capital |
3 |
1.08 |
4 |
1 |
1 |
1 |
4. Accounts payable, mln rub. |
4 |
1.03 |
5 |
1 |
1 |
1 |
5. Accounts receivable, mln rub. |
5 |
1.37 |
1 |
-4 |
16 |
0 |
6. Sum |
x |
x |
x |
x |
20 |
4 |
7. Spearman test (Ksp) |
0 |
|||||
8. Kendall test (Kkn) |
0.2 |
|||||
9. Efficiency of the development of pharmaceutical industry for this set of indicators, % |
30 |
|||||
The efficiency of sectoral development for the set of financial stability and liquidity, like in the first case, reveals the lag from the threshold level of efficiency (50%). Meanwhile, the main component that forms insufficient level of efficiency is a high level of dynamics of non-current receivables (this indicator is the maximum deviation of the actual rank from the reference in absolute magnitude). Respectively, the decrease in the growth rate of accounts receivable of the enterprise in the sector is required. However, the creation of a cluster and development of various forms of corporate integration on its basis will automatically entail processes of assets consolidation and rationalization of their composition and structure.
Table 5 – Assessment of the efficiency of the development of the
RT pharmaceutical industry for the set of labor resources (2014)
Indicators in the set |
Reference rank series |
Growth rate, times |
Actual rank series |
Deviation of ranks (Dev)
|
Dev2 |
Inversion (I) |
1. Revenue |
1 |
1.23 |
1 |
0 |
0 |
0 |
2. ETP headcount |
2 |
1.00 |
3 |
1 |
1 |
1 |
3. PPP headcount |
3 |
0.97 |
4 |
1 |
1 |
1 |
4. Workforce size |
4 |
0.96 |
5 |
1 |
1 |
1 |
5. Number of workers employed in hazardous working conditions |
5 |
1.01 |
2 |
-3 |
9 |
0 |
6. Sum |
x |
x |
x |
x |
12 |
3 |
7. Spearman test (Ksp) |
0.4 |
|||||
8. Kendall test (Kkn) |
0.4 |
|||||
9. Efficiency of the development of pharmaceutical industry for this set of indicators, % |
49 |
|||||
As Table 5 reveals, the efficiency of development of the RT pharmaceutical industry within the set of labor resources is close to the threshold level of efficiency, to the average value. The main reserve for efficiency increase is decrease in the rate of growth in the number of workers employed in hazardous working conditions in the overall structure of industrial production personnel in the sector.
In accordance with the proposed method, the integral efficiency of development of the RT pharmaceutical industry can be determined using the formula of the geometric mean of partial efficiency indicators, namely (Formula 2):
![]() (2)
(2)
The integral efficiency of development of the pharmaceutical industry of the Republic of Tatarstan in 2010-2014 is calculated in a similar manner, according to formula 2. The final assessment of the efficiency in the context of the sets of the method and the integral efficiency are shown in Figure 3.
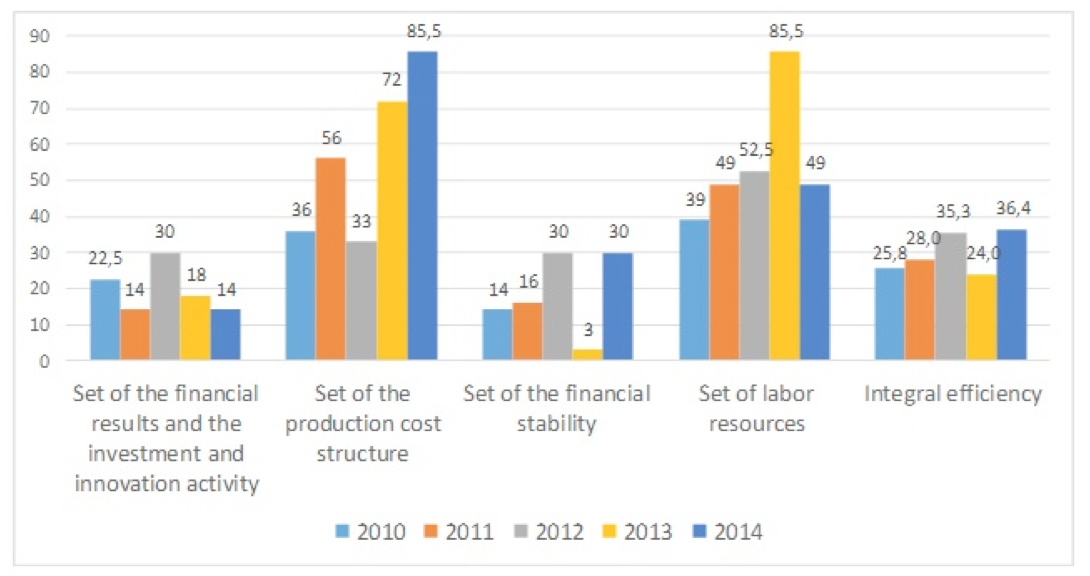
Figure 3 – Assessment of the efficiency of development of the pharmaceutical
industry of the Republic of Tatarstan in accordance with the developed method
to identify priority fields of the cluster formation based on the integral
estimate of the efficiency of sectoral development
The implemented assessment of the efficiency of development of the pharmaceutical industry of the Republic of Tatarstan allowed to make the conclusion that the most stable growth of the indicator in terms of time is the efficiency for the set of the production cost structure. This largely determines the growth of competitiveness in the medium- and long-term perspectives of sectoral development.
The lowest (moreover, steadily low) value of efficiency for the sets of financial results and the investment and innovation activity of the development of the pharmaceutical industry of the Republic of Tatarstan within the selected sets represents a strategic threat. Insufficient efficiency of development of this set in the long term will cause a decline in efficiency for other sets as well: for example, insufficient investment and innovation activity limits the capabilities of rationalization of the cost structure due to the introduction of resource-saving equipment and production technology and administration, aggravates labor automation processes, reduces potential attractiveness of the sector to various external strategic investors.
The developed methodological approach to identification of priority fields of the industrial cluster formation allows to identify the key fields of formation of the adapted mechanisms of development of the industrial sector of the economy, which contribute to largely increasing the level of its integral efficiency. According to the results of the study, such fields in the Republic of Tatarstan are the following:
- a significant increase in the rate of the growth of investment in innovation, primarily thanks to cooperation between enterprises of the pharmaceutical industry and small innovative enterprises from the specialized universities and research institutes of the region, as well as integration with the elements of regional innovation infrastructure;
- an increase in the share of costs for informatization and simultaneous consistent decline in the share of material costs and administrative costs at the expense of the cluster formation;
- a decline in the share of accounts payable in the structure of sources of funding the enterprises of the pharmaceutical industry of the Republic of Tatarstan; and
- evolving processes of involving to the industry and retaining highly skilled engineering and technical personnel, including thanks to strengthening the processes of industrial and educational cooperation with the specialized universities and faculties of the region.
The publication has been prepared as part of the research project No. 16-06-00062 supported by the RFBR.
Kaplan, R.S. and D.P. Norton, 2006. Sbalansirovannaya sistema pokazateley: ot strategii k deystviyu [The Balanced Scorecard: Translating Strategy into Action]. Moscow: Olympus-Business, pp: 294.
Clarke, T., 2001. Balancing the Triple Bottom line: Financial, Social and Environmental Performance. Journal of General Management, 26 (4): 16-27.
Dudkin,V., 1997. Amerikanskiy i zapadnoyevropeyskiy podkhody k indikativnomu planirovaniyu: vozmozhen li sintez na rossiyskoy pochve? [American and West European Approaches to Indicative Planning: is Synthesis Possible on Russian Soil?]. Russian Economic Journal, 10: 99-101
Enright, M.J. and I. Ffowcs-Williams, 2001. Local Partnership, Clusters and SME Globalusation. OECD Workshop Paper, pp: 38.
Gilmullin, A.R., 2009. Strategicheskoye upravleniye razvitiyem regiona na osnove kompleksnoy otsenki effektivnosti funktsionirovaniya ekonomicheskikh podsistem [Strategic Management of the Regional Development Based on the Comprehensive Assessment of Efficiency of the Economic Sub-System Functioning]. Dissertation ... of the Candidate of Economic Sciences. Kazan, pp: 198.
Konovalova, T.A., 2013. Povysheniye effektivnosti ekonomicheskogo razvitiya monogoroda strategicheskogo znacheniya [Improving the Efficiency of Economic Development of a Monotown of Strategic Importance]. Dissertation ... of the Candidate of Economic Sciences. St. Petersburg, pp: 198.
Larina, N.I. and A.A. Kiselnikov, 1998. Regionalnaya politika v stranakh s rynochnoy ekonomikoy [Regional Policy in Market-economy Countries]. Moscow: Economy, pp: 173.
Markov, L.S., M.A. Yagolnitser, and I.G. Teplova, 2010. Funktsionirovaniye i mekhanizmy razvitiya proizvodstvennogo klastera [Functioning and Mechanisms of Development of the Production Cluster]. Region: Economics and Sociology, 1: 287-305.
McConnell, C.R. and S.L. Brue, 2006. Economics. Moscow: INFRA-M, pp: 940.
Official Website of the Tatchempharmpreparaty Company. Date Views 17.01.2017 www.tatpharm.ru.
Porter, M., 2002. Konkurentsiya [On Competition]. Moscow: Publishing House “Williams", pp: 496.
Raeva, Yu.A., 2005. Metodika optimizatsii investitsionnoy strategii (na primere OAO NK “Rosneft'”) [Method for Optimization of the Investment Strategy (by the Example of JSC NK "Rosneft")]. Bulletin of the Financial Academy, 3(35): 110-115.
Safiullin, L.N., A.R. Safiullin and B.Z. Khaziakhmetov, 2011. Strukturnoye issledovaniye konkurentosposobnosti Respubliki Tatarstan [Structural Research of the Competitiveness of the Republic of Tatarstan]. Kazan: CAER ASRT.
Sölvell, Ö., 2003. The Cluster Initiative Greenbook. In The Competitiveness Institute, Eds., Sölvell, Ö., G. Lindqvist and C. Ketels. VINNOVA, Gothenburg, pp: 94. Date Views 16.01.2017 www.cluster-research.org/greenbook.htm.
Syroezhin, I.M., 1980. Sovershenstvovaniye sistemy pokazateley effektivnosti i kachestva [Improvement of Performance and Quality Scorecard]. Moscow: Economics, pp: 192.
Zdunov, A.A., 2009. Metodologiya povysheniya effektivnosti vzaimodeystviya gosudarstvennykh i munitsipalnykh organov pri razrabotke programm sotsialno-ekonomicheskogo razvitiya [Methodology of Improving the Efficiency of Interaction Between the State and Municipal Authorities in the Development of Programs of the Socio-economic Development]. Kazan: Publishing House of the Kazan University, pp: 152.
1. Public Organization "Economic Society of the Republic of Tatarstan", Kazan, Butlerov St., 4, 420012. Email: topleninov@mail.ru
2. Kazan Federal University, Center of Advanced Economic Research Academy of Sciences of the Republic of Tatarstan, Kazan, Kremlevskaya, 18, 420008; Kazan, Ostrovskogo 23, 420111