![]() ISSN 0798 1015
ISSN 0798 1015

![]() ISSN 0798 1015
ISSN 0798 1015
Vol. 38 (Nº 34) Año 2017. Pág. 13
ROJAS, Miguel D. 1; VALENCIA, Maria E. 2; DIAZ, Mónica M. 3
Recibido:16/02/2017 • Aprobado: 23/03/2017
ABSTRACT: Trust games belong to experimental economics and look through controlled situations to understand the behavior of players in a business environment. Based on this new methodology, this paper shows the results of a game played in Medellin, which according the parameters of experimental economy, try to find the relation between the amount sent by an investor and the initial capital available, and returned trust from an anonymous, identifying the parameter that leads this decision taken The organizations profits are associated with earnings less costs. Costs are the value that is paid for a product, pay for a service or maintain the operation of a company. Cost reduction from different disciplines is considered the best strategy to achieve financial goals. In the Colombian public sector, efficiency is related with low costs but generally in public tenders low costs generate overruns in the implementation of state projects, based in Berg´s game. (less tan 80 words). |
RESUMEN: Los juegos de confianza hacen parte de la economía experimental y buscan mediante situaciones controladas conocer el comportamiento de los jugadores en un ambiente económico. Basado en esta nueva metodología se presenta en este artículo los resultados del juego desarrollado en la ciudad de Medellín, que siguiendo los parámetros de la economía experimental, busca conocer si existe relación entre la cantidad enviada por un inversor y el capital inicial disponible y la retribución de la confianza de un depositario anónimo, observando el parámetro que guía esta toma de decisiones del juego originalmente propuesto por Berg. (menor a 80 palabras). |

The experimental economy pretends to predict possible behaviors generated in a controlled economic environment of consumers with defined characteristics in order to know patterns of behavior (Tecnológico de la UJI, 2007).
Some authors like Davis & Holt (2001) have defined experimental economics as a tool that helps to evaluate the predictions of economic theoretical models in controlled situations, through laboratory experiments (Alayon L., 2007).
These experimental economic conditions, have are similar with the economy of the behaviour, but they are different in the emphasis they make on the study of the agent, that means, experimental economics pretends to observe the interaction and behavior between Agents without being treated independently, with a defined model and the rules set out; On the other hand economy of the behavior, based on sciences such as psychology and sociology, studies the behavior of the agent individually (Brandts, J., 2007).
In the experimental economy several trials were carried out that did not have scientific backing and their results neither. Although they were published were not valid enough like the one published by Vernon Smith in 1962 that won the Nobel Prize in 2002. Significant experiments previously performed were developed by:
• Thurstone in 1931 (It was not completely satisfactory since it did not have the stimulus to the participants that motivated them in the decision making) (Espinosa, F., 2008).
• Smith in 1962, making his first approximation, noted that people even without the knowledge of perfect information and how the market works are suspicious and generous (Lynch, M. and Gillespie, N., 2003).
• Ledyard in 1995, through a Public Property Game, showed that the tendency is to contribute in greater quantities to public property than to own property (Brandts, J., 2007).
• Berg, Dickhaut and McCabe in 1995 through an investment game in which a person had to decide whether or not to send money to an anonymous person that you don’t know if will it return the favour or not; They noticed individualistic preferences in the players who must return the favor and confidence of the players who do the favor because they trust although they do not know if there is retribution. This was the first game validated in games of confidence (Brandts, J., 2007).
The lack of validity of some experiments was based on the omission of the induced value that consists in the appropriate use of a prize as an incentive for rational decision-making (Espinosa, F., 2008).
The conditions of the induced value are: monotonicity, dominance, parallelism, notability, privacy (Biel, P. 2006; Arévalo, J. and Ojeda, J., 2004).
One of the branches of the experimental economy is the investment games which tries to test through a hypothesis shown the possible behavior of the players. These games are developed under the parameters of the experimental economy that seeks to define behavior in economic environments in the situations shown (seeking to reject or approve hypotheses) in the controlled experiments (Diaz, M. and Vasquez, D., 2009)
The steps that must be taken into account to validly carry out an investment game are:
• Elaboration of an economic question that seeks to identify the object of study and the methodology that clearly includes the details that define the game (Biel, P., 2006)
• Design of the experiment supported in the hypothesis that explains the event to be studied. It is not sought to replicate exactly the environment studied. The idea is to know the main characteristics and their tools to be able to imitate it and answer the guiding question of the investigation. In this phase you must have decided: number of observations, payments, instructions (Diaz, M. and Vasquez D., 2009)
• Selection of experimental subjects that vary depending on the complexity of the experiment. They could be students, professionals, graduate students or ordinary people, however students are preferred because they have a low opportunity cost, they have a close relationship with experimentalists, they also tend to learn quickly and have no particular interest in the results of the game. Players may be recruited or volunteer participants of the game (Friedman, D. and Sunder, S., 1994)
• Experimental session in which the conditions specified in the instructions must be fulfilled and avoiding errors such as: insufficiency of subjects, computer problems and problems with the payment mechanism (Biel, P., 2006)
• Analysis of the data in which not only the data that were collected but also the conditions in which the data were taken, such as date, demographic, climatic conditions and novelties that could be presented during its execution, should be taken into account (Biel, P., 2006).
• Publication of results where it is necessary to define which part of the results can be made known. A study does not require that all the evidence is public but the most conclusive (Biel, P., 2006).
This experiment was carried out in 1995 by Berg, Dickhaut and McCabe, which was developed in three different classrooms, of which 2 had 32 students each, the first classroom are called inverters, located in room A and those of the second depository, Installed in room B; In a last room were mailboxes where the participants deposited their decisions.
The students in class A had a starting capital which they decided not to invest, while the students in room B received 3 times what the students in room A had sent anonymously to their account and decided to return everything, part or nothing, If he knew where his money was going, guaranteeing anonymity throughout the game, which was developed in a single round (Garcia, J. and Raynal, M. 2003)
In the game, Berg verified that the attitudes of A were very diverse since there were two situations in which the players did not send anything and the amount of money sent by the other 30 players varied of diverse form. The same thing happened with the depositaries since there were cases in which nothing was returned. On average, investors sent more than 5.16 dollars of available 10 dollars and depositors returned 4.66 dollars (Conthe, M., 2008).
The payment function of the game was defined by its decisions during the game since they were taken with real money that means that at the end of both decisions, the money with which each player would remain at the end, would be they final remuneration.
It is a simple game cause the gain would increase with the money you send for both, because there is more capital to distribute, but a very common problem is often presented in the real world: two people can win if they collaborate with each other, but those profits do not arise if their distribution is to the trial of only one of them and the other, distrusts that the distribution is fair.
Subsequent, this experiment was carried out in different countries as follows:
In Colombia, this game was developed by Juan Camilo Cardenas and was made with students who were invited to the game telling them that they could earn a certain amount of money, depending on the decisions they make in the game.
The design of this experiment consisted of informing two anonymous players who could earn an amount of money by making investment decisions to an anonymous player who was in another part of the city and with whom he did not have direct communication despite that the interviewer could communicate with the second player via cell phone.
The number of players used was 160 students from 4 universities in the city of Bogotá.
The amount received by the second player as in the game of Berg, was 3 times the amount sent by the first player (Cardenas, J., 2004).
Table 1. Comparison between the experiments
STUDY |
LOCATION |
STUDENTS |
FRACTION SENT |
FRACTION RETURNED |
UTILITY |
Berg et al. (1995) |
United States |
Yes |
0,52 |
0,3 |
0,9 |
Buchan et al. (2000) |
United States |
Yes |
0,65 |
0,45 |
1,35 |
China |
Yes |
0,73 |
0,5 |
1,51 |
|
Japan |
Yes |
0,68 |
0,5 |
1,51 |
|
South Korea |
Yes |
0,64 |
0,49 |
1,47 |
|
Burks et al. (2003) |
United States |
Yes |
0,65 |
0,4 |
1,31 |
Ashraf et al. (2003) |
United States |
Yes |
0,41 |
0,23 |
0,58 |
Russia |
Yes |
0,49 |
0,29 |
0,8 |
|
Sur África |
Yes |
0,43 |
0,27 |
0,73 |
|
Barr (1999; 2003) |
Zimbabwe |
Yes |
0,43 |
0,43 |
1,28 |
Esnminger (2000) |
Kenya |
No |
0,44 |
0,18 |
0,54 |
Koford (2001) |
Bulgaria |
Yes |
0,63 |
0,46 |
1,34 |
Karlan (2002) |
Peru |
No |
0,46 |
0,43 |
1,12 |
Wilson & Bahry (2002) |
Russia |
No |
0,51 |
0,38 |
1,15 |
Carter & Castillo (2002) |
South Africa |
No |
0,53 |
0,38 |
1,14 |
Lazzarini et al. (2003) |
Brazil |
Yes |
0,56 |
0,34 |
0,8 |
Mosley and Verschoor (2003) |
Uganda |
No |
0,49 |
0,33 |
0,99 |
Schechtr (2003) |
Paraguay |
No |
0,47 |
0,44 |
1,31 |
Burns (2003) |
South Africa |
Yes |
0,33 |
0,23 |
0,7 |
Cárdenas (2003) |
Colombia |
Yes |
0,5 |
0,41 |
1,22 |
Castillo & Carter (2003) |
Honduras |
No |
0,49 |
0,42 |
1,26 |
Danielson & Holm (2003a) |
Tanzania |
Yes |
0,53 |
0,37 |
1,17 |
Suecia |
Yes |
0,51 |
0,35 |
1,05 |
|
Danielson & Holm (2003b) |
Tanzania |
No |
0,56 |
0,46 |
1,4 |
Johansson-Stenman et al. (2004) |
Bangladesh |
No |
0,46 |
0,46 |
1,38 |
From the game, Cardenas concluded that the greater offers of players 1 represented a greater degree of confidence and a greater return, on the part of player 2 represented a high degree of reciprocity.
It can also be detected that the Colombian average in shipments is not far from the international average represented in Table 1. Cardenas also noted that the confidence of players 1 was proportionately paid by seeing an average rate of return of 1.22 pesos per each weight shipped (Cárdenas, J., 2004)
The experiment was carried out at the Faculty of Mines of the National University of Colombia, Medellin. In the experiment and taking into account the hypothesis (to determine if the trust is linked to the money available); with the same two players and the same players and the same environment, changing the initial amounts of money for investors, this being the only significant change compared to the game of Berg and Cardenas, since even for the money received by the depositaries had also the condition of tripling (Diaz, M. and Vasquez, D., 2009).
In the situation recreated in the game the investors had considerable economic solvency and were aware that a student of the National University of low resources asks for a loan to cover the daily expenses. The student states that once he finishes his studies he will repay the money invested. It was the investor's decision how much he was willing to lend to the student.
On the other hand, the situation faced by the depositaries was to pay him or not the money that in his student days received from an anonymous sponsor and thanks to which he was able to finish satisfactorily and have a stable economic position at the moment. All this taking into account that the sponsor during this time has not expected anything in return.
For the validity of games in experimental economics and thus obtain undue and useful results for the researchers according to the initial objective took into account several relevant aspects:
For the study it was decided to use workers from the National University among which are some students who provide services to different areas of the institution. With this it is sought to have a representative sample of the population and by the thematic of the game to identify that confidence is presented when speaking of the members of the National University of Colombia, Medellin.
The number of players chosen was defined based on the number of observations from the first experiment since there is no rule that defines the required number.
Due to the characteristics of the players, an internal call was made through the institutional mail confirming the person interested in participating in their inclusion in the game. To avoid failures with the number of subjects that should be available, the attendance of more than 32 subjects was confirmed.
The payment curve established for the game took into account a proportional remuneration to the decisions taken, considering that two best performances received their payment in the payment curve and the remaining 30 received a payment for the participation equivalent to $ 2,000 COP.
The payment curve was defined by equation: Y = 230 (X) +2000 (1)
Being:
Y = Final remuneration
X = Average percentage sent by investors or average percentage returned by depositors.
The percentages of X were defined then determined the two laps in which the game was made.
Taking into account that the physical spaces where the experiment is developed should not affect the players and with this their decisions, the game was realized in three (3) classrooms of the National University of Colombia. In a classroom were located 16 players who would play the role of depositories, in another 16 are called investors, and an intermediate classroom where 16 envelopes and mailboxes were available for decision making and sent the final decision.
Both parties made the decision in the same room and with the same elements as each person in room A (investors) had its equivalent in room B (depositories) and played in pairs even if they did not know.
The disposition of the players is shown in figure 1. In each room was so that they could not see the performance of their classmates.
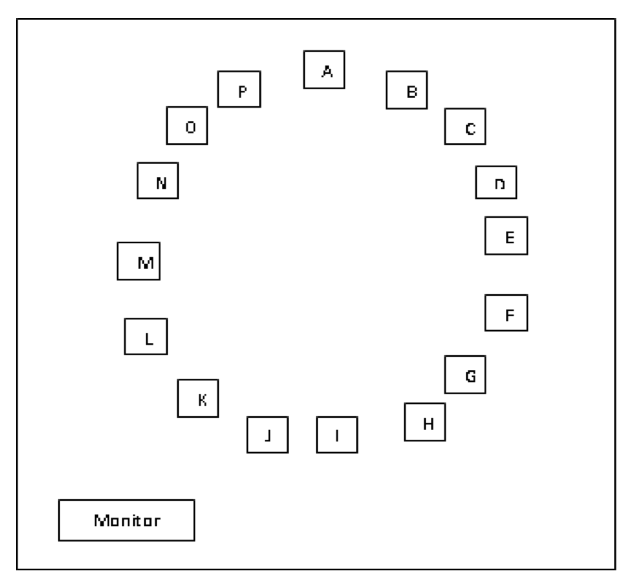
Figure 1. Diagram of the game zone
The hall where the mailboxes had two columns of tables (8 in each column) and in each one was a mailbox identified with a letter (corresponding to each player) to allow the decision taken there was also private. See Figure 2.
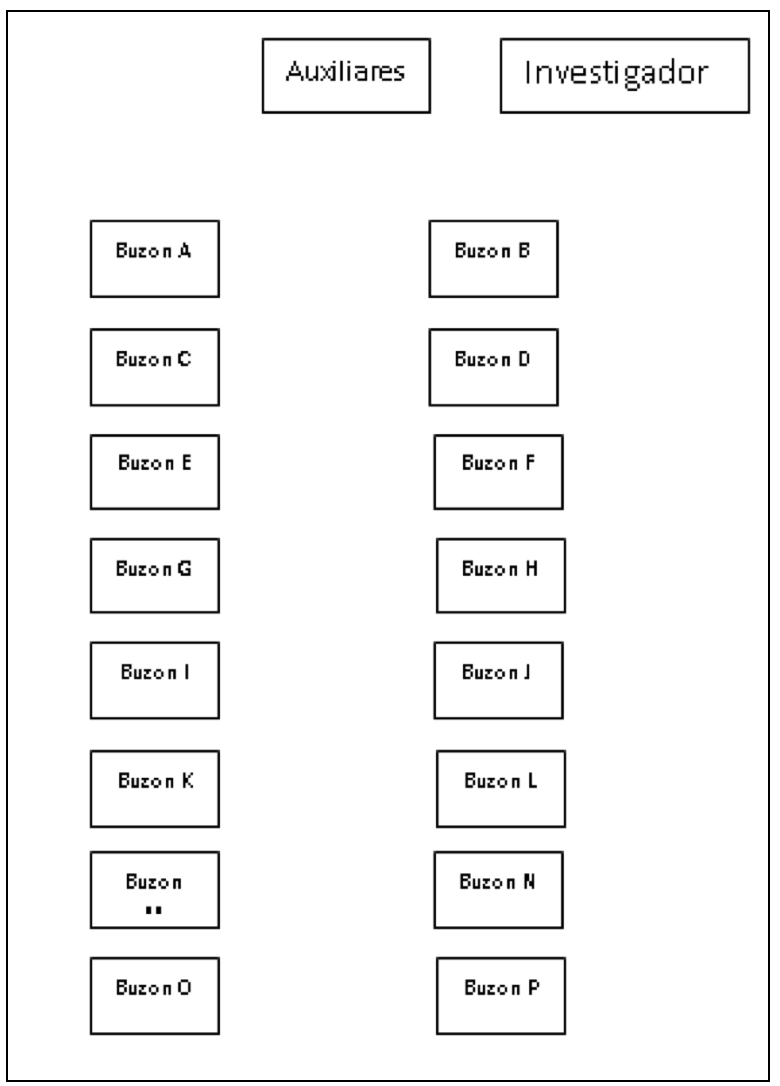
Figure 2. Main room to making decisions
In addition, the anonymity between the players and the theory of induced value must be guaranteed, which were not taken into account in experiments prior to that developed by Berg in 1995, which made them invalid experiments.
The theory of induced value includes concepts of:
• Monotonicity: A higher payment should always be preferred to a lower payment, and subjects should not reach a state of satiety (Biel, P., 2006).
• Dominance: For the participant the incentive in the experiment must be fundamental and become the priority against other influences, making the latter insignificant (Biel, P., 2006).
• Notability: The reward received by the subjects must depend specifically on their actions, according to rules that they know and can understand (Biel, P., 2006).
• Privacy: It refers to the fact that the payment must be secret and thus not enter into discussions of why it was paid more or less (Espinosa, F., 2008).
• Parallelism: Individuals do not need to know the economic phenomenon under study; It is enough that they know the experiment and the set of specific situations that are being studied in this one (Arevalo, J. and Ojeda, J., 2004).
The hypothesis tests evaluated in the experiment are:
3.1 Hypothesis Test 1
Amount sent by investors should increase when they have more money. (%)

Table 2. Hypothesis Testing 1
With the above it is shown that even though the averages presented in sessions 1 and 2 are statistically the same it must be taken into account that they are percentages on different amounts of money, that is, in the second session if there is a Increase in the net amount sent, showing that the amount received initially influences people's trust.
Amount sent by investors should decrease when they have less money (%)

Table 3. Hypothesis Testing 2
The hypothesis is accepted and it is concluded that trust is related to the amount of money available, demonstrating as in hypothesis test 1 that the variation of the money sent is related to the initial capital received.
Amount returned by depositories is higher when they received a larger investment.

Table 4. Hypothesis Testing 3
With the above it is concluded that when the depositaries receive more money they respond to the trust and return more.
The same thing happened when the situation was changed and the amount received was lower showing less retribution to the trust and sending less money.
People (investors or depositors) send money (invest or return) depending on the amount available. In terms of percentage the shipments were statistically equal but in terms of amounts, shipments and returns vary significantly depending on the available capital at the moment of making the decision.
There is a return to the confidence of depositaries in relation to investments made by investors, since in 81% of cases the depositaries returned to the investor part of what they had initially invested The average of the money invested in the first session was 49.8% while in the second session it was 52.4%. Although this difference is not statistically significant and it is considered that the same percentages of shipment were presented by the investors in the two sessions it can be evidenced that if there was learning ie the first return made by the depositaries to the investors influenced the Second investment of these.
The results of this experiment are not far from the ones analyzed by Cárdenas (2004), since there are also shipment rates around 50% and returns varying according to the shipment that was presented (the greater the shipment the greater the return).
It was noted that there is a social reciprocity and given the characteristics of the game, investors showed interest in supporting students to finance their daily college expenses. This scenario and given the characteristics of the players could influence the decision of the investors since these are situations that are frequently presented at the National University and often do not find a sponsorship or resources to continue higher studies.
Alayon, l. (2007). Taller de economía en la clase de economía ecológica. Pontificia Universidad Javeriana. www.javeriana.edu.co/ier/recursos.../economia_ecologica/clases_Laura_Alayon.doc
Arevalo, J; Ojeda, J. (2004) .Riesgo moral y contratos: cierta evidencia experimental. Revista de economía institucional vol. 6 nº 10.
Bardhan, P. (1995). The contributions of endogenous growth theory to the analysis of development problems: An assessment. (J. Behrman & T.N. Srinivasan, Eds.) Handbook of Development Economics (Vol. III). Amsterdam: Elsevier Science BV.
Biel, P. (2006). Economía experimental y teoría de juegos. "economía, sociedad y teoría de juegos". Mcgraw-hill.
Brandts, J. (2007). La economía experimental y la economía del comportamiento. Instituto de análisis económico. http://brandts.iae-csic.org/docs/brandts/EIAF.pdf
Buffa, E., & Taubert, W. (1975). Sistemas de producción e inventario: planeación y control. (Limusa, Ed.). México.
Cardenas, J. (2004). 10 años del juego de la inversión. Colombia. URL: http://www.webpondo.org/10anos.htm.
Congreso de la República. (n.d.). Ley N° 1150. Bogotá, D. C.: Diario Oficial No. 46.691.
Congreso de la República. Ley 42 de 1993. Bogotá, D. C.: Diario Oficial No. 40732
Conthe, M. ( 2008). El juego de la confianza. URL: http://espaicritic.blogspot.com/2008/10/el-juego-de-la-confianza-de-manuel.html
Cuevas Villegas, C. F., Chávez, G., Castillo, J. A., Marino Caicedo, N., & Solarte, W. F. (2004). Costeo ABC. ¿Por qué y cómo implantarlo? Estudios Gerenciales, 20(92), 47–103. Retrieved from http://www.scielo.org.co/scielo.php?pid=S0123-59232004000300003&script=sci_arttext&tlng=pt
Diaz, M; Vasquez, D. (2009). Experimentos sobre juegos de inversión y confianza basados en el juego de berg [tesis de pregrado]. Medellín, Universidad Nacional de Colombia.
Duarte Burgos, C. A., García Martínez, H. A., & Toloza Iraheta, G. (2004). DISEÑO DE UN SISTEMA DE ADMINISTRACIÓN FINANCIERA POR PUNTOS DE ENCUENTRO PARA LOGRAR UNA MEJOR GESTIÓN DE LAS FINANZAS EN LA MEDIANA EMPRESA DE LA INDUSTRIA TEXTIL UBICADAS EN EL ÁREA METROPOLITANA DE SAN SALVADOR. UNIVERSIDAD FRANCISCO GAVIDIA.
Espinosa, F. (2008). Economía experimental, Chile. URL: http://www.zonaeconomica.com/economia-experimental.
Flores, A. (2011). Sociedad, economía y política en el siglo XXI. Bogotá: Editorial McGraw-Hill Interamericana. URL:
http://www.ebooks7-24.com/?il=456
Friedman, D; Sunder S. (1994). Experimental methods: a primer for economists. University of Cambridge. Pp. 10-107
García, O. L. (1999). OBJETIVO BASICO FINANCIERO, FLUJO DE CAJA Y VALOR DE LA EMPRESA. In ADMINISTRACION FINANCIERA-FUNDAMENTOS Y APLICACIONES (Tercera, pp. 2–10). Cali.
Garcia, J; Reynal, M. (2003). Capital social: instrumentos de medida y métrica desde la óptica de un economista. URL: www.econ.upf.edu/~reynal/medicion.doc.
Goldratt, E. M. (2005). 8. In Ediciones Díaz de Santos (Ed.), La Meta (Tercera, p. 420). Monterrey.
Gómez, R. (1998). Presupuesto público colombiano Instrumento para la orientación de la política económica financiera. Bogotá: Universidad Externado de Colombia.
González Correa, F. (2007). MANUFACTURA ESBELTA (LEAN MANUFACTURING). PRINCIPALES HERRAMIENTAS. Revista Panorama Administrativo, 2, 85–112.
Hitt, M., Ireland, D., & Hoskisson, R. (2007). Estrategia de liderazgo en costos. In J. Reyes Martínez & A. Vega Orozco (Eds.), Administración estratégica Competitividad y globalización. Conceptos y casos (Thomson Ed, pp. 115–1130). Santa fe.
Jaramillo, F. (2001). Reestructuración y Valoración de Empresas. (Centro De Investigacion Y Planeamiento Administrativo Ceipa, Ed.) (1st ed.). Medellín.
Lynch, M; Gillespie, N. (2003). El economista experimental. Reason 900
Martínez Cárdenas, E. E., & Ramírez Mora, J. M. (2006, June). La corrupción en la contratación estatal colombiana una aproximación desde el neoinstitucionalismo. Reflexión Política, 8(15), 148–162.
Méndez, J. (2011). La economía en la empresa en la sociedad del conocimiento. Cuarta edición. Editorial McGraw-Hill Interamericana. URL:
http://www.ebooks7-24.com/?il=541
Mokate, K. M. (1999). EFICACIA, EFICIENCIA, EQUIDAD Y SOSTENIBILIDAD: ¿QUÉ QUEREMOS DECIR? “Diseño Y Gerencia de Políticas Y Programas Sociales,” 6. Retrieved from http://www.cepal.org/ilpes/noticias/paginas/9/37779/gover_2006_03_eficacia_eficiencia.pdf
Mokate, K. M. (2004). Los costos. In Evaluación financiera de proyectos de inversión (2a edición, pp. 62–65). Bogotá, D. C.: Alfaomega.
Morrillo, M. (2001). Rentabilidad Financiera y Reducción de Costos. Actualidad Contable FACES, 4(4), 35–48. Retrieved from http://www.redalyc.org/articulo.oa?id=25700404
Organización para la Cooperación y el Desarrollo Económicos. (2015). Estudios económicos de la OCDE COLOMBIA. Retrieved from https://www.oecd.org/eco/surveys/Overview_Colombia_ESP.pdf
Ortega, A. (2010). Hacienda Pública Las finanzas del Estado. Cuarta edición. Bogotá: Ecoe Ediciones.
Pindyck, R., & Rubinfeld, D. (2009). Microeconomía. (A. Cañizal, Ed.) (7th ed.). Madrid: Pearson Educación, S.A.
Porter, M. E. (1998). Estrategiia competitiva: técnicas para el análisis de los sectores industriales y de la competencia. (CECSA, Ed.) (25th ed.). México.
Rother, M., & Shook, J. (1999). Observar para crear valor: cartografía de la cadena de valor para agregar valor y eliminar “muda.” Brookline, Massachusetts, USA: Lean Enterprise Institute.
Smith, A. (1776). La riqueza de las naciones. (C. Rodríguez, Ed.) (Primera). Madrid: Alianza Editorial.
Taha, H. (2004). MODELOS DE INVESTIGACIÓN DE OPERACIONES. In G. Trujano Mendoza & J. Bonilla Talavera (Eds.), Investigación de Operaciones (Séptima, p. 848). Naucalpan de Juárez: Pearson Education, Inc.
Tecnológico de la UJI. (2007). Experimentia Consuting S. L Consultoría Estratégica.
1. Ph. D. Ingeniería, Profesor Asociado, Departamento de Ingeniería de la Organización, Facultad de Minas, Universidad Nacional de Colombia, Director Centro de Investigación y Consultoría Organizacional (CINCO), Sede Medellín, Colombia, Carrera 80 N. 65-223 Bloque M8B oficina 202 Medellín, Colombia, Tel 4255309-4255225. mdrojas@unal.edu.co
2. Magister en Administración, Investigadora Grupo de Investigación Contabilidad Social y Ambiental (CONTAS), Facultad de Ciencias Administrativas, Económicas y Contables, Universidad Católica Luis Amigó, Medellín, Colombia, Transversal 51 A N. 67 B 90, Medellín, Colombia, Tel 4487666 ext. 9723. maria.valenciaco@amigo.edu.co
3. Ingeniera Industrial, Investigadora Centro de Investigación y Consultoría Organizacional (CINCO), Departamento de Ingeniería dela Organización, Facultad de Minas, Universidad Nacional de Colombia, Sede Medellín, Colombia, Carrera 80 N. 65-223 Bloque M8B oficina 202 Medellín, Colombia, Tel 4255225. mmdiaz@unal.edu.co