![]() ISSN 0798 1015
ISSN 0798 1015

![]() ISSN 0798 1015
ISSN 0798 1015
Vol. 38 (Nº 37) Año 2017. Pág. 17
Ana Paulo dos Santos RUBEM 1; João Carlos Correia Baptista SOARES DE MELLO 2; Lidia ANGULO MEZA 3; Silvio Figueiredo GOMES JR 4
Recibido: 08/03/2017 • Aprobado: 15/04/2017
ABSTRACT: Recently, the increase of competition in the air transport sector has changed the market dynamics, leading airlines to seek new strategies to ensure their position. This article aims to analyse the operational performance of Brazilian air carriers in the period from 2007 to 2010 by using an approach which combines DEA with dynamic clusters. The proposal is that distinct groups of airlines of similar sizes are used each time the DEA-CCR classic model is run. At the same time, it is not desirable that the clusters are mutually exclusive as occurs with traditional fixed clusters. The results obtained with this combined approach are compared to those of the DEA-BCC classic model. |
RESUMO: Nos últimos anos, o aumento da concorrência no sector dos transportes aéreos alterou a dinâmica do mercado, levando as companhias aéreas a procurarem novas estratégias para garantir a sua posição. Este artigo tem como objetivo analisar o desempenho operacional das transportadoras aéreas brasileiras no período de 2007 a 2010, utilizando uma abordagem que combina DEA com clusters dinâmicos. A proposta é que grupos distintos de companhias aéreas de tamanhos semelhantes sejam usados cada vez que o modelo clássico do DEA-CCR é executado. Ao mesmo tempo, não é desejável que os clusters sejam mutuamente exclusivos, como acontece com os clusters fixos tradicionais. Os resultados obtidos com esta abordagem combinada são comparados com os do modelo clássico DEA-BCC. |

Since the beginning of the 1990s, the Brazilian air transport sector has faced significant structural changes. The sector has witnessed a process of deregulation, breaking with the policy in force implemented at the end of the 1960s, in which the structure and conduct of the market were strongly controlled (Lima et al., 2011). The process began with the abolition of the regional monopolies in 1992. This stimulated the entry of new operators, as well as price competition, with the definition of tariff bands, which increased competition among the companies. 2001 saw complete price liberalization, greater flexibility in the processes governing the entry of new companies and requests for new air lines, flight frequencies and planes, resulting in the entry of Gol Linhas Aéreas in January of that year, the first low cost carrier in the country (Evangelho et al., 2005). An analysis of international low cost performances was carried out by Chang and Yu (2012).
The first signs of a reduction in competition were seen with the code-share between Varig and TAM (Soares de Mello et al., 2009). This trend grew in 2006 with the difficulties faced by Varig, which ended up being bought by Gol. There then began a phase of mergers in the air transport sector with a gradual reduction in competition and the installation of what is almost a duopoly in the sector, a situation which has lasted until today, characterised by the attempts of some companies to establish themselves in the market.
In recent years a lot of work has been carried out on the evaluation of the efficiency of Brazilian airline companies using DEA (Data Envelopment Analysis). In a large part of these studies, the BCC model (Banker et al., 1984) is used, owing to the accentuated difference between the sizes of the companies. However, the BCC model has increasingly become a target for criticism, which will be covered in section 3. As the classic CCR model (Charnes et al., 1978) cannot be used for DMU of very different sizes, an alternative is to use groupings or clusters, in order to identify groups of companies of similar sizes.
As the use of traditional techniques of clustering can bring some disadvantages, this work proposes the use of dynamic clusters (Bana e Costa et al., 2002; Po et al., 2009; Appa et al., 2010), so called to differentiate them from fixed clusters. In order to make comparisons solely between companies of similar sizes, thus ensuring the appropriate use of the CCR model, the proposal is to use distinct clusters of companies of similar sizes to that under evaluation each time that the CCR model is run. The proposal is that each time the CCR model is run the company under analysis will not be compared with others which are significantly different to it. At the same time, it is not desirable that the clusters are disjoint sets such as occurs with fixed clusters.
The aim of this work is to analyse the operational performance of Brazilian airline carriers in the period 2007 to 2010. We use a model similar to the one used by Correia et al. (2011). We evaluate the use of the airline’s fleet for an evaluation is carried out of the use of the fleets of for cargo and passenger transport in national and international flights. For this purpose, we proposed an approach which combines dynamic clusters with the DEA-CCR model.
This article is organised as follows: in section 2 there is a review of the use of DEA in air transport; Section 3 presents criticism of the BCC model; Section 4 describes the approach which combines the formation of dynamic clusters with the use of the DEA-CCR model; Section 5 shows the modelling of the problem; and in section 6, the results are presented and discussed. Lastly, the conclusions and suggestions for future works are described in section 7.
The capacity of Data Envelopment Analysis (Charnes et al., 1978) to deal with problems involving multiple inputs and products, in addition to the simplicity of the assumptions underlying the model, have made it a method widely used to evaluate the efficiency of the air transport sector, since the beginning of the 1990s. Without any pretensions of providing an exhaustive list, some of the applications are mentioned here.
A large part of the DEA applications in the air transport sector are conducted with the aim of evaluating airports. The most recent articles on this subject are Chi-Lok and Zhang (2009), Chang et al. (2013) and Suzuki et al. (2012). In relation to Brazilian airports the articles by Fonseca et al. (2010) and Pacheco, Fernandes and Santos (2006) stand out.
Concerning the evaluation of airline carriers, Schefczyk (1993) used DEA to evaluate the operational performance of airline carriers, finalising the study with an analysis of the strategic factors related to profitability and performance in the airline sector. Another non-financial approach for the performance evaluation of Latin-American airline companies is found in Charnes et al. (1996). Meanwhile, Adler and Golany (2009) used a model which encompasses financial and non-financial aspects. Studies which used DEA to analyse the efficiency of the capital structure of companies in the Brazilian airline sector are to be found in Capobianco and Fernandes (2004) and Fernandes et al. (2008). With a focus on operational aspects, Soares de Mello et al. (2003) applied classic DEA models to calculate the efficiency of the Brazilian companies in relation to passenger air transport. In addition to this, they determined the benchmarks of each company with a multi-objective DEA model. Araújo et al. (1999) evaluated the operational performance of the main Brazilian commuter airlines with an emphasis on the main production factors (manpower, capital and fuel). Correia et al. (2011) applied a variation of the Fuzzy DEA model to analyse the efficiency of airline companies. The identification of benchmarks and anti-benchmarks with the DEA model which takes into account passenger transport, cargo transport, the fleet and personnel was made by Silveira et al. (2012b). With the same inputs and outputs, Silveira et al. (2012a) adapted the MCDEA model for variable returns of scale and included the segmentation of the companies into fixed clusters. As in other circumstances Soares de Mello et al. (2013), Silveira et al. (2012a) confirmed that the BCC model can generate negative efficiencies when applied together with the MCDEA model. However, it was possible to find a set of years in which the data did not generate this problem.
Classic DEA (Data Envelopment Analysis) models determine the efficiency of productive units, called DMUs (decision making units).
In DEA, there are two models which are considered classic. The first model, originally proposed by Charnes et al. (1978) is known as CCR, from the initials of its authors. The CCR model presupposes constant returns to scale, that is, any variation in the inputs produces a variation of equal proportion in the outputs, for this reason it is also known by the acronym CRS (Constant Returns to Scale). The CCR model obeys the property of the unbounded ray (Cooper et al., 2007), which assumes the constant proportionality between inputs and outputs, suitable to deal with similar DMUs.
The CRS assumption of the CCR model is only suitable when all the DMUs are operating at an optimum scale. Imperfect competition or any types of economic, financial or regulatory restrictions mean that the unit is not operating at an optimum scale. In these cases, in DEA approaches, this situation is commonly overcome by adopting the model developed by Banker et al. (1984), which incorporates the assumption of variable returns to scale, and is therefore known as VRS (Variable Returns to Scale).
Frequently, the BCC model is used to overcome the problem of comparisons involving DMUs of very different sizes, although it was not designed for this specific purpose. In addition to the occasionally unsuitable application of the BCC model, it is possible to identify some fundamental flaws in its algebraic formulation: inappropriate comparisons; inappropriate classification as efficient units; and implicit negative efficiencies in the mathematical models.
In relation to inappropriate comparisons, due to the convexity restriction, the BCC model does not allow multiples of DMUs to be used as references. However, any fraction of a DMU, no matter how small it is, can be used in the formation of a benchmark, which can lead to the comparison of a DMU with fractions of other, much larger, DMUs. In addition, depending on the orientation, a DMU can be compared with a much smaller DMU or with much larger DMUs.
Concerning the unsuitable classification of DMUs as efficient, it is worth highlighting that in the BCC model if one DMU is the only one to use the smallest quantity of a determined input or the only one producing the greatest quantity of a certain output, it will be deemed efficient. This DMU is called efficient by default (Gomes et al., 2012a).
Another problem of the BCC model is that its restrictions do not guarantee the desired properties for an efficiency index. In fact, in the BCC model there are negative values for the efficiencies which are not normally apparent. Nevertheless, these negative values can appear in situations such as Cross Evaluation (Soares de Mello et al., 2013) or non-radial projections (Gomes Junior et al., 2013).
In consequence of the reasons cited above, this article proposes the use of a hybrid approach, introduced by Bana and Costa (2002), Appa et al (2010), which combines the technique called dynamic clusters with the DEA-CCR model, for the efficiency analysis of Brazilian air transport companies, in order to avoid the controversial use of the DEA-BCC model.
The DEA models have been shown to be suitable for the efficiency analysis of production units using multiple inputs (supplies, resources) and multiple outputs (products). These production units are, generally, referred to as decision making units, or simply DMUs. The relative efficiency is calculated for each DMU, comparing the inputs and outputs levels with all the other DMUs. The result is the construction of an envelope surface or Pareto-efficient frontier. The DMUs which lay on the frontier determine the envelope and are considered efficient. The remaining DMUs are considered to be inefficient.
As it is not appropriate to suppose that the Brazilian air carriers operate in similar scales, in this study a hybrid approach will be used which combines the technique of dynamic clusters with the DEA methodology, more specifically the CCR model. With this hybrid approach we avoid a possible inappropriate use of the BCC model.
The use of the CCR model implies constant returns to scale and the assumption of the unbounded ray axiom (Cooper et al., 2007). In other words, the CCR model only compares DMUs operating in similar conditions and scale. Thus, as the classic CCR model is not applied to the evaluation of DMUs of very different sizes, an alternative is the use of the clusters technique, in order to identify groups of DMUs of similar sizes.
Whenever we talk of clusters, we think of the division of data into disjoint sets (fixed clusters), heterogeneous among themselves but internally homogenous. In this paper the terms heterogeneous and homogenous refer exclusively to the size of the DMUs and, therefore, the heterogeneity does not invalidate the application of DEA. Generally, approaches which combine DEA and classic clustering create fixed sets according to structural or environmental criteria in order to, later, apply the DEA models with constant returns to scale.
However, when the aim is to calculate efficiency index, the use of classic clustering has been questioned as it presents some disadvantages. One of these is that although a company (DMU) can be similar to other companies belonging to its cluster, it is possible that there are companies in other fixed clusters similar to it and that, therefore, they should also be considered in the calculation of its technical efficiency. In fact, two companies located at opposite locations of the same cluster may have a greater Euclidian distance between them than between other companies of other clusters.
In addition, the number of companies in some of the fixed clusters can be too small to permit a meaningful comparison between the respective efficiencies. This is because, in classic DEA approaches, in order to obtain reliable results, the quantity of DMUs must be, at least, equal to three times the total number of variables (inputs and outputs), according to the empirical results presented in Banker et al. (1989). Another criticism of fixed clusters in DEA is the impossibility of comparing all the DMUs among themselves. Nevertheless we shall note that are recent studies to compare DMUs in distinct clusters (Gomes et al., 2012b). On the other hand, using dynamic clusters, provided that no cluster is disjoint in relation to all the others, this comparison can be made, although in an indirect form.
The study of a way to overcome the problems described above is an integral part of the work of Bana e Costa et al. (2002), Po et al. (2009) and Appa et al. (2010) who discuss the choice of returns to scale for the DEA model. In these works the authors demonstrate the advantages of the use of constant returns to scale, combined with the creation of dynamic clusters. They propose that in order to measure efficiency using a DEA-CCR model, a cluster of similar DMUs is formed for each DMU under evaluation. In this way, the DMU under evaluation is not compared with others which are in significantly different conditions but with similar DMUs. When using dynamic clusters with the DEA-CCR model, although the axiom of unbounded ray is not strictly verified, it is verified approximately.
For the formation of the n dynamic clusters (equal to the total number of DMUs), it is sufficient to define a criterion of similarity which selects the DMUs in the vicinity of the DMU0 (DMU under evaluation). It is important to highlight that the DMUs can have the possibility of belonging to more than one cluster at the same time to avoid the formation of disjoint clusters. It should be noted that a DMUk can belong to the dynamic cluster, DC, of the DMU0 but this does not necessarily imply that the DMU0 also has to belong to the DC of the DMUk.
Once the dynamic cluster for the DMU0 has been formed, the DEA-CCR model proposed is then applied to the DC0 in order to determine DMU0 efficiency.
There are various possibilities for creating dynamic clusters. In the first place it should be noted that it is possible to create clusters using only one criterion or various criteria. It is also possible to determine the size of the clusters in at least two different ways: fixing a minimum number of DMUs in each cluster or fixing the maximum distance in relation to the central DMU of the cluster (DMU0). In this work, the first alternative will be adopted in order to avoid forming clusters with an insufficient number of DMUs for DEA use. It should be noted that although the efficiency of all the DMUs of the cluster is calculated, only the efficiency of the DMU0 of each DC is considered.
This study seeks to evaluate the operational performance of Brazilian airline companies, in terms of the fleet use for cargo and passengers transport, in national and international flights. Optimisation of the fleet avoids the idleness of the airplanes, being one of the factors which contributes to the reduction of operational costs and consequently to an increase in the company’s profits.
In this way, the inputs are the resources used by each company for service operationalization. In this model we take into account only the main capital goods of these companies – the airplanes. However, each company uses different airplanes models with different transport capacities. Therefore the input used is the maximum take-off weight for each company as proposed by Correia et al. (2011). Here the maximum take-off weight represents the sum of the maximum take-off weights of all the airplanes belonging to the company. Thus, this variable simultaneously takes into account the number of planes and their capacity.
The service offered by each airline is the passengers and cargo transport. Therefore the outputs of the model must be linked to these two variables. Thus, the number of passengers carried times the kilometres flown (Pax.km) and tons carried times kilometres flown (Ton.km).
The modelling adopted in this article measures the capacity of a company to use the fleet it possesses in an efficient way, in other words, its ability to make its airplanes fly frequently, with high occupation, covering large distances. We use an input orientation in order to evaluate the companies which have the capacity to reduce their fleet with no reduction in the outputs.
The period of study is from 2007 to 2010. The data was taken from the Annual Statistics of Air Transport available on the Agencia Nacional de Avaliação Civil – Brazilian Air Transport Authority (ANAC, 2007, 2008, 2009, 2010). The model’s DMUs consist of regular air cargo and passenger transport airlines, considering the same company to be a separate DMU in different years. This is one of the ways to increase the number of DMUs, as suggested by Podinovsky and Thanassoulis (2007) and is used for time analyses, such as in Soares de Mello et al. (2003), among others.
We begin our study in 2007 due to the fact that it was the year following a serious crisis in the national air sector. Such a crisis was caused primarily by the bankruptcy of the market leader in the airline sector (Varig) and by the crash of a Gol airplane. Thus, in order to have greater consistency in the data, the choice was made to analyse years with similar characteristics. Up until the time of the completion of this article, data related to 2011 has not been made available on the ANAC site.
We will use a one-dimensional criterion for creating the dynamic clusters, DC, based on the Euclidian distances. This distance is calculated in relation to the input variable of our model, i.e., the maximum take-off weight of each company. To avoid very small clusters as well as to meet the empirical rule of Banker et al.(1989), a minimum number of DMUs in each cluster was defined, greater or equal to three times the numbers of the variables of the model - nine DMUs. In this way, the nine DMUs with input closest to the input of the DMU0 form the DC0. In the case of a tie involving the ninth DMU furthest from the DMU0, all the DMUs tied with the ninth will form part of the DC. We shall note that, it is possible that there are DCs with more than nine DMUs, despite the fact that the clusters were initially defined with only nine DMUs.
The proposed approach was applied to the 88 DMUs which represent the regular Brazilian airlines carrying cargo and passengers in the period from 2007 to 2010. It is important to highlight that the data on the fleets belonging to the companies Azul, Skymaster and Varig Log are not included in the annual report for 2008, although Azul had begun to operate in December and the companies Skymaster and Varig Log had published their air cargo transport results for the same year. The data for the Cruiser fleet are not included in the 2009 annual report, in spite of the company having published its air cargo and passenger transport results for the year. The data for the fleets of the companies Air Minas, Beta and TAF were not made available in the 2010 annual report. Air Minas published its results for air cargo and passenger transport between January and May 2010, the moment when it suspended operations. Beta published its results until the month of July 2010, and TAF presented its volume of cargo transport only for the month of January of the same year. The non-publication of data on the fleet in terms of operations during the year made it impossible to include the aforementioned companies in the study in the respective years. The distribution of frequency for the sizes of the clusters is presented in Table 1.
Table 1. Distribution of frequency of the sizes of dynamic clusters
Number of DMUs of the DC |
Absolute frequency |
Relative frequency |
9 |
65 |
73.86% |
10 |
19 |
21.59% |
11 |
3 |
3.41% |
13 |
1 |
1.14% |
Total |
88 |
100.00% |
Having defined the 88 DCs, the DEA-CCR model is applied to each DC, obtaining the efficiency of each central DMU using the SIAD (Sistema Integrado de Apoio à Decisão – Integrate Decision Support System) software of Angulo-Meza et al. (2005). Table 2 presents the efficiency scores of the airline companies. In this table we present the results of the modelling using the DEA-CCR model and dynamic clusters as well as the results of the classic DEA-BCC model. In this table, the efficient DMUs in our approach are highlighted in red.
In our approach, the number of efficient DMUs is greater than in the DEA-BCC model. This is counter intuitive results and it happens due to the fact that the calculations with CCR model are performed with a fewer number of DMUs when compared to the calculations of the BCC model. As a matter of fact, 20 DMUs (22.73%) were identified as efficient among the 88 analysed. On the other hand, when opting for the use of the classic BCC model only six airlines (6.82%) would be considered efficient.
Table 2. Efficiency scores of the Brazilian airline carriers – 2007 to 2010.
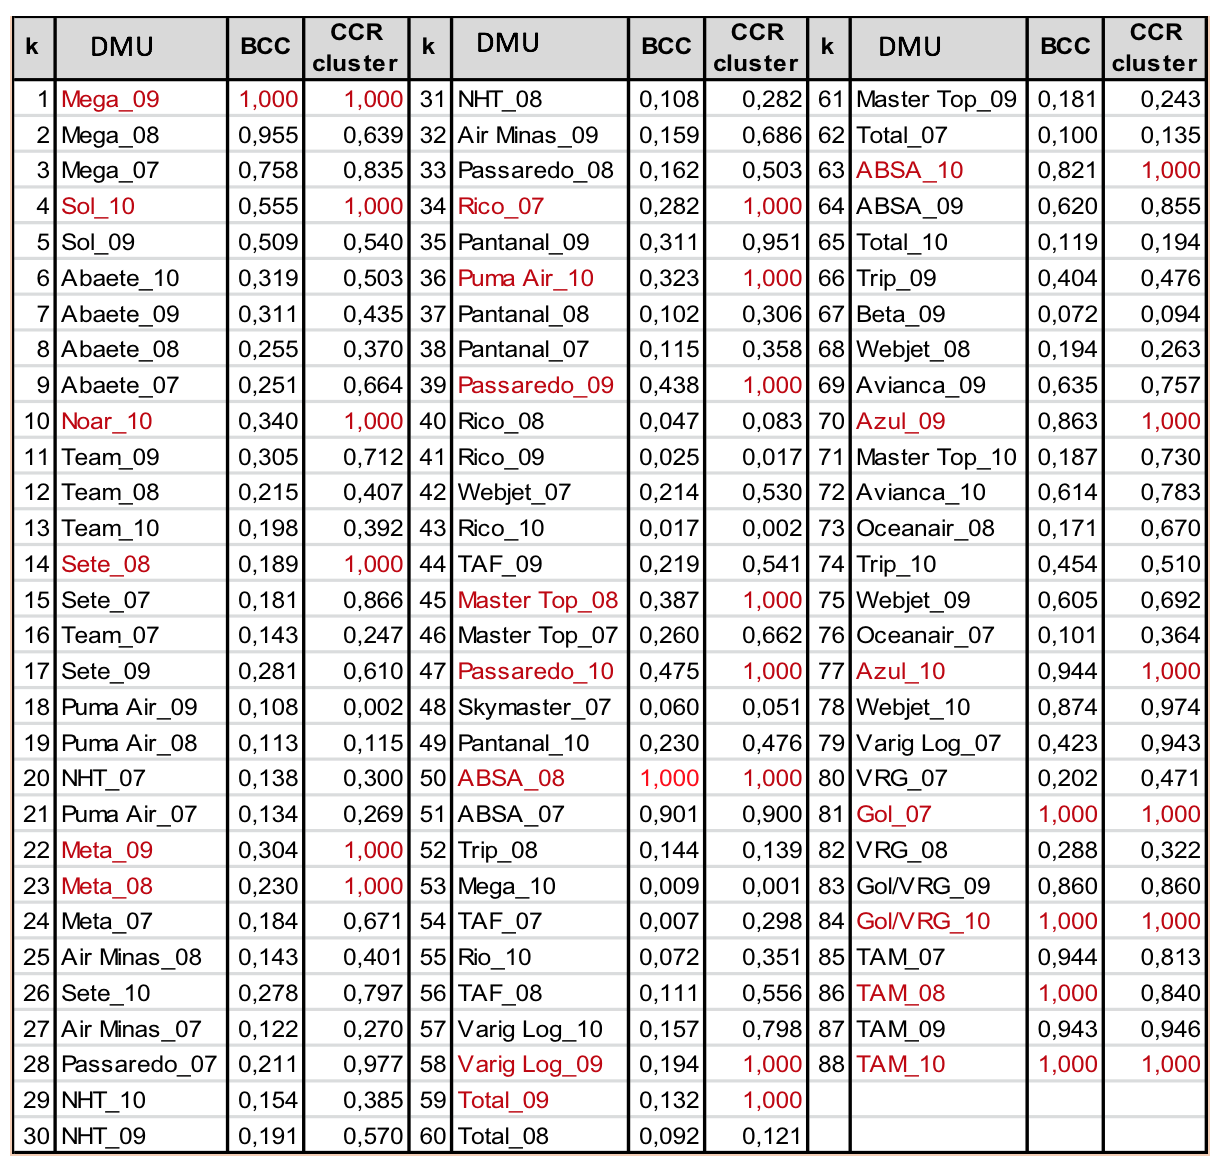
Generally, the DEA-CCR model with dynamic clusters obtained higher efficiency scores than those obtained with the classic DEA-BCC modelling. The exceptions are: Rico and Mega, in 2010; Puma Air and Rico, in 2009; Trip and TAM, in 2008; and ABSA, in 2007. Specifically, TAM in 2008 is the only DMU which is classified as efficient in the BCC modelling and it becomes inefficient with CCR model and dynamic cluster.
Of the six BCC efficient DMUs we can note that Mega, in 2009, was considered efficient for being a so-called efficiency by default, by having the smallest input level. Other efficient DMUs are Gol and TAM in some years. These DMUs are efficient because they are the largest Brazilian airlines. Likewise ABSA is efficient because is the largest Brazilian cargo airline. Among them, TAM, in the year 2010, was efficient for having the largest value in both outputs (number of passengers carried times kilometre and tonnes carried times kilometres). It is worth highlighting that the DMU efficiency by default in the BCC model were also efficient in the approach proposed. In this way, we can deduce that, in this case, the DMUs which are efficient by default are truly efficient.
The current study provided the evaluation of the operational performance of Brazilian airlines from a different point of view, in which the original DEA-CCR model was used combined with dynamic clusters technique.
The critical analysis of the DEA-BCC model led to the use of the DEA-CCR formulation with dynamic clusters in order to avoid making comparisons between airlines of significantly different sizes, while permitting companies of similar sizes to be compared one with another. The use of dynamic clusters, as opposed to fixed clusters, presented the advantage that the dynamic groupings are not mutually disjoint, which means that all the DMUs can be compared with each other even if in an indirect way.
Combined with the DEA-CCR model, the use of dynamic clustering contributed to an improvement in the discrimination of airlines of different sizes, making it possible to evaluate small and medium sized companies more effectively by comparing them solely like with like, thus making it possible to identify the best practices within each segment.
It is important to highlight that the other models which could apparently be used present serious disadvantages. One of the models most commonly referred to is the model of categorical variables (Banker and Morey, 1986). This model performs an implicit clustering of the DMUs and only considers environmental variables, comparing each DMU only with those that operate in worse environments. The dynamic cluster model can work both with environmental variables and variables of size and does not imply any judgement of better or worse environments, only similar ones. In addition to this, the dynamic cluster model, as it also works with variables related to size, can be used to avoid the disadvantages of the BCC model, which is impossible to do with the categorical variables model. The categorical variables model also has other limitations as shown in Silveira et al (2012b).
With the use of the dynamic clusters model small and medium sized companies, such as Sol and Noar, in 2010, and Meta, in the years 2008 and 2007, can be evaluated adequately, being compared with similar companies, making it possible to identify the best practices in the segment to which they belong.
A possible extension to this work would be to include the application of the principles of fuzzy sets, a methodology recommended for dealing with the poor quality of data available in the Brazilian air sector, such as that carried out in Correia et al. (2011).
In future works, the intention is to study the coherence of the efficiencies and benchmarks obtained.
We thank CNPq and FAPERJ for their financial support.
ANAC. Anuários estatísticos do transporte aéreo 2007 [cited março de 2013. Available from http://www.anac.gov.br/.
ANAC. Anuários estatísticos do transporte aéreo 2008 [cited março de 2013. Available from http://www.anac.gov.br/.
ANAC. Anuários estatísticos do transporte aéreo 2009 [cited março de 2013. Available from http://www.anac.gov.br/.
ANAC. Anuários estatísticos do transporte aéreo 2010 [cited março de 2013. Available from http://www.anac.gov.br/.
Angulo-Meza, L., Biondi Neto, L., Soares de Mello, J. C. C. B. and Gomes, E. G. (2005). Isyds - integrated system for decision support (siad sistema integrado de apoio a decisão): A software package for data envelopment analysis model. Pesquisa Operacional, 25 (3), 493-503.
Appa, G., Bana e Costa, C. A., Chagas, M. P., Ferreira, F. C. and Soares, J. O. (2010). Dea in x-factor evaluation for the brazilian electricity distribution industry. In Working Paper LSEOR 12-121: London School of Economics, U.K., 44.
Appa, G. and Yue, M. (1999). On setting scale efficient targets in dea. Journal of the Operational Research Society, 50 (1), 60-69.
Bana e Costa, C. A., Ferreira, F. C., Chagas, M. P. and Appa, G. (2002). Metodologia de análise de desempenho operacional de concessionárias de distribuição de energia elétrica - relatótio final. Rio de Janeiro: Fundação Padre Manuel França, PUC,.
Banker, R. D., Charnes, A. and Cooper, W. W. (1984). Some models for estimating technical scale inefficiencies in data envelopment analysis. Management Science, 30 (9), 1078-1092.
Banker, R. D., Charnes, A., Cooper, W. W., Swarts, J. and Thomas, D. (1989). An introduction to data envelopment analysis with some models and their uses. Research in Governmental and Non-Profit Accounting, 5, 125-163.
Banker, R. D. and Morey, R. C. (1986). Use of categorical variables in data envelopment analysis. Management Science, 32 (12), 1613-1627.
Capobianco, H. M. P. and Fernandes, E. (2004). Capital structure in the world airline industry. Transportation Research Part a-Policy and Practice, 38 (6), 421-434.
Chang, Y., Yu, M. and Chen, P. (2013). Evaluating the performance of chinese airports. Journal of Air Transport Management, 31(1): 19-21. DOI: 10.1016/j.jairtraman.2012.11.002.
Chang, Y. C. and Yu, M. M. (2012). Measuring production and consumption efficiencies using the slack-based measure network data envelopment analysis approach: The case of low-cost carriers. Journal of Advanced Transportation. DOI: 10.1002/atr.198.
Charnes, A., Cooper, W. W. and Rhodes, E. (1978). Measuring the efficiency of decision-making units. European Journal of Operational Research, 2, 429-444.
Charnes, A., Gallegos, A. and Li, H. (1996). Robustly efficient parametric frontiers via multiplicative dea for domestic and international operations of the latin american airline industry. European Journal of Operational Research, 88 (3), 525-536.
Chi-Lok, A. Y. and Zhang, A. (2009). Effects of competition and policy changes on chinese airport productivity: An empirical investigation. Journal of Air Transport Management, 15 (4), 166-174.
Cooper, W. W., Seiford, L. M. and Tone, K. (2007). A comprehensive text with models, applications, references and dea-solver software. Springer. New York.
Correia, T. C. V. D., Soares de Mello, J. C. C. B. and Angulo-Meza, L. (2011). Eficiência técnica das companhias aéreas brasileiras: Um estudo com análise envoltória de dados e conjuntos nebulosos. Produção, 21 (4), 676-683.
Evangelho, F., Huse, C. and Linhares, A. (2005). Market entry of a low cost airline and impacts on the brazilian business travelers. Journal of Air Transport Management, 11 (2), 99-105.
Fernandes, E., Pires, H. M., Lins, M. P. E. and Silva, A. C. M. (2008). Financial performance of air transport companies: An analysis of the non-pareto-efficient space in data envelopment analysis. Paper read at WIT Transactions on Information and Communication Technologies.
Fonseca, A. B. d. M., Soares de Mello, J. C. C. B., Gomes, E. G. and Angulo-Meza, L. (2010). Uniformization of frontiers in non-radial zsg-dea models: An application to airport revenues. Pesquisa Operacional, 30 (1), 175-193.
Gomes, E. G., Abreu, U. G. P. d., Soares de Mello, J. C. C. B., de Carvalho, T. B. and de Zen, S. (2012a). Dea performance evaluation of livestock systems in brazil. In Data envelopment analysis and its applications to management, edited by Charles, V.andKumar, M. Newcastle upon Tyne: Cambridge Scholars Publishing, 224-238.
Gomes, E. G., Soares de Mello, J. C. C. B. and Freitas, A. C. R. (2012b). Efficiency measures for a non-homogeneous group of family farmers. Pesquisa Operacional, 32 (3), 561-574.
Gomes Junior, S. F., Soares de Mello, J. C. C. B. and Angulo-Meza, L. (2013). Dea nonradial efficiency based on vector properties. International Transactions in Operational Research, 20 (3), 341-364.
Lima, V. S., Soares de Mello, J. C. C. B. and Angulo-Meza, L. (2011). Cost-benefit analysis in selected air trips using a non parametric method. African Journal of Business Management, 5 (21), 9678-9685.
Pacheco, R. R., Fernandes, E. and Santos, M. P. D. (2006). Management style and airport performance in brazil. Journal of Air Transport Management, 12 (6), 324-330.
Podinovski, V. V. and Thanassoulis, E. (2007). Improving discrimination in data envelopment analysis: Some practical suggestions. Journal of Productivity Analysis, 28 (1-2), 117-126.
Schefczyk, M. (1993). Operational performance of airlines: An extension of traditional measurement paradigms. Strategic Management Journal, 14, 301-317.
Silveira, J. Q., Soares de Mello, J. C. C. B. and Angulo-Meza, L. (2012a). Evaluación de la eficiencia de las compañias aéreas brasileñas a través de un modelo híbrido de análisis envolvente de datos (dea) y programación lineal multiobjetivo. Ingeniare, 20 (3), 331-342.
Silveira, J. Q., Soares de Mello, J. C. C. B. and Angulo-Meza, L. (2012b). Identificação de benchmarks e anti-benchmarks para companhias áereas usando modelos dea e fronteira invertida. Produção, 22 (4), 788-795.
Soares de Mello, J. C. C. B., Angulo-Meza, L., Gomes, E. G., Serapião, B. P. and Lins, M. P. E. (2003). Análise de envoltória de dados no estudo da eficiência e dos benchmarks para companhias aéreas brasileiras. Pesquisa Operacional, 23 (2), 325-345.
Soares de Mello, J. C. C. B., Angulo Meza, L., Silveira, J. Q. and Gomes, E. G. (2013). About negative efficiencies in cross evaluation bcc input oriented models. European Journal of Operacional Research, 229 (3), 732-737.
Soares de Mello, P. H. C., Soares de Mello, J. C. C. B. and Angulo-Meza, L. (2009). Misunderstandings due to a codeshare between two brazilian airlines in rio de janeiro international airport. Rio´s International Journal on sciences of industrial and systems engineering and management, 3 (1), 2.
Suzuki, S., Nijkamp, P., Pels, E. and Rietveld, P. (2012). Comparative performance analysis of european airports by means of extended data envelopment analysis. Journal of Advanced Transportation. DOI: 10.1002/atr.204.
1. Holds a degree in Production Engineering, a master's degree in Statistics and a Ph.D. in Production Engineering from Federal Fluminense University (UFF). CASNAV - Centro de Análise de Sistemas Navais. anarubem@bol.com.br
2. Holds a degree in Mechanics Engineering and a master’s degree in Mathematics from the Federal Fluminense University (UFF) and a Ph.D. in Production Engineering from COPPE Federal University of Rio de Janeiro (COPPE/UFRJ). Departamento de Engenharia de Produção, Universidade Federal Fluminense (UFF). jccbsmello@id.uff.br
3. Holds a degree in Operational Research from Universidad Nacional Mayor de San Marcos (UNMSM), master's degree and Ph.D. in Production Engineering both from COPPE Federal University of Rio de Janeiro (COPPE/UFRJ). Departamento de Engenharia de Produção, Universidade Federal Fluminense (UFF). lidiaangulomeza@id.uff.br
4. Holds a degree in Mathematics and in Civil Engineering, a master's degree at Production Engineering and a Ph.D. degree in Production Engineering from Universidade Federal Fluminense (UFF). Centro Universitário Estadual da Zona Oeste (UEZO). silviogomes@uezo.rj.gov.br