![]() ISSN 0798 1015
ISSN 0798 1015

![]() ISSN 0798 1015
ISSN 0798 1015
Vol. 38 (Nº 39) Año 2017. Pág. 21
Romero ROCHA 1
Recibido: 29/03/2017 • Aprobado: 25/04/2017
ABSTRACT: The aim of this paper is to verify if an aging workforce is a burden to the firms, in the sense that the firm pays more than the marginal productivity for older workers. To do this I calculate the effect of an aging workforce on productivity, and on wages. I find that firm productivity declines with age and with seniority, but wages strongly increase with seniority, although they remain stable with age. This result is consistent with the compensation hypothesis, which says that firms pay less than marginal productivity to younger workers, but compensate them with higher salaries later on. |
RESUMO: O objetivo deste trabalho é verificar se o envelhecimento da força de trabalho é um peso para o orçamento das firmas, no sentido de que ela paga para os trabalhadores mais velhos mais do que a sua produtividade marginal. Para isso, calculo o efeito do envelhecimento da força de trabalho sobre a produtividade das firmas e sobre os seus salários. Encontro que a produtividade das firmas cai com a idade e com a senioridade. Os salários, entretanto, aumentam fortemente com a senioridade, embora permaneçam estáveis com a idade. Este resultado é consistente com a hipótese de que as empresas pagam menos do que a produtividade marginal para os trabalhadores mais jovens para compensá-los com salários mais altos, mais tarde. |

The neoclassical theory of firm assigns worker’s wage differentials to differentials in their marginal productivity. The demographic profile of wages follows, therefore, the demographic profile of human capital accumulation, increasing in the early stages of the career and decreasing jointly with the human capital depreciation [see Mincer (1974)]. This hypothesis is based on psychometrics studies undertaken by medical scientists [see Skirbekk (2003)], showing that cognitive abilities tend to deteriorate with age.
However, many hypotheses have been put forward to explain the fact that, the age-productivity profile is not always similar to the age-wages profile. One of the most important explanations is the deferred compensation hypothesis according to which firms could pay workers whose performance is hard to monitor less than their productivity when they are young and more than their productivity when they are old, as a mechanism to incentivize effort [see Lazear (1981)]. Another important explanation is the one offered by the sorting and matching models according to which labor market search, by raising the chance of finding a good job-worker match, may also imply upward sloping experience earnings profiles in parallel with flat or declining productivity effects [see Manning (2000)]. In other words, employers may use wage as a signal to attract good workers offering a wage-experience premium.
The aim of this paper is to investigate if the Brazilian aging workforce could represent a burden to firms. To do this I will calculate the effect of an aging workforce on productivity, and on wages. I verify, then, if the productivity-age profile is similar to the wage-age profile. If older workers are less productive than young ones, firms may be tempted to incentive early retirement, with the consequences mentioned above, especially if the wages increase with age. I also test two other hypotheses: (i) Does seniority affect wages, such as age (confirming the deferred compensation hypothesis)? And does age-productivity profile depends on the type of profession the worker is inserted on (managerial occupations having a smaller decrease in productivity with age)?
I use an employee-employer merged data with information about all the Industry firms with more than 30 employees in Brazil. The dataset follow firms and workers annually from 1996 to 2007. I use this panel dataset to jointly estimate the impact of an aging labor force on firms’ productivity and on firms’ wages, using the methodology first used by Hellerstein, Neumark and Troske (1999) and formalized by Levinsohn and Petrin (2003), the well-known LP estimator, explained in Section 2.
I find that firm’ productivity declines with age and with seniority, but wages strongly increase with seniority, although they remain stable with age. This result is consistent with the compensation hypothesis. It seems like firms in Brazil pay less than the marginal productivity to younger workers, but compensate them with higher salaries later on, mainly if they stay in the same firm (i.e. have higher seniority). Also, I confirm that in managerial occupations, older workers have a smaller decrease in productivity.
Many authors have calculated the effects of workforce characteristics on productivity and wages using employee-employer firm or plant level data (in many cases the employee datasets are demographic surveys linked to the firm or plant level data). The work of Hellerstein and Neumark (1995) and Hellertein, Neumark and Troske (1999) are particularly important. The first one, using Israeli firm data, shows that the earning and productivity age profiles are fairly similar. The second one shows very similar results using US data. These studies conclude that wages are roughly based on productivity and that the wage profile by age is consistent with the human capital hypothesis. However, using another US dataset they find that the wage profile by age is steeper than the productivity profile, which can be interpreted as evidence supporting the deferred compensation hypothesis.
This paper contributes to the literature since is the first paper measuring the age-productivity and wage-age patterns in a developing country. Moreover, Brazil has particular characteristics which make the investigation even more interesting: is a country with high share of population retiring very early and it is at the end of the demographic transition process, which makes the problem of early retirement even more important. Therefore, the wage-productivity-age-profiles could be important issues for public policies, as the compensation hypothesis scheme could generate more incentive to retire early.
The rest of the paper is structured as following: Section 2 presents the methodology used in the main estimation; Section 3 presents the dataset; Section 4 presents the results and Section 5 concludes the paper.
This paper uses firm’s level production function to analyze the effect of worker’s characteristics on productivity and wages. I follow the methodology of Hellerstein, Neumark and Troske (1999), in which they stress the importance of labor quality to calculate production functions. The production function is an econometric version of Cobb-Douglas production function:
![]() (1)
(1)
where Y is the value added by firm i at time t, LA is an aggregate function of different types of workers, K is the capital stock, F is a matrix of firm’s characteristics that are chosen in order to make the specification in (1) as comparable as possible to the specification for wage equation, and u the error term.
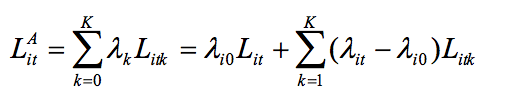
The key variable of the estimation of this production function is the quality labor aggregated. Let Litk be the number of workers of type k in firm I at time t, and ϕk be their productivity. If I assume that workers of each type are perfectly substitutable, the function can be specified as:
 (2)
(2)
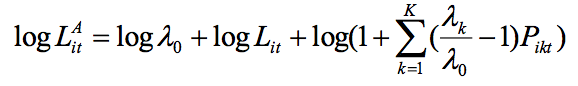
Where Lit is the total number of workers in the firm, and λ0 the productivity of the reference category of workers. If I assume that a worker has the same marginal product across firms, we can rewrite equation (2) as:
 (3)
(3)
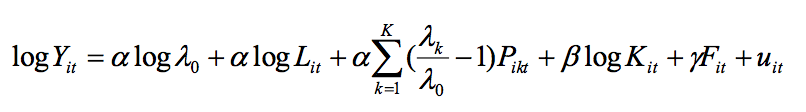
Where Pikt is the ratio of the number of workers of type k over the total number of employees. Since log(l+x) ≈ X, we can rewrite approximately (3) and put in the production function (1). So, the production function can be written by:
 (4)
(4)
Where ![]() is the relative marginal productivity of workers type k in relation to the reference category group.
is the relative marginal productivity of workers type k in relation to the reference category group.
I follow Ilmakunnas and Maliranta (2005) and divide the workers characteristics in education [0 to 8 (FUNEDU), 9 to 11 (MEDEDU), 12 or more (UNIVEDU) years of schooling], age [15-24 (AGE1), 25-34 (AGE2), 35-44 (AGE3), 45-64 (AGE4)] seniority [less than 10 years in the firm(YOUNG), and more than 10 years in the firm (SENIOR)], and gender (MEN and FEM) characteristics. Only seniority they don’t have in their regression, but Daveri and Maliranta (2007) and Ilmakunnas, Maliranta and Vainiomäki (2004) have stressed the importance of seniority to productivity and how its effect could be different to the effect of age simply. The idea is that seniority is an indicator of specific human capital accumulation and age by itself is an indicator of general capital accumulation. So we can measure the effect of each kind of human capital accumulation on labor productivity and wages.
To estimate the wage equation there are two possibilities. One can follow Crépon, Deniau and Pérez-Duarte (2002), and Hellerstein, Neumark and Troske (1999) and estimate a payroll regression, or one can follow Abowd and Kramarz (1999) and Doestie (2006) and estimate a wage equation in the worker level. I choose the first option for two reasons: first, enable joint estimation of payroll and production function equations, and therefore yield a direct test of the hypothesis that wages equal productivity for each age group; and second, the simultaneous model minimizes the impact of unobserved factors on productivity and wages.
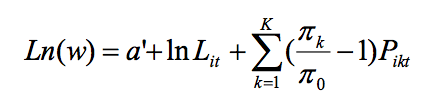
To estimate the wage equation I follow Hellerstein, Neumatk and Troske (1999), and retain the equiproportionate distribution restriction made in defining LA in the production function. I also restrict the relative wages of workers within a demographic group to be constant across all other demographic groups. Finally, I assume that firms pay the same wages to the same category of workers. Under these assumptions, total log wages in a plant can be written as:
 (5)
(5)
Where ![]() is the yearly labor cost differential between the worker type k and the worker type 0. So, jointly estimating equations (4) and (5) we can then make a test to see if the differentials of wages across workers in different demographic groups are reflecting differentials of productivity between these demographic groups. I also include a set of variables in the F matrix, such as dummies to the sector of the firm, the state and the year.
is the yearly labor cost differential between the worker type k and the worker type 0. So, jointly estimating equations (4) and (5) we can then make a test to see if the differentials of wages across workers in different demographic groups are reflecting differentials of productivity between these demographic groups. I also include a set of variables in the F matrix, such as dummies to the sector of the firm, the state and the year.
2.2. Econometric Issues
The first econometric problem of this analyzes is that I am calculating the effects of the share of each demographic group on the productivity outcomes. However, it might be possible that these demographic characteristics are correlated with the quantity of hours worked by each group. So, as a robustness check, I will do the same analyzes substituting the share of workers in each group for the share of contracted hours of each group. I still will have the problem that not always the share of contracted hours is the share of effective worked hours, but the data limitation doesn’t permit me solve this problem.
The second econometric problem in this kind of estimation is that there is unobserved heterogeneity across firms. It is possible that the firm has unobserved time-invariant characteristics that are correlated with the independent variables and that drive at certain way the productivity outcomes. To control to this kind of effect I will add firms fixed effects in the production function (and also in the wages equation).
Finally, the most common econometric problem is the endogeneity bias. Firms could make adjustments in response to productivity shocks that are correlated with the age structure and other demographic characteristics of workers [see Griliches and Mairesse (1998)]. For example, firms could adjust its workforce in response to an innovation shock (be it technological or in the management) by hiring more workers in that specific activity. Therefore, if the shock is a technological innovation, firms tend to increase the share of younger workers and a positive productivity shock will be correlated with the share of younger workers, only because of the type of activity they have comparative advantage. At the same time, if the shock is a management shock, that depends on the capacity of communicate, for example, may be firms will prefer increase the share of older workers, and then, older workers will be positively correlated with productivity only because their comparative advantage in some kind of activity.
So, to avoid this kind of endogeneity I use the method first used by Hellerstein, Neumark and Troske (1999) and formalized by Levinsohn and Petrin (2003). The idea is that firms first adjust intermediate inputs in response to a productivity shock, before adjust the other inputs. Therefore one can invert the demand for capital and materials to infer a value for the unobserved productivity shock. The estimated productivity shock is then used as a regressor in the production function. The method assumes that the inversion function is non-stochastic. If this assumption is violated the estimation will be biased. However, Grodnichenko (2006) provides a monte-carlo test showing that the LP estimator is less biased than OLS estimates at least in the case of return to scale estimation. Although this is my preferred technique I also provide the results of OLS estimation, as the discussion of econometric issues on production function estimation is far from an uncontroversial subject.
Finally, I calculate the variance-covariance matrix of Huber-White in order to account to heteroscedastic errors.
The dataset used in this paper is an employee-employer merge data with information about all the Industry firms with more than 30 employees in Brazil. The firm’s information is from the Annual Industry Survey (PIA) and the employee information is from the Social Information Annual Survey (RAIS). In PIA I have information about firm expenditure on people, on capital (inflow and outflow, but not stock), on assets, on material and on intermediate goods. In RAIS I have information about workers characteristics, such as age, gender, income, seniority, hiring and removal. The two datasets could be merged. The dataset follow firms and workers annually from 1996 to 2007.
However there is no information in PIA about capital stock by firms. Meanwhile, I have information about investment and capital depreciation. I have also estimation on the capital stock by sector of activity. With this information I can use these data to calculate the capital stock by firm using the perpetual inventory procedure. To calculate the initial capital stock of each firm, I use the capital stock of 1995 by sector of activity and consider that it is divided by the firms according to their labor participation on the sector, assuming the hypothesis that the capital-labor share is constant within each sector [see Alves and Silva (2008)].
On the other hand, the database gives me the advantage of having information about the time the worker is on that work. So, I measure the difference between the effects of age simply to the effect of seniority in economic productivity. As argued in first and second sections seniority could have a higher negative effect on productivity, mainly in firms with a lot of technological innovation. I also estimate, then, the same model, choosing only the industry sectors with more innovations, according to the Bastos (2004) estimation, to see if there is a difference in terms of wage-productivity age-profile gap between these sectors and all the sample.
Finally, the data also provide information about the type of occupation each worker has. So, I divide the workers on white-collar occupation and blue-collar occupation. The idea is that the firms with high proportion of white-collar workers have a minor decline in productivity as the age-structure changes to older workers, as explained in the introduction of this paper. So I interact the variable WHITE-COLLAR with the variable AGE4 to see if, given the proportion of white-collar workers, the productivity decline with age. The results are shown in the next section.
The first results are shown in Table 1. As can be seen, firms productivity decline with age, and with seniority. Also, firms wage increase with seniority and become stable with age. Related to the age-profiles the results are strongly robust no matter what kind of method is used. However, related to the seniority-productivity profiles, the conclusions are reversed when I include firm’s fixed-effect. In OLS regression, productivity increase with seniority, but this is completely reversed in the fixed-effect estimation.
Table 1 - Regression Results for all workers
LP and Fixed-effect |
OLS |
||||||
Nonlinear SUR Parameter Estimates |
Nonlinear SUR Parameter Estimates |
||||||
Parameter |
Estimate |
Approx Std Err |
Approx |
Parameter |
Estimate |
Approx Std Err |
Approx |
Pr > |t| |
Pr > |t| |
||||||
Productivity |
Productivity |
||||||
L |
0.52 |
0 |
<.0001 |
L |
0.84 |
0 |
<.0001 |
MEDEDU |
0.17 |
0.01 |
<.0001 |
MEDEDU |
0.76 |
0.01 |
<.0001 |
UNIVEDU |
0.45 |
0.02 |
<.0001 |
UNIVEDU |
3.02 |
0.03 |
<.0001 |
15-24 |
0.54 |
0.02 |
<.0001 |
15-24 |
-0.78 |
0.02 |
<.0001 |
25-34 |
0.43 |
0.02 |
<.0001 |
25-34 |
0.27 |
0.03 |
<.0001 |
45-64 |
-0.35 |
0.03 |
<.0001 |
45-64 |
-0.66 |
0.03 |
<.0001 |
SENIOR |
-0.48 |
0.02 |
<.0001 |
SENIOR |
-0.31 |
0.02 |
<.0001 |
MEN |
0.23 |
0.02 |
<.0001 |
MEN |
0.76 |
0.01 |
<.0001 |
Wage |
Wage |
||||||
MEDEDU |
0.02 |
0 |
<.0001 |
MEDEDU |
0.51 |
0 |
<.0001 |
UNIVEDU |
0.49 |
0.01 |
<.0001 |
UNIVEDU |
2.27 |
0.01 |
<.0001 |
15-24 |
-0.27 |
0.02 |
<.0001 |
15-24 |
-0.99 |
0.01 |
<.0001 |
25-34 |
0.01 |
0.02 |
0.77 |
25-34 |
-0.22 |
0.01 |
<.0001 |
45-64 |
0.02 |
0.03 |
0.53 |
45-64 |
-0.37 |
0.02 |
<.0001 |
SENIOR |
0.12 |
0.01 |
<.0001 |
SENIOR |
0.45 |
0.01 |
<.0001 |
MEN |
0.11 |
0.01 |
<.0001 |
MEN |
0.5 |
0 |
<.0001 |
Test Results |
Test Results |
||||||
Test |
Type |
Statistic |
Pr > ChiSq |
Test |
Type |
Statistic |
Pr > ChiSq |
Test0 (Age) |
Wald |
171.26 |
<.0001 |
Test0 (Age) |
Wald |
152.66 |
<.0001 |
Test1 (Senior) |
Wald |
617.51 |
<.0001 |
Test1 (Senior) |
Wald |
2221.5 |
<.0001 |
Notes: SUR regression results for all workers. Joint estimation of productivity and wage equations using the employer-employee data. Levinsohn and Petrin (2003) methodology with firm fixed effect is used for productivity estimation. Test0 tests if age coefficients are the same for productivity and wage equations. Test1 tests if seniority coefficients are the same for productivity and wage equations.
The results are essentially the same using the LP fixed-effect estimator, or the common panel fixed-effect estimator. Also, it is straightforward to see that wages strongly increase with seniority, which is not the case in the case of age, as wages remain stable. This result is consistent with the compensation hypothesis. It seems that firms in Brazil pay less than the productivity to younger workers, but compensate them with higher salaries latter on, manly if they keep in the same firm. Test 0 shows that one can reject the hypothesis that age has the same effect on productivity and wages. Test1 do the same thing for seniority.
When I run the regression only with the more innovative sectors age and seniority also impact negative on productivity (results not shown). But in this case the impact is negative on wages for age and positive for seniority, which is again consistent with the compensation hypotheses.
Finally, Table 2 shows that productivity has a smaller decrease with age for white-collar workers. The coefficient of the interaction between older ages and white collar is positive to explain productivity, although not significant. At the same time, the coefficient is negative to explain wages, significant in some regressions and not significant in other. But, mostly important, one cannot reject the hypothesis that firms pay equal to marginal productivity for the older-white-collar workers.
One can reach some insights of these results. It is much more difficult to monitor a wide quantity of blue-collar workers than a minor quantity of white collar workers. So, the deferred compensation scheme is much more useful to generate effort incentives in young ages to the blue-collar workers, than to the white collar workers. For the white-collar workers, firms can easily monitor the marginal labor productivity of each worker and pay them in accordance to this.
Table 2 - Regression Results for White Collar Workers
Nonlinear SUR Parameter Estimates |
||||
Parameter |
Estimate |
Approx Std Err |
t Value |
Approx |
Pr > |t| |
||||
Productivity |
||||
L |
0.67749 |
0.0113 |
60.2 |
<.0001 |
MEDEDU |
0.143622 |
0.0358 |
4.01 |
<.0001 |
UNIVEDU |
0.293559 |
0.0785 |
3.74 |
0.0002 |
15-24 |
0.449264 |
0.0722 |
6.22 |
<.0001 |
25-34 |
0.403834 |
0.074 |
5.45 |
<.0001 |
45-64 |
-0.65626 |
0.1029 |
-6.37 |
<.0001 |
SENIOR |
-0.56543 |
0.066 |
-8.56 |
<.0001 |
WHITE-COLLAR |
-0.34972 |
0.2001 |
-1.75 |
0.0805 |
45-64 * White-Collar |
0.386038 |
0.4696 |
0.82 |
0.4111 |
MEN |
0.331226 |
0.0663 |
5 |
<.0001 |
Wage |
||||
MEDEDU |
0.02023 |
0.00497 |
4.07 |
<.0001 |
UNIVEDU |
0.43132 |
0.0131 |
32.93 |
<.0001 |
15-24 |
-0.26384 |
0.0204 |
-12.95 |
<.0001 |
25-34 |
0.011391 |
0.0236 |
0.48 |
0.6286 |
45-64 |
0.015743 |
0.026 |
0.61 |
0.5452 |
SENIOR |
0.117588 |
0.0149 |
7.9 |
<.0001 |
WHITE-COLLAR |
0.357632 |
0.023 |
15.57 |
<.0001 |
45-64 * White-Collar |
-0.11871 |
0.0619 |
-1.92 |
0.0553 |
MEN |
0.112189 |
0.00759 |
14.78 |
<.0001 |
Test Results |
||||
Test |
Type |
Statistic |
Pr > ChiSq |
Label |
Test0 |
Wald |
42.91 |
<.0001 |
Age |
Test1 |
Wald |
92.8 |
<.0001 |
Seniority |
Test2 |
Wald |
1.06 |
0.3036 |
age* white-collar |
Notes: SUR regression results for all workers. Joint estimation of productivity and wage equations using the employer-employee data. Levinsohn and Petrin (2003) methodology with firm fixed effect is used for productivity estimation. Test0 tests if age coefficients are the same for productivity and wage equations. Test1 tests if seniority coefficients are the same for productivity and wage equations. Test2 tests if the coefficients of the interaction between older workers and white-collar workers are the same in productivity and wage equations.
To better observe the effect of aging labor force on productivity I make a simple exercise assuming that demographic profile in Brazil changes in the same way as the population projections made by IBGE (2008b) and everything else remains constant. Using the estimated coefficients above and considering a productivity index equal to 100 in 2005, the results are in Figure 1. Productivity of Brazilian industrial firms would decrease 16% because of the demographics between 2005 and 2050, everything else constant.
Figure 1
Productivity of Brazilian Industrial Firms
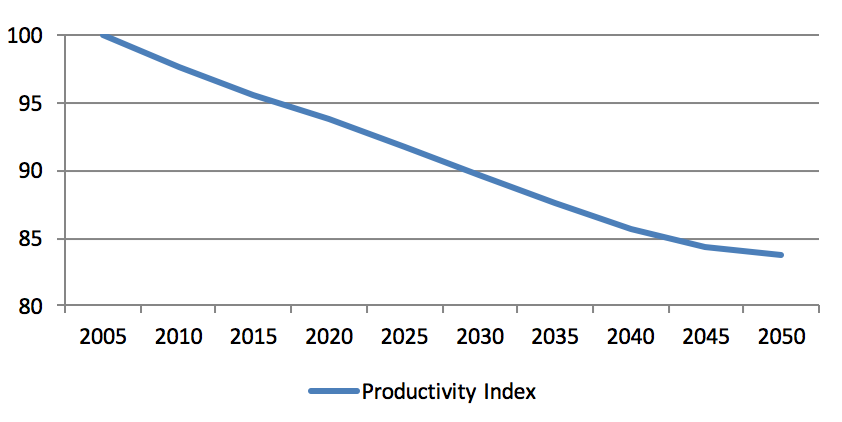
Source: Author’s own calculation using the estimated coefficients of Table 1.
At the same time the estimates in this paper show that productivity would increase with education. The Brazilian average number of schooling years has increased very rapidly during the past two decades [see Bruns, Evans and Luque (2012)]. Taking as a benchmark the educational distribution of average OECD countries, supposing Brazil would reach this same educational distribution in 2050 and using the coefficients in Table 1, I reach the conclusion that productivity of Brazilian industrial firms would increase 9% between 2005 and 2050 only because of the change in education structure, which would partially offset the effects of demographic changes. Besides that, the coefficient of the older workers age group could change with changes in relative demand for jobs involving interactive skills, as previously discussed and, more importantly, with the fact that population has become more educated, which makes training more efficient to prevent human capital depreciation at older ages. Then, the effect of demographics on productivity depends on the level of early stages education, which makes even more important provide basic education of good quality for everyone.
In summary, the evidence points out that in the Brazilian industrial sector wages increase or remain stable with age, and productivity declines with age. In this case an aging workforce would be a burden to firms, at least in the short run. In addition to the explanation given by the deferred compensation hypothesis, another possible explanation for these results is that legislation puts restrictions on the possibility of reducing wages for those workers who have been with the same firm for long and forces firms to pay high taxes to lay off workers. Under these circumstances, laying off workers when they become less productive is very expensive.
The findings presented here are consistent with findings for European countries. Most evidence confirms the conclusion that aging of the workforce could be a burden to the firms, as they pay more than the marginal productivity for older workers. As was discussed earlier, this can create incentives for the employer and the employee to settle for early retirement. The more advanced the population aging the stronger will be this incentive, as firms will have a higher share of older workers. Although contracts are dynamics and firms may change the way they design their payment schemes, evidence in developed countries shows that firms continue to pay the seniority-based wage even after the share of old population is very high [see Lazear (1990) and Mason and Lee (2004) to details]. A possible solution for firms to decrease the burden of an older workforce could be to adopt mandatory retirement rules. Many older workers could be forced to retire and firms could re-hire them in an informal way only, with a smaller wage and without obligation of contributing to the social security system. This evidence is supported by the pattern of early retirement observed in Brazil.
As workers continue to age in many middle and high income countries, the age profile of the workforce will move away of exhibiting a high share of workers at their peak productivity. Such scenario suggests that these economies will need to boost their labor productivity growth, which would require a substantial increase in broad capital investments, that is to say, human capital, intangible capital (research and development) and physical capital [see United Nations, 2007]. Last section mentioned how an aging workforce can improve human capital investments, and at least partly offset the effect of declining labor productivity associated with having higher share of workforce away of their peak productivity. In less developed countries, however, most policies still target industry sectors that have particular strategic importance to growth. Meanwhile, it is also necessary to improve productivity of the traditional low skilled informal sector that has huge importance in developing and emerging economies, including Brazil. In this context, investments in human capital and infrastructure in Brazil are very important to improve productivity as a whole. Moreover, improved access to technology and the creation of forward and backward linkages in the supply chain between the formal and informal sector can enhance worker skills and ultimately lead to higher overall productivity growth [see ILO (2008)].
To conclude, in this paper was shown that negative effects of population aging on productivity at firm’s industrial level can be expected. This may have a negative impact on aggregate economic output (although evidence in this regard is mixed), as a higher share of the workforce would be away of its peak productivity. To offset these negative effects some traditional policies are recommended. The demographic changes currently under way in Brazil should result into more investment in human capital, and consequently, into improvements of labor productivity. However, better quality of education at younger ages, together with effective investments on re-training of older workers, may help Brazil to continue to raise its productivity even when the age structure of its population continues shifting towards older ages.
Abowd, J. M., and Kramarz, F (1999). “Econometric Analyses of Linked Employer-Employee Data”, Labour Economics, 6(1), 53-74.
Alves, P., and Silva, A. M. (2008). Estimativa do Estoque de Capital das Empresas Industriais Brasileiras. IPEA, Texto para Discussão, No 1325.
Bastos, V. D. (2004). “Incentivo à Inovação: Tendências Internacionais e no Brasil e o Papel do BNDES Junto às Grandes Empresas”. Revista do BNDES, V.11, N. 21, 107-138.
Bond, S., and Soderborn, M. (2005). Adjustment Costs and the Identification of Cobb-Douglas Production Functions. Working Paper 05/04, Institute for Fiscal Studies.
Bruns, B., D. Evans, and J. Luque (2012). Achieving World Class Education in Brazil: The Next Agenda. The World Bank, Washington, DC.
Crépon, B., Deniau, N., and Pérez-Duarte, S. (2002). “Wages, Productivity, and Worker Characteristics: A French Perspective”. Serie des Documents de Travail du CREST. Institut National de la Statistique et des Etudes Économiques.
Daveri, F., and Maliranta, M. (2007). “Age, Seniority and labor costs”. Economic Policy, 22(1), 117-175.
Dostie, B. (2006). Wages, Productivity and Aging. IZA, Discussion Paper No 2496. Bonn, Germany.
Feyrer, J. (2007). “Demographics and Productivity”, The Review of Economics and Statistics, 89(1), 100-109.
Gorodnichenko, Y. (2006). Using Firm Optimization to Evaluate and Estimate Returns to Scale. Working Paper, University of Michigan.
Griliches, Z., and Mairesse, J. (1998). “Production Functions: The Search for Identification”. In S. Strom (Ed.), Econometrics and Economic Theory in Twentieth Century: The Ragnar Frisch Centennial Symposium, pp. 169-203. Cambridge University Press.
Hellerstein, J. K. and Neumark, D. (1995). “Are Earnings Profiles Steeper than Productivity Profiles?” Journal of Human Resources, 30(1), 89
Hellerstein, J. K. and Neumark, D. (2004). Production Function and Wage Equation Estimation with Heterogenous Labor: Evidence from a New Matched Employer-Employee Data Set. NBER, Working Paper No 10325.
Hellerstein, J. K., Neumark, D. and Troske, K. R. (1999). “Wages, Productivity and Worker Characteristics: Evidence from Plant-Level Production Functions and Wage Equations”, Journal of Labor Economics, 17(3), 409-46.
IBGE (2008a). Pesquisa Nacional por Amostra de Domicílios. URL: http://www.ibge.gov.br/home/estatistica/populacao/trabalhoerendimento/pnad2008
IBGE (2008b). Projeção da População do Brasil por Sexo e Idade: 1980-2050. Diretoria de Pesquisas do Instituto Brasileiro de Geografia e Estatística. Rio de Janeiro, RJ.
Ilmakunnas, P., and Maliranta, M. (2005). “Technology, Labour Characteristics and Wage-Productivity gaps”. Oxford Bulletin of Economics and Statistics, 67(5), 623-44.
Ilmakunnas, P., and Maliranta, M. (2007). Aging, Labor Turnover, and Firm Performance. HEER, Discussion Paper No 164. Helsinki, Finland.
Ilmakunnas, P., Maliranta, M., and Vainiomäki, J. (2004). Journal of Productivity Analysis, 21, 249-276.
International Labour Office, ILO (2008). Skills for improved productivity, employment growth and development, Report V, International Labour Conference, 97th Session, Geneva, 2008 (Geneva).
Lazear, E. P. (1981). “Agency, earnings profiles, productivity and hours restrictions”, American Economic Review, 71(4), 606-20.
Lazear, E. (1990). “Job Security Provisions and Employment.” The Quarterly Journal of Economics. 105 (3): 699-726.
Levinsohn, J., and Petrin, A. (2003). “Estimating Production Function Using Inputs to Control for Unobservables”. Review of Economic Studies, 70(2), 317-342.
Manning (2000). “Moving on up: Interpreting the earning-experience profile”, Bulletin of Economic Research, 52, 261-95.
Mason, A. and R. Lee (2004). “Reform and Support Systems for the Elderly in Developing Countries: Capturing the Second Demographic Dividend”. International Seminar on the Demographic Window and Healthy Aging: Socioeconomic Challenges and Opportunities, China Centre for Economic Research, Peking University, Beijing.
Mincer, J. (1974). Schooling, Experience, and Earnings. New York: Columbia University Press.
Skirberkk, V. (2003). Age and Individual Productivity: A Literature Survey. MPIDR, Working Paper No. 2003-028.
Tang, J. and MacLeod, C. (2006). “Labor Force Ageing and Productivity Performance in Canada”, Canadian Journal of Economics, 39(2), 582-602.
United Nations (2007). The Millennium Development Goals Report 2007. United Nations, New York.
Vandenberghe, V. and Waltneberg, F. (2010). Ageing Workforce, Productivity and labour Costs of Belgian Firms. Mimeo.
1. Universidade Federal do Rio de Janeiro, UFRJ. http://lattes.cnpq.br/7731191536528594