![]() ISSN 0798 1015
ISSN 0798 1015

![]() ISSN 0798 1015
ISSN 0798 1015
Vol. 38 (Nº 48) Year 2017. Page 4
Aitolkyn BOLAT 1
Received: 12/06/2017 • Approved: 30/06/2017
4. Research results and findings
ABSTRACT: The ability to predict and detect vulnerable banks in a country’s banking system is crucial for state, investors, creditors, depositors and other stakeholders. This issue becomes particularly acute in times of financial crises and economic instability; however it is important in a stable economic conjuncture as well. The primary purpose of this study is to systematize and test the formalized approaches to the assessment of the probability of banks’ bankruptcy using their financial indicators. It is important, since the application of relevant methods of bankruptcy predictions allows introducing various anti-crisis strategies in advance in order to prevent the crisis in commercial banking. Thus, in the framework of this study the attempts are undertaken to select the most appropriate model to evaluate the banks’ financial performance based on the investigation of 23 Kazakhstan banks. The author systematically analyses important banks, large and small banks, as well as banks with public and foreign participation for recent five years to ensure the accuracy of the study. Today, there are 34 banks operating in Kazakhstan; 11 banks are excluded from the analysis due to the insufficient information and data. |
RESUMEN: La capacidad de predecir y detectar los bancos vulnerables en el sistema bancario de un país es crucial para los Estados, inversionistas, acreedores, depositantes y otras partes interesadas. Esta cuestión se vuelve particularmente aguda en tiempos de crisis financieras y de inestabilidad económica; sin embargo, también es importante en una coyuntura económica estable. El propósito principal de este estudio es sistematizar y probar los enfoques formalizados para la evaluación de la probabilidad de quiebra de los bancos utilizando sus indicadores financieros. Es importante, ya que la aplicación de los métodos pertinentes de predicciones concursales permite introducir con antelación varias estrategias anticrisis para prevenir la crisis en la banca comercial. Así, en el marco de este estudio se emprenden los intentos de seleccionar el modelo más apropiado para evaluar el desempeño financiero de los bancos basándose en la investigación de 23 bancos de Kazajstán. El autor analiza sistemáticamente bancos importantes, bancos grandes y pequeños, así como bancos con participación pública y extranjera durante los últimos cinco años para asegurar la exactitud del estudio. Actualmente, hay 34 bancos que operan en Kazajstán; 11 los bancos están excluidos del análisis debido a la insuficiencia de información y datos. |

At present, the banking system of Kazakhstan is experiencing critical phase in its development that is characterized by sharp devaluation, high level of non-performing loans and low liquidity level accompanied by constant state support using budgetary funds in order to stabilize the financial system (The National Bank of the Republic of Kazakhstan: Financial Stability Report of Kazakhstan, 2014). Under such circumstances, identification and selection of the model of bankruptcy predictions become increasingly important and relevant, since it allows to obtain an objective information on the degree of sustainability of banks that serve as a basis for overall financial system, as well as banks’ ability to perform their activity smoothly at least over the medium term. Such information has a wide range of application: in particular, it can be used by banks and the National Bank when analysing credit risk and evaluating financial stability, by central Government and local authorities when planning state budget, as well as by potential investors.
On September 15, 2008, US banking giant Leman Brothers with USD 613 billion in debt filed for bankruptcy protection. Its collapse became the largest in the history. The devastation of the fourth-largest US investment bank and further wave of commercial bank failures in the world remind “Jenga” game that in turn affects Kazakhstan banking sector and puts a severe disadvantage to the country’s financial system. In such circumstance, the issue of identification of appropriate bankruptcy prediction models becomes quite relevant. Indeed, numerous studies are conducted in this direction by economists and academics. Edward I. Altman (1968) is a pioneer of scoring approach toward the failure prediction and is one the first who practically implements it by introducing the Altman Z-model (Z=1.2X1 + 1.4X2 + 3.3X3 + 0.6X4 +X5). The model is developed using multiple discriminant analysis (MDA) and is based on the analysis of several financial indicators that reflect company’s performance. One of the most important advantages of Altman’s approach is high degree of accuracy in predicting company’s failure: 95% - for the time horizon of one year and 83% - for two years. However, one should take into account limitations that are inherent to this model. In particular, the classic Altman Z-model can be applied only with respect to large companies whose stocks are traded in exchange. Further Edward I. Altman (1983) proposes a modified version of multifactor model that is suitable for other companies (Z = 0.717X1 + 0.847X2 + 3.107X3 + 0.42X4 + 0.995X5), as well as revises the model for non-production companies (Z = 6.56X1 + 3.26X2 + 6.72X3 + 1.05X4) (Edward I. Altman, 1995). In addition to that, Edward I. Altman (1995) develops a special version of the scoring model particularly for emerging markets (Z=3.25 + 6.56X1 + 3.26X2 + 6.72X3 + 1.05X4).
Roli Pradhan (2014) is one of the recent studies that employs the Altman model to assess the banking sector in India using BPNN (Back Propogation Neural Network) model. Further, Md. Shahnawaz Mostofa, Sonia Rezina and Md. Salim Hasan (2016) forecast the financial crisis in banking sector of Bangladesh on the sample of commercial banks for the period between 2010 and 2014 applying Z-score approach. The results imply that the ratio of earnings before interest and taxes to total assets has stronger predictive ability in terms of forecasting banks’ financial performance in comparison with other variables. Ioannis Kokkoris, Maria Anagnostopoulou, (2016) based on Altman’s Z-score analyze the bankruptcy risk in the banking sector of Greece in order to assess the probability of default of four systematically important Greek banks.
Alternative scoring model that can be applied to evaluate bankruptcy risk in banking system is Bankometer (S-score). This model classifies banks according to the degree of their solvency based on the coefficients developed in consistence with IMF (International Monetary Fund) recommendations (IMF, 2000). In particular, Bankometer focuses on capital adequacy, asset quality and profitability. Interestingly that S-score model has started gaining in prominence after the 2008 financial crisis. Indeed, many developed countries put efforts to improve this model with the purpose of developing a universal tool for all banks in the world that can accurately evaluate and predict the financial distress in banking system, whereas researchers apply Bankometer model in banking industry of their countries, contributing thereby to its improvement. In this way, Shar, A. H., Shah, M. A., and Jamali, H. (2010) assess the efficiency of banking sector of Pakistan using Bankometer model for separate banks for the period between 1999 and 2002 to evaluate solvency of each bank. Further, the results are compared with well-known CAMEL supervisory rating system to verify Bankometer model. The study reveals that the last can be applied at the global level for the purpose of predicting a particular bank’s vulnerability. Makkar, A., and Singh, S. С. (2012) employ S-score model to investigate the solvency of 37 Indian commercial banks for 2006-2007 and 2010-2011. They find that overall Indian banks are solvent, with private sector banks being more financially stable if compared to banks with public participation. Uddin, M. M., Masud, M., and Kaium, A. (2015) conduct an analysis of commercial banks of Bangladesh for the period between 2006 and 2010 to assess their financial stability. The results reveal that during the investigated period banks improve their performance significantly. Further, the authors rank banks in the sample and find that banks with large amount of deposits, loans and investment as well as broad branches network and large number of personnel do not always demonstrate higher profitability. In the framework of this study, the set of measures is developed for banks to ensure soundness of their performance. Md. Zahidur Rahman (2017) applies Bankometer model to investigate the financial stability of commercial banks in Bangladesh. He finds that all banks maintain sound financial condition and banking sector as a whole experience favorable state during the analyzed period (2010-2015). Furthermore, the author infers that Bankometer model is extremely useful for the internal control and management of any bank in terms of identification of the issues related to insolvency and inefficiencies of banking operations.
Since Kazakhstan is considered to be a developing country of Central Asia, for the purpose of the study, the Altman Z-Score Model for emerging countries is applied. Given model has been developed in 1995 and is one of the most widely recognized and used model for predicting the probability of financial failure (Table-1).
Table 1. Altman’s Model for Predicting the Probability of Banks’ Bankruptcy for Emerging Markets
Z(A)=3.25+6.56X1+3.26X2+6.72X3+1.05X4 |
|
Elements of the Model |
Values |
Z(A)=Integrated Indicator of Bankruptcy Threat |
If: Z(A)>2.60 - Safe Zone (low probability of bankruptcy) 1.1<Z(A)<2.60 - Grey Zone (probability of bankruptcy is not high; however it cannot be excluded) Z(A)<1.1 - Distress Zone (there is a probability of bank’s bankruptcy) |
X1=Net working Capital/Total Assets |
|
X2=Retained Earnings/Total Assets |
|
X3=Earnings Before Interest and Taxes/Total Assets |
|
X4=Book Value of Equity/Total Liabilities |
|
Source: Altman, E.I., 2005.
Alternative model that is aimed at the analysis of bank’s sustainability and soundness is Bankometer. According to this model, bank’s soundness is measured by the score that is called solvency score. In particular, based on Bankometer approach it is possible to identify the issues related to insolvency and as a consequence address corresponding shortcomings.
Following the IMF recommendations (2000), Shar, et. Al. (2010 г.) and Makkar and Singh (2012) apply Bankometer method (or S-score) to assess the financial performance and efficiency of commercial banks’ activity. The distinguishing feature of this method is that it generates most accurate and precise results using few parameters. It is important to note that the model is quite accurate in terms of bankruptcy classification of Asian banking system and Stress Test of Jasper van der Meulen banks; however, it has never been applied to the sample of Kazakhstan banks. Similar to Altman Z-score, S-score employs the financial ratios and results in the following linear function (Table-2).
Table 2. Bankometer Model for Predicting the Probability of Banks’ Bankruptcy
S=1.5X1+1.2X2+3.5X3+0.6X4+0.3X5+0.4X6 |
|
Elements of the model |
Values |
S=Integrated Indicator of Bankruptcy Threat |
If: S<50% - bank tends to experience financial difficulties and risk is perceived as high 50%<S<70% - bank is placed in Gray Area S>70% - bank tends to be in a healthy state |
X1=CA (Capital to Assets Ratio)≥045% |
|
X2=EA (Equity to Assets Ratio)≥02% |
|
X3=CAR (Capital Adequacy Ratio) 40 %≤CAR≥08% |
|
X4=NPL (Non-performing Loans to Loans Ratio)≤15% |
|
X5=CI (Cost to Income Ratio)≤40% |
|
X6=LA (Loans to Assets Ratio)≤65% |
|
Source: Shar, H.A., M. ali Shah and H. Jamali
H1: Little predictive ability of the Altman Z-score model to forecast financial situation of Kazakhstan banks
H2: Superior predictive ability of Bankometer model to forecast financial situation of Kazakhstan banks
The values of Z-score and determination the bankruptcy criteria for 23 commercial banks of the Republic of Kazakhstan using Altman’s model are presented in Table-3.
One should not that the zone of discrimination for the sample of commercial banks under the study using the Altman Z-score suggests that if Z-score of a bank is more than 2.6, the bank should be placed in Safe Zone and referred to as a stable and sound bank. However, if a bank is not able to secure even 1.1 Z-score, it should be placed in Distress Zone and categorized as a bank with poor financial condition. In other words, such bank is more likely to go bankrupt. Further, if Z-score lies between 1.1 and 2.6, a bank should be attributed to Grey Zone, which implies that its financial situation is uncertain.
Table 3. Evaluation and Results of Altman’s Z-Score Model for Commercial Banks of Kazakhstan for 2015
Z(A)= 3.25+6.56X1+3.26X2+6.72X3+1.05X4 |
|||||||
Variables |
X1 |
X2 |
X3 |
X4 |
S |
Classification |
|
Name of a Bank |
2015 |
||||||
1 |
JSC HSBK |
0.10 |
0.11 |
0.01 |
0.14 |
4.46 |
SZ |
2 |
JSC KKGB |
-0.13 |
0.03 |
-0.04 |
0.08 |
2.34 |
GZ |
3 |
JSC TSBN |
0.04 |
0.02 |
-0.02 |
0.07 |
3.53 |
SZ |
4 |
JSC SBER |
-0.20 |
0.05 |
-0.03 |
0.10 |
1.92 |
GZ |
5 |
JSC ATFB |
1.02 |
-0.08 |
-0.03 |
0.07 |
9.56 |
SZ |
6 |
JSC CCBN |
-0.10 |
0.01 |
-0.03 |
0.06 |
2.47 |
GZ |
7 |
JSC ASBN |
0.97 |
-0.17 |
-0.04 |
0.19 |
9.03 |
SZ |
8 |
JSC CSBN |
0.26 |
0.09 |
-0.04 |
0.12 |
5.08 |
SZ |
9 |
JSC EUBN |
-0.15 |
0.03 |
-0.04 |
0.09 |
2.17 |
GZ |
10 |
JSC HCSBK |
-0.02 |
0.05 |
0.02 |
0.29 |
3.75 |
SZ |
11 |
JSC CITI |
0.03 |
0.23 |
0.11 |
0.29 |
5.19 |
SZ |
12 |
JSC NFBN |
0.17 |
0.00 |
0.00 |
0.14 |
4.47 |
SZ |
13 |
JSC NRBN |
-0.28 |
-0.29 |
-0.05 |
0.14 |
0.29 |
DZ |
14 |
JSC ALBN |
0.06 |
0.13 |
0.05 |
0.18 |
4.63 |
SZ |
15 |
JSC ABBN |
0.12 |
0.01 |
-0.03 |
0.17 |
4.06 |
SZ |
16 |
JSC ATBN |
-0.07 |
0.08 |
0.01 |
0.12 |
3.25 |
SZ |
17 |
JSC LARI |
-0.17 |
0.02 |
-0.03 |
0.11 |
2.10 |
GZ |
18 |
JSC BVTB |
0.16 |
-0.04 |
-0.07 |
0.15 |
3.84 |
SZ |
19 |
JSC HCBN |
0.11 |
0.23 |
0.04 |
0.37 |
5.37 |
SZ |
20 |
JSC KSBN |
-0.24 |
0.03 |
-0.03 |
0.17 |
1.77 |
GZ |
21 |
JSC EXBN |
-0.29 |
0.04 |
-0.03 |
0.23 |
1.54 |
GZ |
22 |
JSC KZI BANK |
-0.10 |
0.06 |
0.03 |
0.57 |
3.62 |
SZ |
23 |
JSC KIBN |
0.39 |
0.00 |
-0.01 |
0.08 |
5.85 |
SZ |
ā |
0.07 |
0.03 |
-0.01 |
0.17 |
3.93 |
- |
|
Where, ā – average value in the market |
|||||||
Source: Compiled by the author based on the financial statements of banks
Essence of four key financial ratios, based on, which the Altman multifactor regression equation is developed and analysis of 23 commercial banks of Kazakhstan for 2015 is conducted (Table-3):
X1 - is the ratio of net working capital to bank’s total assets. This coefficient indicates the liquidity degree of bank’s assets. Indeed, by nature of their business banks typically require large amounts of working capital in order to meet short-term obligations on deposits. In essence, net working capital can be defined as an excess of current assets over the current liabilities; and hence, the larger the excess the higher the ratio, which directly contributes to bank’s liquidity. However, high working capital to total assets ratio might signal that bank does not utilize its reserves optimally (JSC ATFB (1.02), JSC ASBN (0.97)). Indeed, the funds that are tied in working capital are typically associated with low rate of return; therefore, banks strive to minimize its level (JSC EXBN (-0.29), JSC NRBN (-0.28) and JSC KSBN (-0.24) etc.). Low working capital to total assets ratio, on the other hand, might be indicative of the fact that bank faces serious liquidity problems, since it is not able to meet deposits withdrawals even when working capital generates income and bank possesses assets to cover its liabilities. Such situation might be a predictor of imminent bankruptcy, since the reason of low ratio may be permanent operating losses that erode working capital reserves, which in turn leads to its reduction with respect to total volume of assets. Low or negative ratio might also indicate that bank follows zero working capital approach. Thus, it is quite difficult task to determine the optimal level of working capital. To decide whether high or low ratio is positive or negative sign for bank, one should consider particular circumstances as well as compare it with the average indicator that exist in market (0.07).
X2 - represents the level of return on assets or return on capital that is measured by the ratio of retained earnings to average total assets or shareholders’ equity respectively. This ratio indicates the level of retained earnings generated by bank and shows the amount by which it exceeds (or falls behind) bank’s assets. According to the results of the analysis, the following banks exhibit high profitability ratios in comparison with the average ratio in market (0.03): JSC HCBN (0.23), JSC ALBN (0.13) and JSC HSBK (0.11). It implies that assets of JSC HCBN, JSC ALBN and JSC HSBK are used in more efficient manner and produce profit during the period. However, higher level of retained earnings might be indicative of the poor investment activity that reduces banks’ profitability. On the contrary, a downward trend in discussed ratios might imply that bank tends to face problems with profitability. For instance, JSC NRBN and JSC ASBN have the lowest ratio (-0.29 and -0.17 respectively). The lower the ratio the more bank relies on debt to finance its assets rather than on retained earnings, which in turn increases the risk of failure if bank is not able to meet its liabilities. Similar to liquidity ratio, it is difficult to determine the optimal value of discussed ratio. Therefore, in order to identify whether high or low ratio is advantageous for bank or not, it is important to consider particular circumstances as well as compare it with the average market indicator.
X3 - is the profitability ratio that is estimated as a ratio of earnings before interest and taxes to average total assets or shareholders’ equity. This indicator shows to what extent bank’s earnings are sufficient to cover expenses and generate profit. The following banks exhibit the highest ratio: JSC CITI (0.11), JSC ALBN (0.05) и JSC HCBN (0.04). It implies that these banks are relatively profitable taking into account that the average value of this ratio in market is -0.01. The lowest coefficient is generated for JSC BVTB (-0.07). Generally speaking, the ratio might be indicative of the management efficiency in terms of enhancing banks’ profitability, since it reveals the relationship between banks’ income and their assets and essentially measures general profitability of banks’ assets. As for the above discussed indicators, the determination of optimal level of profitability and understanding its impact on banks’ further performance depends on particular circumstances as well as on the average indicator that exist in market (-0.01).
X4 - is the ratio of shareholders’ equity to total liabilities. A lower ratio suggests that bank tends to finance its growth using more debt capital. However, it is important to note that the specificity of banking industry is such that the major part of its liabilities is represented by deposit products. And in case of deteriorating quality of investment/loan, this may imply the leverage position, which in turn increases the risk of bank run, and as a consequence enhances the chances of bankruptcy. Thus, for banking industry having higher equity to liabilities ratio is more favourable. According to the results of the analysis, the following banks exhibit higher ratio if compared to the average value for the sample representing market (0.17): JSC KZI BANK (0.57), JSC HCBN (0.37), JSC HCSBK and JSC CITI (0.29). Thus, similar to the above-discussed ratios, the optimal level for equity to liabilities ratio is defined in accordance with the average indicator that exist in market.
Table-4 depicts the tendency of the Altman Z-score model for the commercial banks of Kazakhstan for the period between 2011 and 2015. Despite the fact that banks tend to have quite different results, the average Z-score in the market is found to be no less than 3.20, which is greater than 2.60 (Safe Zone).
Table 4. Tendency of Altman’s Z-Score Model for Commercial Banks of Kazakhstan for 2011-2015
Z(A)= 3.25+6.56X1+3.26X2+6.72X3+1.05X4 |
||||||
No. |
Name of a Bank |
Period |
||||
2011 |
2012 |
2013 |
2014 |
2015 |
||
1 |
JSC HSBK |
4.15 |
3.76 |
3.27 |
4.69 |
4.46 |
2 |
JSC KKGB |
2.86 |
2.62 |
1.68 |
1.94 |
2.34 |
3 |
JSC TSBN |
2.00 |
3.19 |
3.39 |
3.15 |
3.53 |
4 |
JSC SBER |
1.14 |
2.80 |
2.73 |
2.39 |
1.92 |
5 |
JSC ATFB |
1.07 |
10.27 |
1.85 |
10.00 |
9.56 |
6 |
JSC CCBN |
2.89 |
2.54 |
2.22 |
1.62 |
2.47 |
7 |
JSC ASBN |
0.07 |
0.78 |
2.09 |
8.51 |
9.03 |
8 |
JSC CSBN |
2.59 |
5.39 |
3.84 |
5.89 |
5.08 |
9 |
JSC EUBN |
1.90 |
2.31 |
1.82 |
2.58 |
2.17 |
10 |
JSC HCSBK |
5.59 |
4.16 |
4.62 |
4.93 |
3.75 |
11 |
JSC CITI |
5.24 |
5.32 |
4.34 |
4.61 |
5.19 |
12 |
JSC NFBN |
4.18 |
5.06 |
4.03 |
4.16 |
4.47 |
13 |
JSC NRBN |
2.32 |
-0.57 |
3.36 |
-0.15 |
0.29 |
14 |
JSC ALBN |
4.98 |
4.94 |
4.12 |
3.82 |
4.63 |
15 |
JSC ABBN |
2.56 |
2.92 |
2.26 |
3.91 |
4.06 |
16 |
JSC ATBN |
1.90 |
4.58 |
2.64 |
4.01 |
3.25 |
17 |
JSC LARI |
5.00 |
2.66 |
1.26 |
1.81 |
2.10 |
18 |
JSC BVTB |
3.98 |
2.46 |
3.63 |
2.50 |
3.84 |
19 |
JSC HCBN |
5.50 |
5.56 |
3.09 |
5.21 |
5.37 |
20 |
JSC KSBN |
5.22 |
2.09 |
2.42 |
0.87 |
1.77 |
21 |
JSC EXBN |
2.58 |
2.73 |
3.43 |
2.27 |
1.54 |
22 |
JSC KZI BANK |
7.49 |
7.12 |
7.71 |
4.72 |
3.62 |
23 |
JSC KIBN |
2.21 |
3.35 |
3.79 |
3.70 |
5.85 |
ā |
3.36 |
3.74 |
3.20 |
3.79 |
3.93 |
|
Source: Compiled by the author based on the financial statements of banks
The estimation of solvency score (S-score) for 23 commercial banks of Kazakhstan for 2015 are provided in Table-5. According to the results, all banks considered in the study gain solvency score that is above acceptable threshold of not less than 70 percent for Bankometer model. Thus, it implies that, in 2015 banks tend to maintain sound financial performance and, in general, do not experience serious financial difficulties, and therefore can be classified as “Super Sound Banks”. In particular, JSC CITI has the highest score of 308.9 percent, followed by JSC KZI BANK and JSC HCSBK with S-scores of 273.3 percent and 240.5 percent respectively. The lowest score is estimated for JSC ALBN and amounts 107.4 percent. Further, it is important to note that the average S-score for banking sector in 2015 is equal to 166.9 percent, which significantly exceeds the safety limit of 70 percent for applied model.
Table-5. Evaluation and Results of S-Score for Commercial Banks of Kazakhstan for 2015
S = 1.5X1+1.2X2+3.5X3+0.6X4+0.3X5+0.4X6 |
||||||||
Variables |
X1 |
X2 |
X3 |
X4 |
X5 |
X6 |
S |
|
CA≥ 045%
|
EA≥ 02%
|
40%≤CAR≥08%
|
NPL≤ 15%
|
CI≤ 40%
|
LA≤ 65%
|
|||
No. |
Name of a Bank |
2015 |
||||||
1 |
JSC HSBK |
11.9 |
11.8 |
18.2 |
20.4 |
82.6 |
55.7 |
155.6 |
2 |
JSC KKGB |
10.3 |
7.4 |
11.5 |
12.3 |
92.0 |
81.3 |
132.6 |
3 |
JSC TSBN |
8.5 |
6.3 |
9.5 |
1.9 |
59.2 |
86.4 |
107.5 |
4 |
JSC SBER |
9.5 |
8.4 |
10.5 |
10.2 |
98.6 |
69.7 |
125.1 |
5 |
JSC ATFB |
13.2 |
7.0 |
14.7 |
21.2 |
80.4 |
74.9 |
146.9 |
6 |
JSC CCBN |
10.9 |
6.2 |
14.2 |
15.5 |
72.5 |
72.1 |
133.7 |
7 |
JSC ASBN |
17.4 |
15.1 |
21.6 |
30.1 |
77.4 |
63.7 |
187.4 |
8 |
JSC CSBN |
15.8 |
10.5 |
21.5 |
8.9 |
40.9 |
65.9 |
156.4 |
9 |
JSC EUBN |
9.1 |
7.1 |
10.3 |
10.5 |
69.5 |
73.1 |
115.1 |
10 |
JSC HCSBK |
22.4 |
22.4 |
40.1 |
0.4 |
49.1 |
58.5 |
240.5 |
11 |
JSC CITI |
22.7 |
22.7 |
66.8 |
0.0 |
17.2 |
19.2 |
308.9 |
12 |
JSC NFBN |
12.1 |
12.1 |
13.2 |
20.5 |
27.9 |
93.7 |
137.5 |
13 |
JSC NRBN |
14.8 |
14.2 |
18.0 |
24.0 |
55.0 |
81.7 |
166.4 |
14 |
JSC ALBN |
18.2 |
15.1 |
7.5 |
6.5 |
34.2 |
51.6 |
107.4 |
15 |
JSC ABBN |
12.9 |
9.9 |
13.9 |
4.9 |
60.5 |
59.9 |
125.6 |
16 |
JSC ATBN |
10.0 |
0.0 |
28.4 |
2.5 |
177.1 |
26.1 |
179.9 |
17 |
JSC LARI |
12.5 |
8.9 |
17.0 |
12.0 |
60.8 |
55.2 |
137.0 |
18 |
JSC BVTB |
18.6 |
11.6 |
23.5 |
6.6 |
147.3 |
62.4 |
198.1 |
19 |
JSC HCBN |
24.4 |
24.4 |
21.7 |
10.3 |
25.4 |
91.9 |
193.5 |
20 |
JSC KSBN |
19.3 |
15.2 |
21.5 |
18.6 |
53.9 |
72.9 |
180.0 |
21 |
JSC EXBN |
21.4 |
18.2 |
24.9 |
2.9 |
76.1 |
107.1 |
209.4 |
22 |
JSC KZI BANK |
36.2 |
36.2 |
43.0 |
0.2 |
2.2 |
56.6 |
273.3 |
23 |
JSC KIBN |
7.7 |
6.5 |
14.0 |
17.3 |
83.7 |
41.3 |
120.8 |
ā |
15.6 |
12.9 |
21.1 |
11.2 |
67.1 |
66.1 |
166.9 |
|
Where, SS – Super Sound |
||||||||
Source: Compiled by the author based on the financial statements of banks
Essence of six key financial ratios, based on which the Bankometer equation is developed and analysis of 23 commercial banks of Kazakhstan for 2015 is conducted (Table-5):
CA - is the main standard that must be followed by credit organizations and one of the most important indicators of bank performance, as well as its soundness and capacity. In general, it characterizes bank’s ability to mitigate possible financial losses using its own capital, while maintaining their customer’s funds. Capital to asset ratio defines whether bank possesses sufficient capital to support its assets. A higher ratio suggests that bank employs more internal and external sources of funds to invest in various assets. According to the core principles of IMF, the minimum level of bank’s capital ratio must be 4.5% in 2015. The results of the analysis show that JSC KZI BANK has the highest ratio of 36.2%, followed by JSC HCBN (24.4%), JSC CITI (22.7%), JSC HCSBK (22.4%), JSC EXBN (21.4%) and JSC KSBN (19.3%). With respect to other banks, they also maintain CA ratio at sufficient level of no lower than 4.5%. In accordance with the prudential standards established by the National Bank of the Republic of Kazakhstan, the minimum level of bank’s capital ratio is 7% in 2015. It is important to note that all banks in the sample demonstrate adequate CA ratio, which is more than 7%.
EA - characterizes the relationship between shareholders’ equity and bank’s total assets. With respect to Kazakhstan banking system, this ratio indicates the degree of bank’s independence from creditors. In essence, the lower the ratio the more bank relies on debt financing and the less stable its financial position. Thus, equity to assets ratio is one those indicators that is critical for the assessment of financial performance of banks and their profitability in long run. In this way, a higher ratio is preferable and viewed as an indicator of rational financial position, since the more assets bank finances using own capital the less it depends on external sources of funding. According to the recommendations of IMF, the EA coefficient should be no lower than 2%. The results of the analysis suggest that all banks in the sample maintain recommended level of EA ratio, which is higher than 2%.
CAR - is the ratio of bank’s capital to its risk-weighted asset (RWA). RWA is a bank’s assets weighted according to the degree of credit risk, estimated in accordance with the formula that is defined by the regulator (the National Bank of the Republic of Kazakhstan). Capital adequacy ratio serves as an indicator of bank’s financial stability and its solvency, which may signal whether bank is able meet its obligations by a certain date. Thus, if bank fails to conform to capital adequacy standards, it risks being unable to survive. The minimum capital adequacy ratio that banks must maintain is 8% in order to function properly. According to the results of the analysis, the following banks have the highest CAR: JSC CITI (66.8%), JSC KZI BANK (43.0%), JSC HCSBK (40.1%), JSC ATBN (28.4%) and JSC EXBN (24.9%). There is one bank in the sample that exhibit CAR below minimum requirement (JSC ALBN with 7.5%). As for other banks under the study, CAR is maintained at sufficient level of more than 8%.
NPL - is an indicator of bank’s asset quality, where NPL is a loan on which borrower fails to fulfill the conditions stipulated by loan agreement. In general, it refers to the delay in payment of interest for the use of loan or repayment of loan principal. According to the definition provided by IMF, non-performing loan is any loan in which interest and principal payment are more than 90 days overdue, or other reasons exist to doubt that payments will be made in full. NPL ratio can be viewed as an indicator of bank’s efficiency. The lower the coefficient, the more efficient the bank. Similarly, a higher ratio implies that bank is managed improperly and inefficiently. Moreover, large share of non-performing loans can bring down bank. In compliance with the international banking practice, the NPL coefficient of less than 5% is considered to be acceptable. As a result of the analysis, the following banks have NPL ratio of less 5%: JSC KZI BANK (0.2%), JSC HCSBK (0.4%), JSC TSBN (1.9%), JSC ATBN (2.5%), JSC EXBN (2.9%), and JSC ABBN (4.9%). Interestingly that JSC CITI does not possess non-performing loans in its portfolio in 2015. As for the banks with highest NPL ratio, they include JSC ASBN (30.1%), followed by JSC NRBN (24.0%), JSC ATFB (21.2%), JSC NFBN (20.5), JSC HSBK (20.4%), and JSC KSBN (18.6%). In general, the results presented in Table-5 are indicative of the fact that the banking system of Kazakhstan experiences serious problems with respect to non-performing loans.
CI - is a coefficient that indicates the cost level typical for banking activity. The lower the ratio, the higher the bank’s income, whereas a higher ratio implies lower profitability. In accordance with core principles of IMF, the CI ratio must be no more than 40%. The following banks analysed in the framework of the study maintain adequate CI ratio: JSC CITI (17.2%), JSC NFBN (27.9%), JSC ALBN (34.2%) and JSC HCBN (25.4%). Other banks in the sample fail to meet minimum requirement. In particular, JSC ATBN exhibits the highest CI ratio of 177.1%, and is preceded by JSC BVTB with 147.3%, JSC SBER with 98.6%, JSC KKGB with 92.0%, JSC KIBN with 83.7%, and etc.
LA – can be viewed as an indicator of bank’s liquidity. Banks prefer to have higher LA ratio, since it indicates higher profitability. However, it is important to note that banks have to meet the requirements established by the National Bank of the Republic of Kazakhstan with respect to amount of liquid assets that are necessary for daily operations and maintenance of cash reserve ratio. IMF recommends this ratio to be less than 65%. The results of the analysis indicate that 11 banks in the sample follow the IMF standards, whereas 12 banks fail to meet minimum LA ratio.
Table-6 presents the results of financial performance of 23 banks analyzed in the framework of the study based on Bankometer model. For the investigated period between 2011 and 2015, all commercial banks are found to be financially stable and none of them is placed in the bankruptcy risk zone. To be more specific, S-score of all banks in the sample is more than 70 percent, which implies that they are solvent and can be classified as “Super Sound”.
Table 6. Tendency of S-Score for Commercial Banks of Kazakhstan for 2011-2015
S = 1.5X1 + 1.2X2 + 3.5X3 + 0.6X4+ 0.3X5 + 0.4X6 |
||||||
No. |
Name of a Bank |
Period |
||||
2011 |
2012 |
2013 |
2014 |
2015 |
||
1 |
JSC HSBK |
153.1 |
163.9 |
172.3 |
177.9 |
155.6 |
2 |
JSC KKGB |
227.8 |
229.5 |
199.3 |
146.6 |
132.6 |
3 |
JSC TSBN |
100.2 |
104.8 |
142.5 |
129.1 |
107.5 |
4 |
JSC SBER |
124.0 |
114.2 |
147.4 |
124.8 |
125.1 |
5 |
JSC ATFB |
170.4 |
197.1 |
164.0 |
148.8 |
146.9 |
6 |
JSC CCBN |
139.3 |
157.3 |
172.3 |
167.5 |
133.7 |
7 |
JSC ASBN |
155.6 |
394.1 |
138.5 |
255.1 |
187.4 |
8 |
JSC CSBN |
172.7 |
140.9 |
184.1 |
167.2 |
156.4 |
9 |
JSC EUBN |
128.7 |
121.2 |
177.5 |
128.5 |
115.1 |
10 |
JSC HCSBK |
1104.3 |
388.9 |
356.1 |
288.7 |
240.5 |
11 |
JSC CITI |
215.9 |
123.9 |
181.7 |
247.4 |
308.9 |
12 |
JSC NFBN |
165.0 |
134.4 |
164.7 |
141.5 |
137.5 |
13 |
JSC NRBN |
197.5 |
215.8 |
242.7 |
170.5 |
166.4 |
14 |
JSC ALBN |
104.8 |
112.3 |
142.1 |
122.6 |
107.4 |
15 |
JSC ABBN |
133.7 |
111.7 |
213.8 |
153.8 |
125.6 |
16 |
JSC ATBN |
110.5 |
119.5 |
169.4 |
213.2 |
179.9 |
17 |
JSC LARI |
279.1 |
172.9 |
242.9 |
140.7 |
137.0 |
18 |
JSC BVTB |
285.0 |
161.0 |
210.2 |
152.3 |
198.1 |
19 |
JSC HCBN |
241.4 |
196.3 |
257.8 |
215.1 |
193.5 |
20 |
JSC KSBN |
198.3 |
212.2 |
255.0 |
190.7 |
180.0 |
21 |
JSC EXBN |
171.9 |
239.7 |
237.1 |
272.2 |
209.4 |
22 |
JSC KZI BANK |
229.6 |
215.2 |
255.3 |
416.9 |
273.3 |
23 |
JSC KIBN |
162.7 |
158.9 |
139.0 |
160.5 |
120.8 |
ā |
216,2 |
182.0 |
198.5 |
188.3 |
166.9 |
|
Source: Compiled by the author based on the financial statements of banks
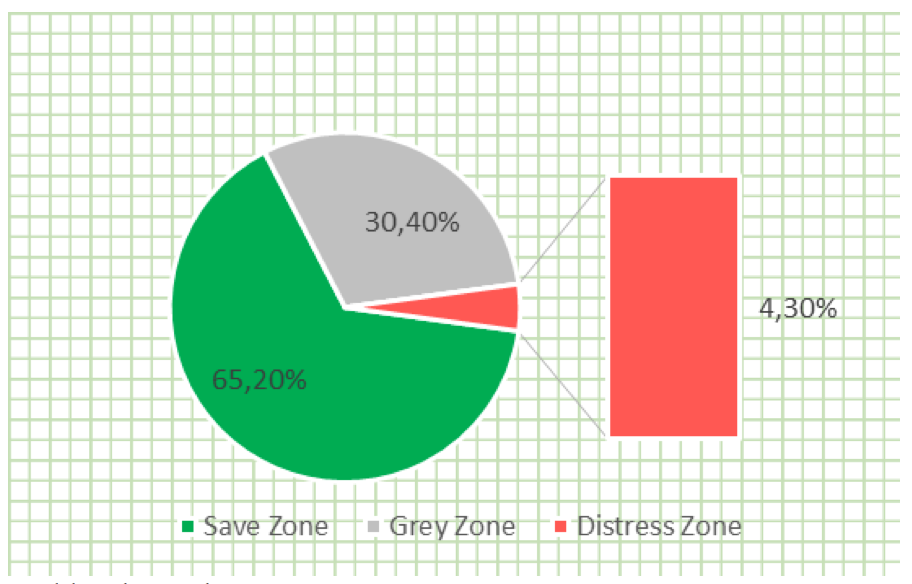
The results of the Altman Z-score model are indicative of the fact that in 2015 there are 15 commercial banks in Safe Zone, 7 banks in Grey Zone and 1 bank in Distress Zone (Figure-1 and Table-3). The average Z-score in the market amounts 3.93 in 2015.
Figure 1. Results of Altman’s Z-Score Model for
Commercial Banks of Kazakhstan for 2015
Source: created by the author
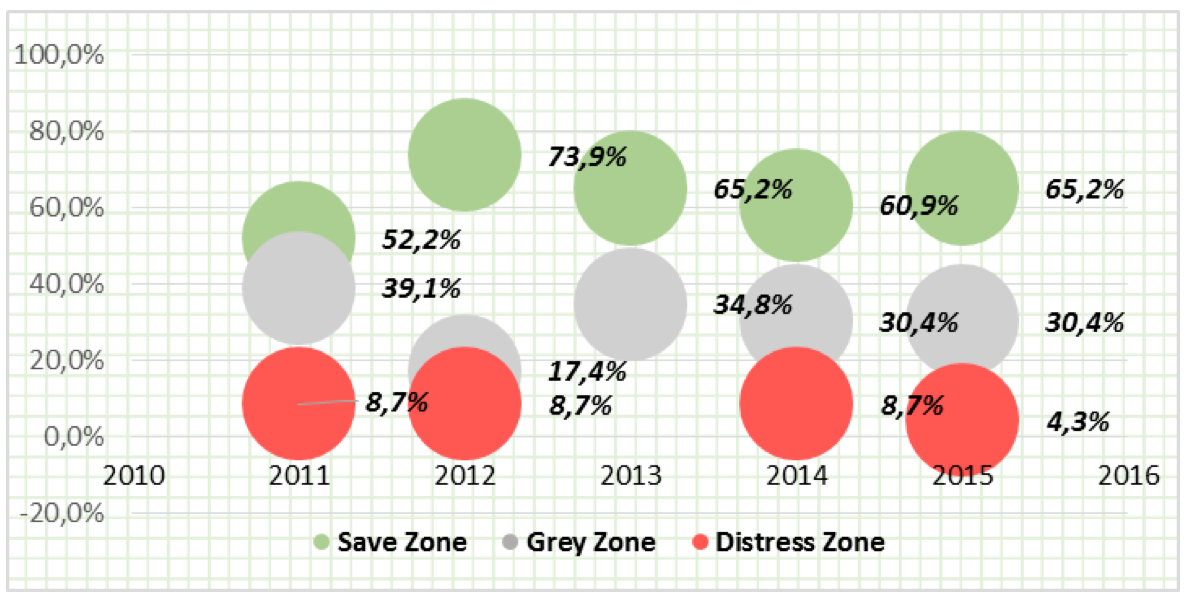
Further, the results presented in Table-4 and Figure-2 for the Altman model suggest that in 2011 there are 12 commercial banks in “Safe Zone”, 9 banks in “Grey Zone”, and 2 banks in “Distress Zone”. As for 2012, 17 commercial banks are placed in “Safe Zone”, 4 banks – in “Grey Zone”, and 2 banks – in “Distress Zone”. Further, one can observe 15 banks to be in “Safe Zone” and 8 banks to be in “Grey Zone” in 2013. Finally, in 2014 there are 14 commercial banks in “Safe Zone”, 7 banks in “Grey Zone”, and 2 banks in “Distress Zone”.
Figure 2. Tendency of Altman’s Z-Score Model for
Commercial Banks of Kazakhstan for 2011-2015
Source: created by the author
Figure-3 presents the average indicator of the financial performance of 23 banks analysed in the framework of this study based on Bankometer model for the period between 2011 and 2015. The results are indicative of the fact that during the investigated period the average S-score in the market is more than 70% that implies solvency of all banks and financial stability of banking system as a whole.
Figure 3. Average S-Score in the Market for 2011-2015
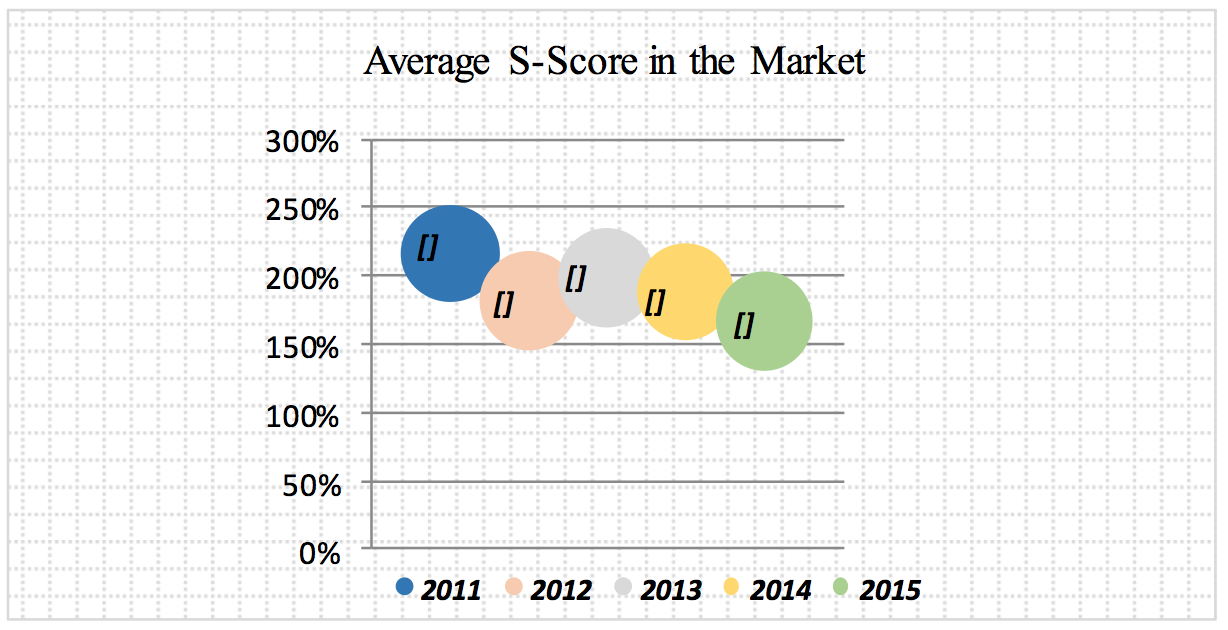
Source: created by the author
Using the sample of Kazakhstan banks, the author conducts an analysis and tests the predictive ability of different approaches toward the evaluation of probability of bank’s bankruptcy that are based on various methodological foundations. The results of investigation verify the hypothesis stated above:
H1: Little predictive ability of the Altman Z-score model to forecast financial situation of banks of the Kazakhstan.
H2: Superior predictive ability of Bankometer (S-score) model to forecast financial situation of banks of the Kazakhstan.
For the purpose of investigation, the author collects the data for the sample of 23 commercial banks that are different in terms of size, public participation and presence of foreign capital. These banks tend to demonstrate relatively good financial performance, and none of them default during the period of the analysis (2011-2015).
According to the results of the Altman Z-score model, some banks under the study are predicted to have a risk of bankruptcy. In particular, Altman’s model suggests that for the investigated period the risk of bankruptcy amounts 4.3% up to 8.7%. As for the Bankometer model, which is relatively recently developed, the results are indicative of the fact that there are no bankrupt banks in the sample for the analyzed period, which in general reflects and reaffirms the realities of today. Indeed, the banking system of Kazakhstan is strongly supported by the state policy that is aimed at the maintenance of stability of the financial system, which is actively promoted since the start of the financial crisis in 2008 and reinforced with various state programs after devaluation processes that take place in 2014-2015. This factor should be taken into consideration when selecting the appropriate bankruptcy prediction model in order to prevent crisis tendencies inherent to banking system and enhance its stability.
Altman, E.I., 1968. Financial ratios, discriminant analysis and the prediction of corporate bankruptcy. Journal of Finance, 4. Date Views 23.04.2017 www.jstor.org/stable/2978933?seq=1#page_scan_tab_contents.
Altman, E.I., 2005. An Emerging Market Credit Scoring System for Corporate Bonds. Emerging Markets Review, 6. Date Views 23.04.2017 www.iiiglobal.org/sites/default/files/29creditscoringsystem0.pdf.
Consolidated Financial Statements of Commercial Banks of the Republic of Kazakhstan. Date Views 23.04.2017 www.kase.kz/ru/emitters.
Current State of the Banking Sector of Kazakhstan, 2016. Date Views 23.04.2017 www.nationalbank.kz.
Kokkoris, I. and M. Anagnostopoulou, 2016. Altman Z-Score Bankruptcy Analysis in the Greek Banking Sector. International Corporate Rescue, 1. Date Views 23.04.2017 papers.ssrn.com/sol3/papers.cfm?abstract_id=2896391.
Lavrushin, O.I., editor, 2014. Stability of Banking System and Development of Banking Policy: A Monograph A Team of Authors. Moscow: KNORUS.
Makkar, A. and S. Singh, 2012. Evaluating the Financial Soundness of Indian Commercial Banks: An Application of Bankometer. National Conference on Emerging Challenges for Sustainable Business, IIT Rurkee Date Views 23.04.2017 ru.scribd.com/doc/118298856/07-Evaluating-the-Financial-Soundness-of-Indian-Anita-Makkar-FINC025.
Mostofa, S., S. Rezina and S. Hasan, 2016. Predicting the Financial Distress in the Banking Industry of Bangladesh: A Case Study on Private Commercial Banks. Australian Academy of Accounting and Finance Review, 1. Date Views 23.04.2017 papers.ssrn.com/sol3/papers.cfm?abstract_id=2814922&download=yes.
Rahman, Z., 2017. Financial Soundness Evaluation of Selected Commercial Banks in Bangladesh: An Application of Bankometer Model. Research Journal of Finance and Accounting, 2. Date Views 23.04.2017 www.iiste.org/Journals/index.php/RJFA/article/view/35047/36048.
Roli, P., 2014. Z Score Estimation for Indian Banking Sector. International Journal of Trade, Economics and Finance, 6. Date Views 23.04.2017 www.ijtef.org/papers/425-M21025.pdf.
Shar, H.A., M. ali Shah and H. Jamali, 2010. Performance Evaluation of Banking Sector in Pakistan: An Application of Bankometer. International Journal of Business and Management, 8. Date Views 23.04.2017 www.ccsenet.org/journal/index.php/ijbm/article/view/6916.
The National Bank of the Republic of Kazakhstan: Financial Stability Report of Kazakhstan, 2014. Date Views 23.04.2017 www.nationalbank.kz/?docid=954&switch=english.
The Report of the National Bank of the Republic of Kazakhstan Assessment of Risks in the Financial System of Kazakhstan, 2015. Date Views 23.04.2017 www.nationalbank.kz/cont/%D0%93%D0%9E_2015_%20%D1%80%D1%83%D1%81%D1%81%D0%BA_.pdf.
Uddin, M. and K. Masud, 2015. Financial Health Soundness Measurement of Private Commercial Banks in Bangladesh: An Observation of Selected Banks. The Journal of Nepalese Business Studies, 1. Date Views 23.04.2017 papers.ssrn.com/sol3/papers.cfm?abstract_id=2754130.
1. University of International Business, 050010, Kazakhstan, Almaty, Abay Street, 8a. E-mail: aitolkynbolat@mail.ru