![]() ISSN 0798 1015
ISSN 0798 1015

![]() ISSN 0798 1015
ISSN 0798 1015
Vol. 38 (Nº 49) Year 2017. Page 18
Elena Vladimirovna TARASOVA 1; Elena Nikolaevna NIKULINA 2; Natalia Valerievna MOSKVICHEVA 3
Received: 12/06/2017 • Approved: 20/07/2017
ABSTRACT: The implementation of innovative projects is an integral part of activities of high-tech industry enterprises. These projects are characterized by high level of risk that is not only due to the high agility of economic processes in the context of contemporary market economy, but also due to the growth of uncertainty related to the development rate of scientific-technical progress. Thus, it is necessary to develop new approaches to risk assessment and modify best practices taking into account the features of innovative activities. The article analyzes the advantages and disadvantages of commonly used risk assessment methods and proposes to change from scenario and probabilistic risk analysis methods to fuzzy multiple-criteria approach, which is free from the problems concerning choice of probabilistic weights and at the same time allows taking into account possible development scenarios of events. The use of triangular fuzzy numbers allows ranking the projects in terms of risk factor and justifying decision making with regard to innovative projects implementation. |
RESUMEN: La implementación de proyectos innovadores es una parte integral de las actividades de las empresas industriales de alta tecnología. Estos proyectos se caracterizan por un alto nivel de riesgo que no sólo se debe a la alta agilidad de los procesos económicos en el contexto de la economía de mercado contemporánea, sino también debido al crecimiento de la incertidumbre relacionada con la tasa de desarrollo de la tecnología científico-técnica progreso. Por lo tanto, es necesario desarrollar nuevos enfoques para la evaluación de riesgos y modificar las mejores prácticas teniendo en cuenta las características de las actividades innovadoras. El artículo analiza las ventajas y desventajas de los métodos de evaluación de riesgos comúnmente utilizados y propone cambiar de los métodos de análisis de riesgos probabilísticos y de escenarios a un enfoque de múltiples criterios difusos, que está libre de los problemas relativos a la elección de los pesos probabilísticos y al mismo tiempo permiten tener en cuenta posibles escenarios de desarrollo de eventos. El uso de números borrosos triangulares permite jerarquizar los proyectos en términos de factor de riesgo y justificar la toma de decisiones con respecto a la implementación de proyectos innovadores. |

The implementation of innovative projects at developing enterprises of high tech industries is related to the high level of risk. Increasing agility of economic processes, rapid changes in external business conditions, capital mobility, as well as high rates of technological progress lead to higher uncertainty and impede reliable assessment of the efficiency of investment funds. Management of innovative projects implementation aimed at the development of new products and new activities requires the use of scientifically grounded tools and methods, ensuring maximum consideration of current risks for making optimal decisions (Nikulina and Tarasova 2014).
Risk is an objective phenomenon related to the uncertainty of occurrence of non-desirable event. In turn, uncertainty is the incompleteness and inaccuracy of information about project implementation conditions, future costs and expected results, caused by lack of knowledge about the economic environment. Innovation activity is always associated with risks (Troshin, Burdina and Razzhevaikin 2012; Horn and Wachowicz, 2015). This is due to the fact that innovations make significant and sometimes radical changes into production processes that complicate the basic functions of management, namely analysis and decision making (Risk management of innovation project, 2009). A variety of innovations’ implementation methods in the context of dynamically developing market environment steps up the risk of an unsuccessful result due to not only errors, but also due to random coincidence.
There are various manifestations of risk situations (Gracheva, and Lyapina, 2010):
The main criteria of investment efficiency into innovative project include profitability, risk, and horizon period. The interrelation of "risk-profitability" is a motivating factor of decision making under uncertainty conditions. High-risk projects are selected for implementation only at the expectation of significant returns.
Innovative project risk management is a totality of processes associated with identification, risk analysis, and decision making that includes maximization of the positive and minimization of the negative consequences of occurrence of risk events. One of the fundamental stages in innovation project risk management is exactly the analysis of the innovation activity risks. The results of the project, innovation and competitiveness of the enterprise in general are largely dependent on the quality of risk analysis (Moskvicheva, Burko and Sokolova, 2014).
There are many different risk classifications in the finance theory. However the most common approach in the investment analysis is their division into systematic risks and nonsystematic risks (Nikulina and Tarasova 2006).
Systematic risks are determined by the market environment of the operating business. They are also often referred to as external risks or environment-related risks. Among them we can distinguish the common systematic risks and branch risks. The first risks will determine the activities of all companies operating in the country, regardless of their industry sector. Such risks include in particular, inflation, changes in currency exchange rates, political climate, etc. (Burdina, and Solovieva, 2013). The second risk category depends on the sectoral affiliation of the company and is influenced by the factors such as the nature of competition among resources’ suppliers, customers' needs, and specificity of used assets (for example, special equipment). Nonsystematic risks are internal factors influencing a particular business faced by the concerned enterprise (Troshin, Burdin, Moskvicheva, Tarasova, and Nikulina 2016).
Main groups of nonsystematic risks as well as measures to minimize them are presented in Table 1 (Spiridonova, 2016).
Table 1
Main groups of nonsystematic risks of the innovation
project and some ways of their minimization
Risk groups |
Description of the key factors |
Ways to minimize risks |
R&D-related risks (Spiridonova, E.A., 2016; Troshina, A.N., Burdina, A.A., Moskvicheva, N.V., Nikulina, E.N., Tarasova, E.V., and Rogulenko, T.M., 2016) |
— a negative result of R&D; — low efficiency of R&D; — discrepancy between R&D results and production capabilities of the enterprise.
|
— the use of the most up-to-date and effective methods of carrying out R&D; — recruitment of qualified personnel for carrying out R&D; — the conclusion of R&D contracts with reliable contractors. |
Risks related to intellectual property (Troshin, A.N. Burdina, A.A., and Razzhevaikin, D.V., 2012) |
— parallel licensing risks; — risks of unauthorized access to know-how; — risks of illegal use of intellectual property rights; — risks of patent conflicts at the expansion of sales geography.
|
— umbrella patenting; — creation of a control system over the use of know-how; — the expansion of the patent geographical spread (registration of a patent in the national patent offices of the country where the product is planned to enter the market); — marketing and patent monitoring.
|
Financial risks (Brealy, R.A. and Myers, S.C., 1995)
|
— the threat of lack of funding sources; — the threat of deterioration in financial leverage due to the inadequate ratio of borrowed and owned capital; — the threat of disappearance of the source of financing.
|
— diversification of loan capital sources; — planning optimum capital structure; — step-by-step implementation of investments to ensure dividing the loan into tranches. |
Production risks (Moskvicheva, N.V. and Melik-Aslanova, N.O., 2015; Nikulina, E.N. and Tarasova, E.V., 2016)
|
— risks of high proportion of fixed costs; — risks associated with the availability of specific assets, causing a threat for the lack of return on investment.
|
— application of new resource-saving technologies; — elimination of non-core (redundant) assets; — optimization of the number of administrative staff; — search for possible options to minimize rental payments; — analysis of the feasibility of acquiring more universal production assets with possible loss of productivity, but ready for use in another business in case of failure of the target business.
|
Contracting risks (Spiridonova, E.A., 2016) |
— disruption of negotiations and disclosure of the resulting information; — refusal of the contractors from further cooperation; — change of business terms and conditions. |
— the conclusion of option agreement that do not allow disclosing the received information; — concluding long-term contracts with contractors; — expanding the range of counterparties. |
Sales risks (Spiridonova, E.A., 2016) |
— the threat of lack of product sales; —the risk of choosing the wrong pricing policy; — the risk of contract breakdown with sales agents. |
— thorough analysis and market segmentation on the product planning stages (even in the case of its uniqueness); —products promotion in the market to reduce barriers of its perception; — conclusion of preliminary delivery contracts with proven and qualified sales enterprises. |
A list of nonsystematic risks for innovation projects represented in Table 1 is not complete. There are also risks in management, in project implementation in terms of schedule deadlines and milestones, corporate risks of a private nature, peculiarities of small businesses operation, and some other risks (Moskvicheva, Troshin, and Fomkina, 2013; Troshin, Burdin, Moskvicheva, Tarasova, and Nikulina, 2016).
Industry-specific systematic and nonsystematic risks are accounted for in cash flows of the innovation project, the overall systematic risks are accounted for in the discount rate.
The following groups of methods can be distinguished for quantitative risk analysis applied in the investment design: methods to adjust cash inflows and the discount rate; sensitivity analysis method of investments efficiency criteria; and probabilistic and statistical methods (Nikolaev, 2006).
The choice of specific method of investment risk analysis depends on the capabilities of the information base, requirements to the final results (indicators) and the security level of investment management (Nikulina and Tarasova 2014).
The main variety of the risk adjusted discount rate approach (RADR) is the calculation of discount rate as weighted average cost of capital adjusted for risk ( ). Methods of determining adjustments for the risk differ depending on information framework of the analysis and the adopted investment policy of the enterprises. The magnitude of the risk premium is determined by environment-related risks of the project (Moskvicheva, Nikulina, Tarasova, and Fomkina, 2011; Troshin, Burdin, Moskvicheva, Tarasova, and Nikulina 2016).
Certainty equivalent method involves the adjustment of cash flows of the investment depending on the reliability of estimates of their expected value. This is done by multiplying project net income at the time point by reduction factor. The magnitude of the correction factor depends on the level of operational, technological, and market risks.
A common drawback of all integrated calculation methods of efficiency indicators adjusted for risk is an implicit accounting for the degree of risk sensitiveness to investors. The methods are based on the use of average market values.
The sensitivity analysis method of investment efficiency criteria (the what-if analysis tools) allows for a quantitative assessment of the impact on the project of its key variables change. The method consists in the elimination of influence of each factor of the cash flow model and net present value (or other criterion) and the evaluation of the response of the resultant indicator (net present value, NPV; internal rate of return, IRR, and discounted pay-back period, DPP) to changes in key variables (volume of sales, prices on products and production resources, and cost of capital). At that, the limiting values of these variables at which the project still remains effective are determined (Nikulina and Tarasova 2014).
Available safety margin is compared with subjective or statistical estimate of key variables variation. The method can be modified taking into account correlations between key variables. The ratio of the change in the effective index to change in key variable is called the sensitivity coefficient, which is calculated in the same way as elasticity. The advantage of sensitivity analysis is the identification of variables that are most important for the success of the investment project. It is used to study the influence of changing specific basic variables on the investment efficiency, provided that the other variables remain unchanged (Nikulina, Tarasova, Troshin, and Fomkina, 2009). However, the principles and mechanisms of its application do not allow calculating the probability of changes as well as probabilistic indicators of the formation of exactly given NPV rather than the other. Therefore, this method may serve only the source of information for more accurate methods to account the risk. The sensitivity analysis of investments efficiency criteria gives the opportunity to assess the impact on the project of changes in its key variables as well as safety margin of these factors, though does not contain tools to calculate the risk magnitude.
Scenario method involves the forecasting of development options of the external environment and the estimates of investment efficiency for each scenario (Nikulina and Tarasova 2006). Assigning certain probabilities to scenarios, we can construct a risk profile, as well as assess the standard deviation, and the skewness of distribution. The so-called "worst-case scenario", "most likely scenario", and "optimistic scenario" are often used to assess the project that allows evaluating approximately the scatter of the project results and its profitability (or loss-making) in case of deterioration of the economic situation. Scenario method involves the following technique:
The project with the smallest value of standard deviation and variation coefficient is considered less risky.
In general, the method allows obtaining a very clear picture for different options of projects implementation as well as provides information about sensitivity and possible deviations.
A method of constructing "decision tree" is similar to the scenarios method and is based on the construction of multiple-choice prediction of the external environment dynamics. Unlike the scenarios method, this technique suggests enterprise the possibility of making own decisions that change the course of the project implementation (making choice) and a special graphical presentation of results ("decision tree"). "Decision tree" can be used both under risk and under uncertainty or full certainty. The analyst calculates the selected efficiency criterion (e.g., NPV) along each "branch" of the tree, while in case of risk analysis he assesses also the probability of each value. The obtained values can be used to construct probability curve and choose the optimal option for project implementation. In the general case, the use of this method involves implementing the following steps (Nikulina and Tarasova 2006).
The advantage of "decision tree" is the clearness of results and process analysis, while the disadvantage is its technical complexity at large sizes of “tree”.
Simulation modeling of investment processes is the most powerful and sophisticated tool for investment risk analysis and requires the use of appropriate software. Stochastic simulation is known under the name of "Monte Carlo method". The simulation modeling technique consists of several stages: identifying the deterministic and stochastic dependencies of internal variables of the project and variables of external environment, building the model, carrying out simulation based on random variations of key variables, plotting probability curves, and calculating risk factors based on the simulation results (Nikulina and Tarasova 2006).
In the general case, conducting a simulation experiment can be divided into the following stages.
The accuracy of the estimates largely depends on the quality of initial assumptions and accountancy of relationships of the variables in the external environment. Contemporary software tools allow taking into account the shape of the probability curve and correlation of dozens of external variables, however, estimating these values in practical examination is usually impossible. Investment analysts measure the variations of key variables of the macro- and microenvironment, assessing the spread in magnitudes of the secondary variables and statistical relationships between factors by expertise. Therefore, the capabilities of simulation models usually are not fully utilized.
The risk analysis algorithm when using probability and statistical methods can be described as follows:
Practical application of probabilistic and statistical methods for risk assessment of innovation projects is quite difficult due to lack of statistics, while simulation data may not give quite accurate information, because are based on judgment-based definition of probability and distributions laws. Calculation methods of statistical probabilities suggest the availability of a given degree of homogeneity within the selected class of risk events, while innovative solutions relate to such unique situations that cannot be subjected to statistical grouping. In this regard, the assessment of innovative risks is not based on statistical analysis, but rather intuitive. This makes it necessary to take into account qualitative risk assessments when carrying out quantitative analysis.
Scenario and probabilistic risk analysis methods are gradually becoming outdated. They are replaced by fuzzy multiple-criteria approach, which, on the one hand, is free from axiomatic probability as well as the problem concerning selection of probability weights, and on the other hand, include all the possible scenarios of events. A fuzzy multiple-criteria approach allows taking into account in the financial model of the economic entity qualitative aspects that do not have exact numerical evaluation. This approach makes it possible to combine, while estimating, the account of quantitative and qualitative attributes that dramatically increases the level of adequacy of the applied methods.
The uncertainty of the investment project environment is a fatal quality of the market, due to the fact that market conditions are dependent on large number of simultaneously applying factors of different nature and orientation, which are not subjected to aggregate valuations. The economy continuously generates changing economic conditions that is stipulated by the dynamics of macroeconomic factors and the rapid pace of technological progress. As far as the uncertainty is increasing, classical probabilistic descriptions give way, on the one hand, to subjective probabilities, based on expert estimation, and, on the other hand, to the probabilities, which are defined qualitatively rather than quantitatively. At that, point estimates of probability distributions are replaced by interval estimates (for expert methods) and triangular-fuzzy estimates (for methods of the fuzzy sets theory). In the risk analysis of investment project based on fuzzy-multiple approach, the concept of randomness is replaced by the concepts of expectancy and opportunity.
In the framework of innovative projects’ risk assessment it is appropriate to use triangular fuzzy numbers with membership function of the following form: "the net present value of the project is approximately equal to the expected value and definitely is within the range between the worst-case scenario and optimistic scenario " (Fig. 1).
Fig. 1
Triangular fuzzy number (NPVmin, NPVav, NPVmax)
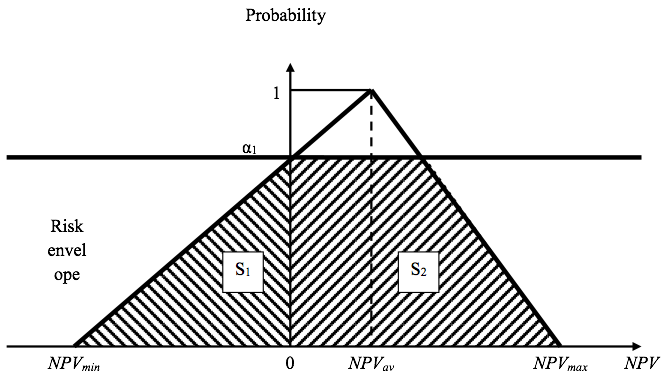
When considering the meaning of the RE parameter, we can take it for an "instability factor" of the investment project, which shows how significantly is biased the expected value of NPV towards the minimum value. From a mathematical point of view, the RE parameter is the ratio between the areas of the figure (S1) located in the negative region, and the figure (S2) situated in the positive quarter of the coordinate system (Fig. 1).
The higher the value of RE, the greater the risk of an innovation project.
Fuzzy multiple-criteria approach overcomes the shortcomings of probabilistic and mini-max approaches associated with taking into account the uncertainty. First, here a full range of possible scenarios of the investment process is formed. Second, the decision is made based on the entire set of estimates rather than just two estimates of the project efficiency. Third, the expected effectiveness of the project is not a point indicator, but represents a field of interval values with its distribution of expectations, characterized by the membership function of the corresponding fuzzy number. At the same time, balanced complete set of expectations allows estimating an integrated measure of expectation of negative results of the investment process, i.e. the degree of investment risk (Nikolaev 2006).
Thus, the method based on the fuzzy sets theory allows determining the risk of inefficiency of the investment project based on three development scenarios: the worst-case scenario, the most likely scenario, and optimistic scenario.
In this case, the calculation will be represented by the following sequence of actions.
Planning three options of cash flows is carried out when analyzing any investment project in the framework of the "scenario analysis" technique. Government agencies, such as for example, Federal State Budgetary Institution "Fund of assistance to development of small forms of enterprises in scientific-technical sphere", when taking the decision on granting of direct funding for an innovative project or development of a specific business, requires the availability of calculations based on optimistic, medium, and the worse-case scenarios presented in business plan.
However, the economic-statistical method of scenario analysis contains a number of shortcomings. In particular, each scenario is assigned a probability of its occurrence solely on the basis of expert estimation (and hence with a high degree of subjectivity). Therefore, the evaluation results can be strongly distorted. Besides, the use of a simplified modification of the scenarios method is possible only under condition of normal distribution of probabilities. Otherwise, it is necessary to apply more detailed calculation, predicting the aggregate of scenarios (certain analogue of a tree of objectives) and analyzing the probability of each of them. The considered method of calculating the project risk factor based on the theory of fuzzy sets is devoid of the indicated shortcomings.
As an example let’s consider eight innovative projects. For each project there are NPV indicators calculated for the worse-case (NPVmin), the most probable (NPVav), and optimistic (NPVmax) scenarios. Besides, risk factors such as the range of variation VAR, variance D, the standard deviation σ, variation coefficient CV, and RE are determined for each project. The results of the calculation of VAR and RE indicators are presented in Table 2.
Table 2
Calculation of VAR and RE risk factors
Project number |
NPVmax |
NPVav |
NPVmin |
RE |
VAR |
Project rating by risk level (RE) |
1 |
6000 |
4000 |
-1000 |
0.015347 |
7000 |
4 |
2 |
8000 |
2000 |
-2000 |
0.061371 |
10000 |
2 |
3 |
10000 |
4000 |
-2000 |
0.031512 |
12000 |
3 |
4 |
5000 |
3000 |
1000 |
0 |
4000 |
8 |
5 |
12000 |
10000 |
-1000 |
0.003608 |
13000 |
7 |
6 |
8000 |
1000 |
-2000 |
0.090139 |
10000 |
1 |
7 |
9000 |
4000 |
-1000 |
0.010743 |
10000 |
5 |
8 |
14000 |
4000 |
-1000 |
0.007162 |
15000 |
6 |
To calculate the statistical variability indices (E(NPV), D, σ, СV) we consider suggested by the experts four distribution laws of random discrete value NPV, presented in Table 3.
------
Table 3
Distribution laws of NPV indicator
Distribution law |
The probability of the worse-case scenario |
The probability of the most likely scenario |
The probability of optimistic scenario |
P1 |
0.25 |
0.5 |
0.25 |
P2 |
0.15 |
0.7 |
0.15 |
P3 |
0.1 |
0.5 |
0.4 |
P4 |
0.4 |
0.5 |
0.1 |
Calculation of statistical indicators according to the given distribution laws is presented in Tables 4 – 7.
------
Table 4
Statistical indicators calculated according to the law P1
Project number |
E(NPV) |
D |
σ |
CV |
Project rating by risk level (CV) |
1 |
3250 |
6687500 |
2586.020 |
0.795698 |
6 |
2 |
2500 |
12750000 |
3570.714 |
1.428286 |
2 |
3 |
4000 |
18000000 |
4242.641 |
1.060660 |
3 |
4 |
3000 |
2000000 |
1414.214 |
0.471405 |
8 |
5 |
7750 |
26187500 |
5117.372 |
0.660306 |
7 |
6 |
2000 |
13500000 |
3674.235 |
1.837117 |
1 |
7 |
4000 |
12500000 |
3535.534 |
0.883883 |
5 |
8 |
5250 |
29687500 |
5448.624 |
1.037833 |
4 |
-----
Table 5
Statistical indicators calculated according to the law P2
Project number |
E(NPV) |
D |
σ |
CV |
Project rating by risk level (CV) |
1 |
3550 |
4147500 |
2036.541 |
0.573674 |
6 |
2 |
2300 |
7710000 |
2776.689 |
1.207256 |
2 |
3 |
4000 |
10800000 |
3286.335 |
0.821584 |
4 |
4 |
3000 |
1200000 |
1095.445 |
0.365148 |
8 |
5 |
8650 |
16927500 |
4114.304 |
0.475642 |
7 |
6 |
1600 |
8340000 |
2887.906 |
1.804941 |
1 |
7 |
4000 |
7500000 |
2738.613 |
0.684653 |
5 |
8 |
4750 |
18187500 |
4264.681 |
0.897827 |
3 |
-----
Table 6
Statistical indicators calculated according to the law Р3
Project number |
E(NPV) |
D |
σ |
CV |
Project rating by risk level (CV) |
1 |
2200 |
7160000 |
2675.818 |
1.216281 |
6 |
2 |
1000 |
9000000 |
3000.000 |
3.000000 |
2 |
3 |
2200 |
14760000 |
3841.875 |
1.746307 |
3 |
4 |
2400 |
1640000 |
1280.625 |
0.533594 |
8 |
5 |
5800 |
31160000 |
5582.114 |
0.962433 |
7 |
6 |
500 |
8250000 |
2872.281 |
5.744563 |
1 |
7 |
2500 |
10250000 |
3201.562 |
1.280625 |
5 |
8 |
3000 |
19000000 |
4358.899 |
1.452966 |
4 |
------
Table 7
Statistical indicators calculated according to the law Р4
Project number |
E(NPV) |
D |
σ |
CV |
Project rating by risk level (CV) |
1 |
4300 |
4010000 |
2002.498 |
0.465697 |
6 |
2 |
4000 |
12000000 |
3464.102 |
0.866025 |
2 |
3 |
5800 |
14760000 |
3841.875 |
0.662392 |
4 |
4 |
3600 |
1640000 |
1280.625 |
0.355729 |
8 |
5 |
9700 |
13610000 |
3689.173 |
0.380327 |
7 |
6 |
3500 |
14250000 |
3774.917 |
1.078548 |
1 |
7 |
5500 |
10250000 |
3201.562 |
0.582102 |
5 |
8 |
7500 |
30250000 |
5500.000 |
0.733333 |
3 |
The performed calculations allowed drawing the following conclusions:
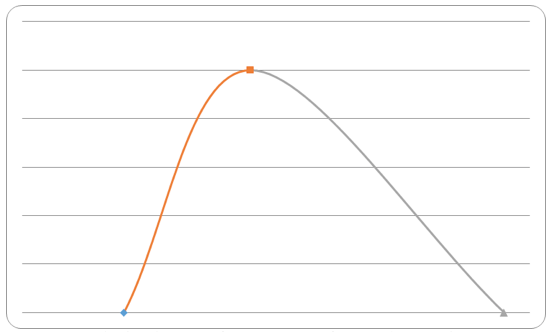
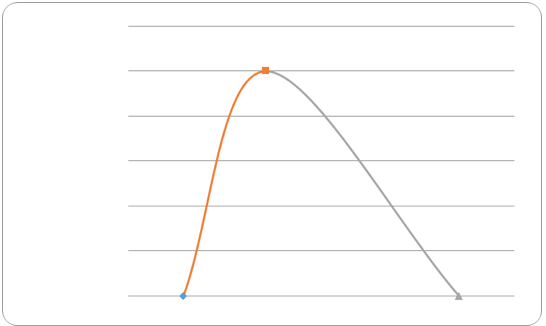
Based on assessment of the VAR variation range, project No. 8 is the most risky. However, the risk factor RE in this project is minimal, because the triangle fuzzy number is maximally shifted towards positive values of project return. The triangular fuzzy number of this project is shown in Fig. 2. The ratio of the triangle area (S1), which is in the negative plane, to the triangle area (S2), which is in the positive plane, is minimal.
Fig. 2
Triangular fuzzy number of the project No. 8.
The most risky is the project No 6. The risk factor RE of this project is maximal. As can be seen in Fig. 3, the major part of the triangular number is located in a negative region.
Fig. 3
Triangular fuzzy number of the project No. 6.
Independently of the NPV distribution law, proposed by the experts, all risk indicators (σ, CV) have shown that project No. 6 is the most risky.
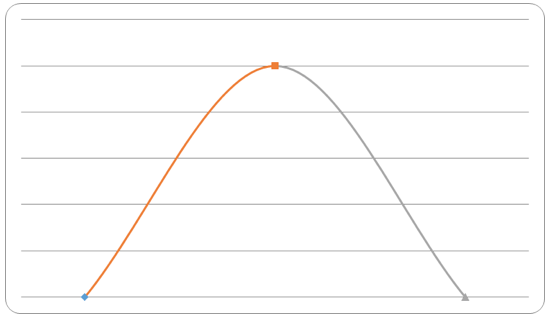
Calculations carried out with regard to the projects No. 3 and No. 8 are of special interest. Probabilistic and statistical methods (σ, CV) show that the level of risk of these projects is approximately the same. However, the RE indicator suggests that the probability of losses when implementing project No. 3 is higher. Triangular fuzzy number of the project No.3 is shown in Fig. 4. According to the risk profile, the ratio between negative and positive outcomes is higher than that for the project No. 8.
Fig. 4
Triangular fuzzy number of the project No. 3
In order to develop effective methods of risk management of investment project, it is advisable to distinguish admissible, critical, and catastrophic levels of risk. Admissible risk is the risk not creating threats to the project implementation and not having a significant negative impact on key parameters of the project. Critical risk is regarded as a risk that may have a significant impact on key project parameters, though not creating the threats to project fulfillment. Catastrophic is the risk threatening the implementation of the project and capable of destabilizing the financial condition of the enterprise. Each risk level is characterized by a certain value of RE indicator. Barrier values of the risk indicator RE are determined based on processing of statistical data on the implementation of innovative projects at the enterprise in retrospective periods of time (Nikolaev 2006).
Brealy, R.A. and Myers, S.C., 1995. Fundamentals of corporate finance. N.Y., McGRAW-HILL INC.
Burdina, A.A. and Solovieva, I.V. 2013. Analiz metodov analiza finansovyh riskov predpriyatij aviacionnoj otrasli [Evaluation of analysis methods of financial risks of the aviation industry enterprises]. Economics and Entrepreneurship, 12-1(41-1), 659-663.
Gracheva, M.V. and Lyapina, S.Yu., 2010. Upravlenie riskami v innovacionnoj deyatel'nosti [Innovation risk management]. Tutorial, Moscow, YUNITI, 350 p.
Horn J.K. and Wachowicz, G.M., 2015. Osnovy finansovogo menedzhmenta [Fundamentals of financial management]. Textbook, Moscow: Williams Publishing House.
Moskvicheva, N.V. and Melik-Aslanova, N.O., 2015. Analiz osobennostej modernizacii proizvodstvennyh moshchnostej predpriyatij aviacionnoj promyshlennosti [Analysis of the modernization characteristics of production capacities of the aviation industry enterprises]. Bulletin of the Moscow Aviation Institute, 22(4), 208-213.
Moskvicheva, N.V., Burko, M.L., Sokolova, A.A., 2014. Ocenka investicionnoj privlekatel'nosti innovacionnyh programm predpriyatij aviacionnoj promyshlennosti [Evaluation of investment attractiveness of innovative programs of the aviation industry enterprises]. Proceedings of the 15th International scientific-practical conference, St.Petersburg, pp. 102-109.
Moskvicheva, N.V., Nikulina, E.N., Tarasova, E.V., and Fomkina, V.I., 2011. Voprosy ocenki stoimosti predpriyatij aviacionnoj promyshlennosti [The issues of the aviation industry enterprises valuation]. Monograph, Moscow, MAI-PRINT, 204 p.
Moskvicheva, N.V., Troshin, A.N., and Fomkina, V.I., 2013. Voprosy ehkonomicheskogo obosnovaniya processov reorganizacii predpriyatij aviacionnoj promyshlennosti [Issues of an economic substantiation of the processes of enterprise reorganization in the aviation industry]. Monograph, Moscow: MAI Print.
Nedosekin, A.O., 2003. Metodologicheskie osnovy modelirovaniya finansovoj deyatel'nosti s ispol'zovaniem nechetko-mnozhestvennyh opisanij [The methodological basis of financial activity simulation with the use of fuzzy multiple-criteria approach]. Higher Doctorate thesis in economics. St. Petersburg University of Economics and Finance, St.Petersburg, 280 p.
Nikolaev, Yu.V., 2006. Razrabotka modeli upravleniya riskami investicionnyh proektov na transportno-ehkspeditorskom predpriyatii [Development of risk management model of investment projects at the freight forwarding enterprise]. Ph.D. thesis in economics. Moscow Aviation University, Moscow, 253 p.
Nikulina, E.N. and Tarasova, E.V., 2006. EHkonomicheskaya ocenka investicij [Economic assessment of investments]. Tutorial. Moscow: MAI Print, 98 p.
Nikulina, E.N. and Tarasova, E.V., 2014. Analiz metodicheskogo obespecheniya tekhniko-ehkonomicheskogo obosnovaniya investicionnyh proektov v aviacionnoj promyshlennosti [Analysis of the methodological support of feasibility study of investment projects in the aviation industry]. Proceedings of the 15th International scientific-practical conference, St.Petersburg, pp. 148-155.
Nikulina, E.N. and Tarasova, E.V., 2014. Tekhnologiya kommercheskoj i innovacionnoj ocenki investicionnyh proektov v aviacionnoj otrasli [Commercial and innovative evaluation technology of investment projects in the aviation sector]. Bulletin of Rybinsk State Aviation Technical University named after P.A.Soloviov, 1(28), 151-157
Nikulina, E.N. and Tarasova, E.V., 2016. Metodika ocenki ehffektivnosti modernizacii ispytatel'nyh podrazdelenij predpriyatij po proizvodstvu letatel'nyh apparatov [Assessment technique of modernization efficiency of the testing divisions of the aircraft manufacturing enterprises]. Bulletin of Moscow State Technological University “Stankin“ (MSTU Stankin), 1(36), 91-95.
Nikulina, E.N., Tarasova, E.V., Troshin, A.N., and Fomkina, V.I., 2009. Finansovaya matematika dlya investora [Financial mathematics for investor]. Monograph. Moscow: MAI-Print, 184 p.
Spiridonova, E.A., 2016. Ocenka stoimosti biznesa [Valuation of business]. Tutorial and case studies. Moscow: Youright, 299 p.
Troshin, A.N. Burdina, A.A., and Razzhevaikin, D.V., 2012. Tekhnologiya ocenki innovacionnoj aktivnosti predpriyatij aviacionnoj otrasli [Technology to assess innovative activity of the aviation industry enterprises]. Monograph, Moscow: MAI, 176 p.
Troshin, A.N., Burdin, A.A., Moskvicheva, N.V., Tarasova, E.V., and Nikulina, E.N., 2016. Finansovyj menedzhment [Financial management]. Tutorial. Moscow: INFRA-M, 331 p.
Troshina, A.N., Burdina, A.A., Moskvicheva, N.V., Nikulina, E.N., Tarasova, E.V., and Rogulenko, T.M., 2016. Mechanism to analyze economic reliability of the innovational potential of aircraft enterprises. International Journal of Applied Business and Economic Research, 14, 747-765.
Upravlenie riskami innovacionnogo proekta [Risk management of innovation project], 2009. Institute of Regional Economics and Management. St. Petersburg. Retrieved 17.04.2017 from http://works.doklad.ru/view/ yFH0PTAv4ds/all.html
1. Moscow Aviation Institute (State University of Aerospace Technologies), 4 Volokolamskoje Shosse, Moscow 125993, Russia
2. Moscow Aviation Institute (State University of Aerospace Technologies), 4 Volokolamskoje Shosse, Moscow 125993, Russia
3. Moscow Aviation Institute (State University of Aerospace Technologies), 4 Volokolamskoje Shosse, Moscow 125993, Russia. E-mail: moskvichevanatalia@mail.ru