![]() ISSN 0798 1015
ISSN 0798 1015

![]() ISSN 0798 1015
ISSN 0798 1015
Vol. 39 (# 09) Year 2018. Page 35
Tatyana Yurevna ANOPCHENKO 1, Svetlana Viktorovna GRINENKO 2; Elena Sergeevna EDALOVA 3; Elena Konstantinovna ZADOROZHNYAYA 4; Anton Dmitrievich MURZIN 5
Received: 29/01/2018 • Approved: 20/02/2018
ABSTRACT: This article focuses on the assessment of human capital in post-Soviet countries to determine trends in reproduction processes and develop measures to regulate human capital accumulation. The amount of human capital directly affects indicators of social and economic development. Likewise, the more stable is socio-economic situation in the country, the more rational is the investment in human capital and effectiveness of its use. Post-Soviet countries demonstrate similar socio-economic development due to objective reasons, but at the same time implement different policies of human capital formation and growth. Post-Soviet countries can be attributed to associated territories, whereby the amount of human capital of each country has certain influence on the "neighbors" in terms of migration flows, qualification of migrants and labor market conditions. These factors are regulated within the framework of economic and social solutions implemented by those countries, their educational policies and labor market development programs. In addition, post-Soviet countries are still developing in accordance with the "center-periphery" model which is also analysed in the survey. |
RESUMEN: Este artículo se centra en la evaluación del capital humano en los países post-soviéticos para determinar las tendencias en los procesos de reproducción y desarrollar medidas para regular la acumulación de capital humano. La cantidad de capital humano afecta directamente a los indicadores de desarrollo social y económico. Asimismo, cuanto más estable sea la situación socioeconómica en el país, más racional es la inversión en capital humano y la efectividad de su uso. Los países post-soviéticos demuestran un desarrollo socioeconómico similar debido a razones objetivas, pero al mismo tiempo implementan diferentes políticas de formación y crecimiento de capital humano. Los países post-soviéticos pueden ser atribuidos a territorios asociados, por lo que la cantidad de capital humano de cada país tiene cierta influencia en los "vecinos" en términos de flujos migratorios, calificación de migrantes y condiciones del mercado laboral. Estos factores están regulados en el marco de las soluciones económicas y sociales implementadas por esos países, sus políticas educativas y programas de desarrollo del mercado laboral. Además, los países post-soviéticos siguen desarrollándose de acuerdo con el modelo de "centro-periferia" que también se analiza en la encuesta. |

Post-Soviet countries form a differentiated subregion in terms of territorial structure, presented by territories with different density of economic activity (Usachev, 2008). The countries of this subregion are facing similar economic challenges, which justifies sourcing of growth points and correlation, such as the integration cooperation using established socio-economic relations. Undoubtedly, many geopolitical and ethnic factors influence the integration processes. However, in this research we will only consider socio-economic factors and development indicators in relation to post-Soviet countries focusing on the human capital development of these territories as a priority driver affecting the economic growth (Kashepov, Sulakshin, Malchinov, 2008).
This is due to the fact that, according to the article, human capital development provides such effects as economic growth, social tension reduction, as well as the possibility of regulating socially demanded and economically prioritized professional training programs (Bogomolova, Masych, 2011). Another factor of human capital reproduction is the population migration, the level and direction of which determine not only the labor availability of enterprises and industries in quantitative terms, but also the quality of human capital, and the return of its use in the economy as a whole (Grinenko, Zadorozhnyaya, 2011). The migration level and direction depend on geopolitical and ethno-economic social factors, including the level of education and, consequently, human capital development. However, there are genetically specific features that have emerged in the previously unified post-Soviet space.
The study is also based on the concept of "contiguity" of post-Soviet countries in a broad sense: geographic (territorial), economic and social conjugacy. In particular, social conjugation is most evident in the border areas where family ties act as the basis for labor migration. Educational conjugation is due to vocational education system which existed in the USSR together with the lack of training in certain professional fields.
The indicators of post-Soviet countries at the time of the disintegration of the USSR are presented in Table 1 and show that Russia covering 76.8% of the geographical area of the USSR has accounted for 51.41% of its population, producing 60.4% of GDP in the sectors of the national economy. Ukraine covering 2.69% of the Soviet Union territory and having 18.03% of its population has produced a significant share of GDP – 17.9%. Finally, Kazakhstan is on the 3rd place with 6.8% of GDP, 12.14% of the USSR territory and 5.77% of its population. The smallest contribution to GDP accounted for Armenia, Kyrgyzstan and Tajikistan, each covering less than 1% of the USSR territory and having less than 2% of its population.
Table 1
The overall performance of post-Soviet countries at the time of
the disintegration of the USSR (1989-1990) (Kalabekov, 2017)
No. |
Country |
Land area (% within the USSR) |
Population (% within the USSR – 1989) |
Life Expectancy |
GDP adjusted by PPP (% within the USSR – 1990) |
Number of specialists with higher and secondary special education per 1000 workers |
1 |
Russia |
76.80 |
51.41 |
69.3 |
60.4 |
282 |
2 |
Kazakhstan |
12.14 |
5.77 |
68.8 |
6.8 |
251 |
3 |
Ukraine |
2.69 |
18.03 |
70.5 |
17.9 |
271 |
4 |
Turkmenistan |
2.17 |
1.23 |
66.4 |
1.0 |
230 |
5 |
Uzbekistan |
1.99 |
6.95 |
69.5 |
2.0 |
251 |
6 |
Belarus |
0.92 |
3.56 |
71.3 |
2.7 |
271 |
7 |
Kyrgyzstan |
0.88 |
1.50 |
68.8 |
0.5 |
250 |
8 |
Tajikistan |
0.64 |
1.78 |
69.6 |
0.6 |
228 |
9 |
Azerbaijan |
0.39 |
2.45 |
71.0 |
2.0 |
252 |
10 |
Georgia |
0.31 |
1.90 |
72.8 |
1.3 |
248 |
11 |
Lithuania |
0.29 |
1.29 |
71.5 |
1.7 |
299 |
12 |
Latvia |
0.29 |
0.93 |
69.6 |
1.1 |
274 |
13 |
Estonia |
0.20 |
0.55 |
70.0 |
0.8 |
300 |
14 |
Moldova |
0.15 |
1.51 |
68.7 |
0.8 |
244 |
15 |
Armenia |
0.13 |
1.15 |
71.8 |
0.4 |
269 |
After the collapse of the Soviet Union fifteen independent states were formed in the post-Soviet space, with approximately the same set of political and socio-economic problems, but with a different resource base, mostly economic, due to the implementation of the planned economy bounded by national, economic and social "networks", which so far determines their conjugation in various areas.
The losses incurred by former Soviet Union countries resulting from market transformations demanded sustainable economic growth based on technological modernization, innovation implementation and human capital growth. However, this did not happen. On the contrary, in the 2000s post-Soviet countries enhanced their role as suppliers of energy resources, raw materials and labor for the world markets. Assessing the level of socio-economic development of the newly independent countries, we use the Global Competitiveness Index which is calculated in conformity with the extensive annual research conducted by the World Economic Forum (WEF) in conjunction with a network of partner organizations – leading research institutes and companies of the post-Soviet countries. A special feature of this indicator is its binary character, i.e. the index is calculated through a combination of public statistics and results of the companies' executives survey, and includes twelve components of competitiveness: quality of institutions, infrastructure, macroeconomic stability, health and primary education, higher education and vocational training, goods and services market efficiency, labor market efficiency, financial market development, technological level, size of the domestic market, business competitiveness and innovative potential. Characteristics of post-Soviet countries according to this indicator and its main components in the context of the research topic are presented in Table. 2.
Out of fifteen countries, Belarus, Turkmenistan and Uzbekistan were not included in the WEF study. The Global Competitiveness Index of Belarus is based on other publications, but without specifying its components. The top four are the Baltic countries: Estonia (4.8), Lithuania and Latvia (4.5) and Azerbaijan (4.6). The four outsiders are Kyrgyzstan (3.7) and Ukraine, Tajikistan, Moldova (4.0). The indicators that form the index are allocated accordingly.
Despite the past 25 years of the independent development of post-Soviet countries, their economy integrated into a large complex system largely influences the formation of associated markets through various forms of interconnections, which requires meaningful management to preserve and develop these ties or create new ones, substituting and enabling each country to achieve new goals.
Let us supplement the assessment of the independent development of post-Soviet countries based on the index of global competition with a number of indicators characterizing the formation and development of the labor market (Table 3). The sample was made based on statistical data on countries with subsequent reduction to comparable measurement units.
The indicators of Tables 2 and 3 reflect the change of leaders and allow us to judge the success of socio-economic development in a number of independent states.
Table 2
Indicators of post-Soviet countries according to the Index of Global Competitiveness
(The Global Competitiveness Report 2016–2017 is published by the World Economic Forum , 2017)
No. |
Country |
Index of Global Competitiveness |
Indicator |
|||||
Macroeconomic stability |
Health and primary education |
Higher education and vocational training |
Labor market efficiency |
Level of technological development |
Innovation potential |
|||
1 |
Russia |
4.4 |
5.3 |
5.9 |
5.0 |
4.4 |
4.2 |
3.3 |
2 |
Kazakhstan |
4.4 |
4.7 |
5.4 |
4.6 |
4.8 |
4.4 |
3.4 |
3 |
Ukraine |
4.0 |
3.1 |
6.1 |
5.0 |
4.3 |
3.4 |
3.4 |
4 |
Turkmenistan |
- |
- |
- |
- |
- |
- |
- |
5 |
Uzbekistan |
- |
- |
- |
- |
- |
- |
- |
6 |
Belarus (Belarus could easily beat many EU countries in the Global Competitiveness Index , 2015) (CASE Belarus Macroeconomic Review of Belarus , 2016) |
4.34 |
- |
- |
- |
- |
- |
- |
7 |
Kyrgyzstan |
3.7 |
4.3 |
5.2 |
4.1 |
3.9 |
2.8 |
2.7 |
8 |
Tajikistan |
4.0 |
4.6 |
5.6 |
4.1 |
4.4 |
2.8 |
3.3 |
9 |
Azerbaijan |
4.6 |
5.2 |
5.7 |
4.2 |
4.8 |
4.5 |
3.6 |
10 |
Georgia |
4.3 |
5.2 |
5.9 |
4.1 |
4.5 |
4.2 |
2.8 |
11 |
Lithuania |
4.5 |
5.6 |
6.2 |
5.3 |
4.3 |
5.6 |
3.7 |
12 |
Latvia |
4.5 |
5.6 |
6.2 |
5.1 |
4.7 |
5.3 |
3.3 |
13 |
Estonia |
4.8 |
6.1 |
6.5 |
5.5 |
5.0 |
5.4 |
4.1 |
14 |
Moldova |
4.0 |
4.9 |
5.4 |
4.1 |
4.1 |
4.4 |
2.6 |
15 |
Armenia |
4.1 |
4.3 |
5.4 |
4.4 |
4.4 |
4.0 |
3.2 |
In terms of the index of global competitiveness, the top three former USSR countries Russia, Ukraine and Kazakhstan gave way to the Baltic States and Azerbaijan. In terms of GDP the top three countries are Russia, Kazakhstan and Belarus. Let us suppose that post-Soviet countries find a way to integrate and based on the data of Table 3 calculate the percentage of their population and GDP in the total amount, which will allow assessing the development (see Table 4).
Table 3
Socio-economic indicators for post-Soviet countries
(all the currencies recalculated to the USA dollar exchange rate of April 20, 2017)
No. |
Country |
Population, million people |
Average annual number of the employed, M people |
Total number of the unemployed, M people |
Average monthly salary, $ |
GDP, $ M |
1 |
Russia (Federal Service of State Statistics of the Russian Federation, 2017) |
146.82 |
68.389 |
4.243 |
609.63 |
1541450 |
2 |
Kazakhstan (Agency of the Republic of Kazakhstan on Statistics, 2017) |
17.75 |
8.522 |
0.441 |
494.28 |
146831 |
3 |
Ukraine (State Statistical Service of Ukraine, 2017) |
42.37 |
16.443 |
1.678 |
224.35 |
41390 |
4 |
Turkmenistan (World Bank, 2017), (State Statistics Committee of Turkmenistan, 2017) |
5.373 |
- |
- |
344.09 |
35855 |
5 |
Uzbekistan (Uzbekistan in figures, 2017) |
29.994 |
11.628 |
0.016 |
217.34 |
19704 |
6 |
Belarus (National Statistical Committee of the Republic of Belarus, 2017) |
9.505 |
4.413 |
0.031 |
394.60 |
50460 |
7 |
Kyrgyzstan (National Statistical Committee of the Kyrgyz Republic, 2017) |
6.019 |
0.534 |
0.055 |
269.01 |
6764 |
8 |
Tajikistan (Statistical Agency under President of the Republic of Tajikistan, 2017) |
8.551 |
1.042 |
0.057 |
109.04 |
5507 |
9 |
Azerbaijan (State Statistical Committee of the Republic of Azerbaijan, 2017) |
9.705 |
4.671 |
0.028 |
266.42 |
8690 |
10 |
Georgia (National Statistics Office of Georgia, 2017) |
3.720 |
1.779 |
0.241 |
375.95 |
14163 |
11 |
Lithuania (National Statistical Committee of the Republic of Lithuania, 2017) |
2.849 |
1.171 |
0.158 |
864.30 |
41459 |
12 |
Latvia (Central Statistical Bureau of Latvia, 2017) |
1.968 |
0.893 |
0.095 |
936.82 |
27288 |
13 |
Estonia (National Statistical Committee of the Republic of Estonia, 2017) |
1.317 |
0.583 |
0.060 |
1289.09 |
6094 |
14 |
Moldova (National Bureau of Statistics of the Republic of Moldova, 2017) |
3.550 |
1.219 |
0.004 |
264.92 |
6513 |
15 |
Armenia (National Statistical Service of the Republic of Armenia , 2017) |
2.983 |
1.006 |
0.221 |
387.33 |
3133 |
The comparison of the 1989 and 2015 indicators suggest that:
Russia had retained its positions and remained the leader both in terms of population and in terms of GDP, while taking the 4th place in terms of average monthly wages and having a low level of unemployment;
Ukraine having practically retained its positions in terms of population (with a decrease of 3.5%), had reduced the GDP level 8.5 times with the level of unemployment above the normal – 9.26%;
Uzbekistan and Azerbaijan demonstrated population growth with a twofold decrease in GDP and insignificant unemployment;
Kyrgyzstan and Tajikistan showed population growth with a significant decline in GDP and a high level of unemployment;
Kazakhstan and Turkmenistan had improved all the above indicators;
Belarus had retained its indicators practically at the same level;
Georgia showed a decline in the indicators and a high level of unemployment;
Lithuania and Latvia showed population decline along with GDP growth, rather high wages, along with a high level of unemployment;
Estonia unlike other Baltic countries, had reduced the level of GDP while having the highest average monthly salary in the entire subregion;
Moldova demonstrated a decline in all the indicators;
Armenia experienced a decline in all the above indicators with the highest unemployment level in the post-Soviet space.
Table 4
Comparison of the 1989 and 2015 indicators of the subregion countries
Country |
Population |
GDP adjusted by PPP |
Unemployment rate, % |
||
(% of the USSR – 1989) (Statistical compilation / Goskomstat USSR, 1989) |
(% of the Union of Post-Soviet countries –2015) |
(% of the USSR – 1989) |
(% of the Union of Post-Soviet countries – 2015) |
||
Russia |
51.41 |
50.20 |
60.4 |
78.83 |
5.84 |
Kazakhstan |
5.77 |
6.07 |
6.8 |
7.51 |
4.92 |
Ukraine |
18.03 |
14.49 |
17.9 |
2.12 |
9.26 |
Turkmenistan |
1.23 |
1.84 |
1.0 |
1.83 |
- |
Uzbekistan |
6.95 |
10.26 |
2.0 |
1.01 |
0.14 |
Belarus |
3.56 |
3.25 |
2.7 |
2.58 |
0.70 |
Kyrgyzstan |
1.50 |
2.06 |
0.5 |
0.35 |
9.34 |
Tajikistan |
1.78 |
2.92 |
0.6 |
0.28 |
5.19 |
Azerbaijan |
2.45 |
3.32 |
2.0 |
0.44 |
0.60 |
Georgia |
1.90 |
1.27 |
1.3 |
0.72 |
11.93 |
Lithuania |
1.29 |
0.97 |
1.7 |
2.12 |
11.89 |
Latvia |
0.93 |
0.67 |
1.1 |
1.40 |
9.62 |
Estonia |
0.55 |
0.45 |
0.8 |
0.31 |
9.33 |
Moldova |
1.51 |
1.21 |
0.8 |
0.33 |
0.33 |
Armenia |
1.15 |
1.02 |
0.4 |
0.16 |
18.01 |
Undoubtedly, it should be taken into account that unemployment figures are calculated on the basis of official statistics which is always lower than the actual level. Herewith, all the countries can be divided into four groups. In Figure 1, the unemployment rate is marked with color; CIS countries – with bold italic characters.
Figure 1
Country grouping by the analyzed indicators
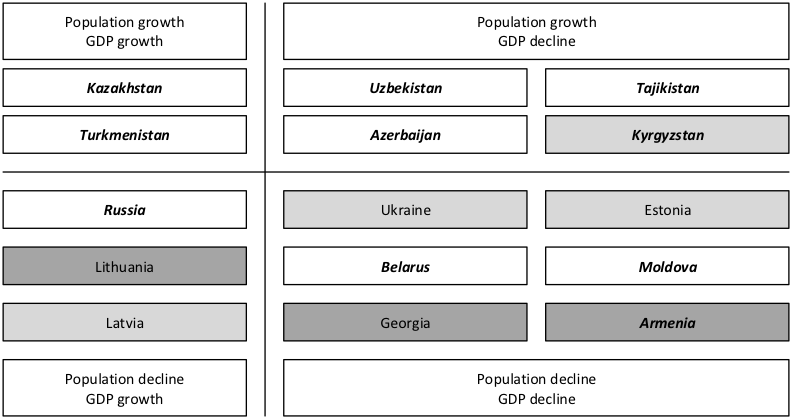
The visualization of post-Soviet countries grouping on a number of socio-economic development indicators allows us to conclude that only five out of fifteen countries have managed to improve their development level. Besides, three of them show a decrease in the number of permanent residents, and two others demonstrate a rather high level of unemployment. Nine countries have reduced all the indicators, while only Belarus has shown a very small decrease, and two other countries demonstrate a high unemployment rate.
CIS countries are present in all the groups, suggesting the possibility of building new world economic relations, realizing the potential of post-Soviet countries with the appropriate socio-economic policy.
The next stage of the study was the assessment of Russia's human capital as a territory defining the socioeconomic development of the CIS countries. The current development of the Russian economy largely depends on such source of growth as human capital, which due to the qualitative change in the economic, social and political conditions of social development, associated with the formation of knowledge economy, increases the differentiation of the Russian territories against the background of globalization and informatization. The concept of national economy development determines the process of human capital reproduction at the level of Russian federal districts as a point of growth, since it ensures the innovative development of economy (Bogomolova, Masych, 2011). To achieve goals of sustainable development, it is necessary to overcome the existing negative trends in the development of human capital, such as a decline in population and employment in the economy, increase competition in the labor market for highly qualified personnel, decrease in the number of the employed population in enterprises of the real sector, poor quality and reduction in the availability of social services in health and education.
According to the concept of long-term social and economic development of the Russian Federation until 2020 (The concept of long-term socio-economic development of the Russian Federation for the period until 2020, 2008), human development system includes two types of transformation: aimed at increasing the competitiveness of human resources, labor and social sectors of the economy; and improving the quality of the social environment and living conditions of people. These transformations reflect medium and long-term goals, priorities and major directions of demographic policy, healthcare and education modernization policies, development of the pension sphere and social assistance, cultural development, formation of effective labor and housing markets.
The foregoing has determined the focus of this study on assessing trends in the formation of human capital which has several specific features determined by geoeconomic and ethnoeconomic factors in order to justify directions of management influence that implement the principles of gender equality in the process of human capital reproduction, corresponding to contemporary social and economic imperatives of sustainable development.
Quantitative and qualitative parameters of human capital reproduction are interdependent with the demographic reproduction of the Russian population which is characterized by a decrease in the population due to a low birth rate since 1996, combined with a high mortality rate due to a poor quality of life, unfavorable socio-economic and demographic conditions, associated with the crisis of social and labor relations (Bogomolova, Masych, 2011).
Education is the most important characteristic of human capital, affecting the formation of all its other components and employment processes. The education factor plays a crucial role in increasing the pace of economic development, the living standard of the population and the quality of the workforce (Grinenko, Zadorozhnyaya, 2011). It has been determined that the qualification of workers increases three or four times more rapidly with the increase in education level compared to the increase in work experience. At the same time, the study has revealed a high degree of correlation between wages and employment levels. In Russia, the corresponding coefficient amounts to 0.72. The importance of education as a factor of economic development is even higher if we consider the processes of depopulation and ageing population in Russia (Usachev, 2008).
The analysis of the number and structure of the employed in the economy by educational level indicates that during the period from 2000 to 2012, the number of employees with higher education had increased by 8%, with secondary special education had decreased by 3%, the number of employees with secondary and basic education had decreased by 4% and 5%, respectively, while the number of employees with initial vocational education had illustrated the steady upward trend by 9%. It should be noted that in 2010 the employment rate among the population with higher vocational education was 81.2%, the unemployment rate was 4%, while with secondary vocational education it was 73.5% and 5.8%, respectively, and with primary vocational education 72.4% and 7.9%. Among the population without vocational education, the unemployment rate is significantly higher (23% on average), and the employment rate is significantly lower (17%) (The regions of Russia. Socio-economic indicators, 2012), (Federal State Statistics Service, 2011).
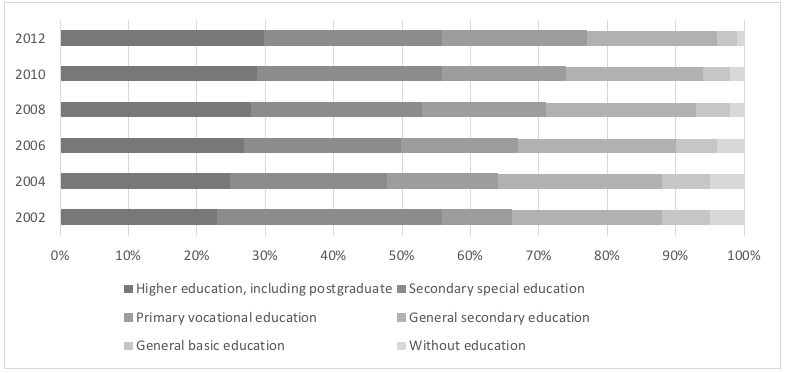
According to the survey of the population on employment issues (Figure 2), 56% of the employed population have higher or secondary vocational education (30% have higher and 26% have secondary vocational). At the same time, the share of employment of the population with higher education has increased by 7% over the past 12 years, with average professional education has decreased by 4%, with initial professional education has grown by 9% and amounted to 20% in 2012.
Figure 2
The structure of the employed population by the level of education, %
(The regions of Russia. Socio-economic indicators, 2012)
The educational factor plays a crucial role in increasing the pace of economic development, which is conceptually justified by the theory of human capital. In general, the Russian educational system ensures the growth of educational potential of its population and those employed in the economy, which is confirmed by quantitative indicators of the educational structure of the Russian population, in which the largest group is people with higher and secondary vocational education. These two categories of citizens form 50% of the country's labor resources, which leads to an upward trend in social education mobility (Bogomolova, Zadorozhnyaya, 2013).
In most countries, there is a higher ratio of male students and students who receive secondary and primary education compared to the number of female students at the same level of education. In terms of higher education, the opposite trend is observed, i.e. the number of women receiving higher education significantly exceeds the number of men, except for the Republic of Korea, Switzerland and Japan. This situation indicates a higher level of starting human capital for women, as well as a relatively low level of gender segregation in the context of education accessibility.
When assessing the level of human capital reproduction, it is necessary to resort to the calculation of the human development index. The Human Development Index is a cumulative indicator of the national human development level, therefore sometimes it is used as a synonym for such concepts as the "quality of life" or the "standard of living". This index measures the country's achievements in terms of education, the actual income of its citizens and other indicators in three main areas, including access to education measured by the adult literacy rate and the cumulative gross enrollment ratio; decent standard of living as measured by the value of gross domestic product (GDP) per capita in US dollars adjusted by the purchasing power parity (PPP).
Following are the data reflecting the HDI (human development index) for 2014 in the Russian Federation (see Table 5). The table contains data of the first and the last twenty countries on the HDI in 2014.
Table 5
Leading and lagging subjects of the Russian Federation on the human
development index ratio in 2014. (Federal State Statistics Service)
Subject |
GDP per capita, adjusted to PPP |
Income index |
Life expectancy, years |
Longevity index |
Literacy, % |
The ratio of students aged 7-24 years, % |
Education index |
HDI in 2011 |
Ranking |
Federal district |
Leading Subjects on the HDI |
|
|||||||||
Moscow |
43313 |
1 |
75.79 |
0.847 |
99.99 |
0.897 |
0.965 |
0.937 |
1 |
Central Federal District |
St. Petersburg |
27926 |
0.94 |
73.06 |
0.801 |
99.9 |
0.888 |
0.962 |
0.901 |
2 |
Northwestern Federal District |
Tyumen region |
69997 |
1 |
70.45 |
0.758 |
99.7 |
0.742 |
0.912 |
0.89 |
3 |
Ural federal district |
Sakhalin Oblast |
58557 |
1 |
65.68 |
0.683 |
99.7 |
0.71 |
0.901 |
0.861 |
4 |
Far Eastern Federal District |
Republic of Tatarstan |
28092 |
0.941 |
71.3 |
0.772 |
99.7 |
0.786 |
0.927 |
0.88 |
5 |
Volga Federal District |
Belgorod region |
27553 |
0.938 |
71.71 |
0.779 |
99.7 |
0.743 |
0.912 |
0.876 |
6 |
Central Federal District |
The Republic of Komi |
29447 |
0.949 |
67.95 |
0.716 |
99.7 |
0.79 |
0.928 |
0.864 |
7 |
Northwestern Federal District |
Tomsk region |
22784 |
0.906 |
69.53 |
0.742 |
99.7 |
0.825 |
0.94 |
0.862 |
8 |
Siberian Federal District |
Omsk region |
19209 |
0.878 |
69.5 |
0.745 |
99.5 |
0.83 |
0.94 |
0.854 |
9 |
Siberian Federal District |
Orenburg region |
23103 |
0.908 |
68.31 |
0.722 |
99.6 |
0.797 |
0.93 |
0.853 |
10 |
Volga Federal District |
Lagging Subjects on the HDI |
|
|||||||||
Republic of Kalmykia |
8074 |
0.733 |
70.8 |
0.763 |
99.4 |
0.692 |
0.893 |
0.797 |
70 |
Southern Federal District |
Ivanovo region |
9294 |
0.756 |
68.56 |
0,726 |
99,7 |
0.719 |
0.904 |
0.796 |
71 |
Central Federal District |
Altai Republic |
9157 |
0.754 |
65.4 |
0,712 |
99.5 |
0.771 |
0.92 |
0.795 |
72 |
Siberian Federal District |
Jewish Autonomous Region |
12545 |
0.806 |
63.35 |
0,678 |
99.5 |
0.715 |
0.902 |
0.795 |
73 |
Far Eastern Federal District |
Kabardino-Balkarian Republic |
8815 |
0.748 |
72.44 |
0.791 |
99,5 |
0.553 |
0.848 |
0.795 |
74 |
North-Caucasian Federal District |
Karachay-Cherkess Republic |
8136 |
0.734 |
72.85 |
0.798 |
99.3 |
0.572 |
0.853 |
0.795 |
75 |
North-Caucasian Federal District |
Republic of Buryatia |
11313 |
0.789 |
66.09 |
0.673 |
99.5 |
0.774 |
0.921 |
0.795 |
76 |
Siberian Federal District |
Republic of Khakassia |
16425 |
0.851 |
67.75 |
0.607 |
99.7 |
0.747 |
0.914 |
0.79 |
77 |
Siberian Federal District |
Tyva Republic |
8273 |
0.737 |
61.39 |
0.685 |
99.6 |
0.781 |
0.924 |
0.782 |
78 |
Siberian Federal District |
Republic of Ingushetia |
5489 |
0.669 |
76.29 |
0.855 |
98.2 |
0.5 |
0.821 |
0.782 |
79 |
North-Caucasian Federal District |
Chechen Republic |
5118 |
0.657 |
72.13 |
0.786 |
98.3 |
0.615 |
0.86 |
0.768 |
80 |
North-Caucasian Federal District |
Note: * The Rostov region is ranked 45 out of 80 possible in the rating of the subjects of the Russian Federation. The income index in the Rostov region is 0.81, the life expectancy is 70.28 years, the longevity index is 0.75, the literacy is 99.7%, the proportion of students aged 7-24 is 0.728%, the education index is 0.907, and the HDI in 2014 is 0.824.
For many years leaders in the human potential development have been Moscow and St. Petersburg, as well as lagging subjects are still the republics of the North Caucasian Federal District. It should be noted that the leadership of the subjects is due to the high level of GDP per capita, income, literacy and life expectancy. Both leaders and outsiders demonstrate a high longevity index, though the data on longevity in this or that area is not necessarily the evidence of a high level of the national demographic policy. This indicator can often point to the ethnic characteristics inherent in this region.
Among laggards on the HDI in 2014, apart from the subjects of the North Caucasian Federal District, are the Republic of Tyva, Khakassia, Buryatia, the Jewish Autonomous Region and others.
Migration is one of the most important factors in the human capital reproduction.
Thus, the subjects of the Central and Northwestern Federal District have been the centers of attraction of domestic migration flows for quite a long period of time.
This is confirmed by Rosstat (Federal State Statistics Service) data for 2015 (see Table 6). The table shows the so-called migration "checkerboard" of federal districts, from which you can see the number of migrants and immigrants for each federal district.
Table 6
Migration attractiveness of the federal districts of the
Russian Federation (Federal State Statistics Service)
The number of people migrated to the FD |
The number of people migrated from other federal districts |
||
Volga Federal District |
530 538 |
Central Federal District |
621 545 |
Siberian Federal District |
376 651 |
Northwestern Federal District |
281 778 |
Central Federal District |
366 155 |
Volga Federal District |
243 393 |
Ural federal district |
230 722 |
Southern Federal District |
210 549 |
Northwestern Federal District |
205 053 |
Siberian Federal District |
204 465 |
Southern Federal District |
165 101 |
Ural federal district |
173 921 |
Far Eastern Federal District |
127 753 |
North-Caucasian Federal District |
90 040 |
North-Caucasian Federal District |
100 063 |
Far Eastern Federal District |
86 893 |
Volga Federal District |
530 538 |
Central Federal District |
478 994 |
Siberian Federal District |
376 651 |
Volga Federal District |
308 294 |
Central Federal District |
366 155 |
Siberian Federal District |
256 557 |
Ural federal district |
230 722 |
Northwestern Federal District |
240 633 |
Northwestern Federal District |
205 053 |
Ural federal district |
190 282 |
Southern Federal District |
165 101 |
Southern Federal District |
174 708 |
Far Eastern Federal District |
127 753 |
North-Caucasian Federal District |
136 918 |
North-Caucasian Federal District |
100 063 |
Far Eastern Federal District |
126 198 |
By the end of 2015, 987,700 people had arrived to the Central Federal District. Traditionally, movements within federal districts account for a significant proportion of migratory flows.
Primarily, this refers to the Volga, Siberian, Ural and Far-Eastern Federal Districts. Their migration ratio within the Federal District exceeds 50% of the total migration number from other federal districts.
This fact indicates the "washout" of human capital from the peripheral entities to the federal district centers.
In the Central, North-Western, Southern and North-Caucasian Federal Districts, the situation is quite the opposite and over 50% of the total migration is the migration to other federal districts.
Besides, the structure of migration flows and their volume also differ. Thus, the number of arrivals from other regions significantly exceeds the number of those who left their regions from the Central, North-Western and Southern Federal Districts. At the same time the Volga, Siberian, Ural, North-Caucasian and Far Eastern Federal Districts demonstrate the opposite situation. Migration flows to other regions exceed the number of arrivals from these regions.
Following the analysis, it is necessary to assess the labor market and the level of human capital development in the associated countries. The problem of formation and development of the local labor market in Georgia is quite acute, as confirmed by the study of the National Democratic Institute (NDI) carried out in March 2013, in which 3,103 people were interviewed, who named the job problem the most important national issue (61%) (Tukhashvili, 2013). According to M. Tukhashvili, despite the economic recovery, the conjuncture of the Georgian labor market and the cost of labor do not contribute to reducing the high intensity of labor migration (Shishkina, 2012). The study has also revealed that the labor contingent with a very high educational potential is "sent" to labor emigration, while abroad they are employed in secondary labor markets, which causes professional dequalification.
In August 2013, the Georgian Government approved the national strategy for the formation of the Georgian labor market along with the action plan for the state strategy of the labor market formation for 2013-2014. The need to develop such a document is justified by the fact that even with mass unemployment over a third of employers (in some regions and spheres this ratio amounts to 70-80%) face serious problems when searching for personnel. The Georgian government believes that the underdevelopment of the labor market infrastructure is one of the most possible reasons for this. According to the research conducted by the Government, there is serious structural and qualitative imbalance between the demand and supply of labor in the labor national market (Russia and the countries of the world, 2016). Typical features of the Georgian labor market have become extended working hours, heavy and harmful working conditions, absence of vacations, long unpaid probation period, delay in wages, unjustified dismissal from work, age discrimination, discrimination on membership in the trade union or for political reasons (Business Georgia). According to the Georgian National Statistics Service, the unemployment rate in the country is 15-16%. Meanwhile, according to experts, this figure is at least 35-40%, and considering the incomplete and inefficient employment it is even 45-50%.
To address these problems, the country is expected to establish legislative, methodological, informational and organizational systems to implement major components of the state policy in the field of employment. The "Employment Promotion Centers" will implement programs to update the database of employees, employers, job creation within the framework of public work and in infrastructure projects, vocational training/retraining programs for the unemployed in accordance with the local labor market requirements.
The assessment of the situation on the Ukrainian labor market shows positive dynamics despite a difficult economic situation. These findings were derived from the study of the International HR website "Head Hunter Ukraine". The most dynamic industries with the largest number of new vacancies were production, raw materials extraction, tourism and restaurant business. At the same time, it should be emphasized that the number of vacancies for young specialists has increased.
According to the statistical data, the level of employment in the Ukrainian labor market in 2004 was 64.7%, with the unemployment rate of 7.5%. According to experts, one of the main problems of the modern labor market in Ukraine is the lack of quality jobs with decent wages. Another problem is the employment of people over 45 who often lose their jobs because of the non-compliance with qualification requirements of the modern labor market. The next priority problem is the employment of young specialists, which requires state support for the first job placement, providing a guaranteed interview with employers to the young specialist in case of their compliance with most of the job requirements, creation of a separate specialized labor exchange, financing of measures to promote youth employment which will contribute to the creation of a highly developed, stable and developing national economy in the Ukraine (Kuchin, 2012).
For comparison, we have selected countries belonging to different groups: Ukraine with its almost unchanged (from the Soviet period) figures, Georgia with its high unemployment and decline in most socio-economic indicators. Despite this, the analysis of statistical data and the study of formation and development processes of the labor market determining the level and efficiency of accumulated human capital in post-Soviet countries makes it possible to highlight the following similar "symptoms":
Existence of constantly open vacancies, the difficulty of staff recruiting with a high level of unemployment and significant labor migration;
Substantial excess of the level of youth unemployment over the total level of unemployment in the country;
Inconsistency of competences, knowledge and skills obtained in the education system with needs of the labor market and employers' requirements;
Significant labor migration in all post-Soviet countries.
Among specific features should be noted the following:
Division of countries into two groups – members of the CIS and non-CIS countries since they have different directions of migration flows. However, there are two exceptions: Georgia and Ukraine;
Migration of both unskilled workers and highly skilled manpower, excess of demand over supply for skilled personnel, while migrants often work abroad in the secondary labor markets as unskilled workers;
High level of female unemployment for Islamic countries, the need to involve women in the labor market.
After we have revealed similarities in development patterns and specific features of local labor markets, and analyzed the functioning of post-Soviet educational systems, peculiarities of youth labor market and migration flows within the framework of conjugated territories, we are able to form an informational basis to reconcile interests of countries in the above mentioned subregion.
A systematic approach to the evaluation of the socio-economic development of post-Soviet countries in the context of human capital development leads to the following conclusions:
The study was funded by the Russian Foundation for Basic Research (RFBR) within the research project No. 17-02-00296.
Agency of the Republic of Kazakhstan on Statistics. (2016). Retrieved September 29, 2017, from http://www.stat.gov.kz/
Belarus in the Global Competitiveness Index. (2016). Retrieved September 29, 2017, from https://thinktanks.by/publication/2015/12/26/l
Bogomolova, I.S., & Masych, M.A. (2011). Vosproizvodstvo trudovogo potentsiala v sisteme sotsialno-ekonomicheskikh i demograficheskikh faktorov [Labor potential reproduction in the system of socio-economic and demographic factors]. Izvestiya Yuzhnogo federalnogo universiteta. Tekhnicheskie nauki, 11(124), 17-23.
Bogomolova, I.S., & Zadorozhnyaya, E.K. (2011). Statisticheskoe sopostavlenie parametrov razvitiya trudovogo potentsiala v sovremennykh usloviyakh [Statistical comparison of the labor development potential in modern conditions]. Izvestiya Yuzhnogo federalnogo universiteta. Tekhnicheskie nauki, 6, 21.
Business Gruziya [Business Georgia]. (2008). Retrieved September 29, 2017, from http://bizzone.info/stats/EFFkkVuyFZ.php
CASE Belarus Macroeconomic Review of Belarus (No. 7, November 2016). Retrieved September 29, 2017, from http://case-belarus.eu/wp-content/uploads/2016/12/
Central Statistical Bureau of Latvia. (2017). Retrieved September 29, 2017, from http://www.csb.gov.lv/en
Federalnaya sluzhba gosudarstvennoi statistiki RF [Federal Service of State Statistics of the Russian Federation]. (1999-2017). Retrieved September 29, 2017, from http://www.gks.ru/
Federalnaya sluzhba gosudarstvennoi statistiki. Tendentsii na rynke truda (analiticheskoe issledovanie) [Federal Service of State Statistics. Trends in the labor market (analytical study)]. (2011). Statisticheskii byulleten 2011 goda. Retrieved September 29, 2017, from http://www.gks.ru/
Grinenko, S.V., & Zadorozhnyaya, E.K. (2011). Razvitie obrazovaniya i nauki kak osnovnoi faktor formirovaniya chelovecheskogo kapitala [Development of education and science as a major factor in the formation of human capital]. Izvestiya Yuzhnogo federalnogo universiteta. Tekhnicheskie nauki, 11(124), 23-27.
Kalabekov, I.G. (2017). SSSR i strany mira v tsifrakh [The USSR and the nations of the world in numbers]. Retrieved September 29, 2017, from http://su90.ru/
Kashepov, A.V., Sulakshin, S.S., & Malchinov, A.S. (2008). Rynok truda: problemy i resheniya [Labor market: problems and solutions]. Moscow: Nauchnyi ekspert.
Kontseptsiya dolgosrochnogo sotsialno-ekonomicheskogo razvitiya Rossiiskoi Federatsii na period do 2020 goda [The concept of long-term socio-economic development of the Russian Federation for the period until 2020] (approved by the decree of the Government of the Russian Federation of November 17, 2008 No. 1662-r). Retrieved September 29, 2017, from http://www.economy.gov.ru/minec/activity/sections/strategicplanning/concept/
Kuchin, S.P. (2012). "Chelovecheskii kapital" i problemy trudoustroistva molodezhi v sovremennoi Ukraine ["Human capital" and the problem of youth employment in the modern Ukraine]. Ekonomika i upravlenie, 3.
Narodnoe obrazovanie i kultura v SSSR [Public education and culture in the USSR]. (1989). Moscow: Finansy i statistika.
National Bureau of Statistics of the Republic of Moldova. (2017). Retrieved September 29, 2017, from http://www.statistica.md/
National Statistical Committee of the Republic of Belarus. (1998-2017). Retrieved September 29, 2017, from http://www.belstat.gov.by/
National Statistical Committee of the Republic of Estonia. (2017). Retrieved September 29, 2017, from http://www.stat.ee/en
National Statistical Committee of the Republic of Lithuania. (2017). Retrieved September 29, 2017, from http://osp.stat.gov.lt/en/web/guest/home
National Statistics Office of Georgia. (2017). Retrieved September 29, 2017, from http://www.geostat.ge/
Natsionalnaya statisticheskaya sluzhba respubliki Armeniya [National Statistical Service of the Republic of Armenia]. (1999-2017). Retrieved September 29, 2017, from http://www.armstat.am/ru/
Natsionalnyi statisticheskii komitet Kyrgyzskoi Respubliki [National Statistical Committee of the Kyrgyz Republic]. (2015). Retrieved September 29, 2017, from http://www.stat.kg/ru/
Regiony Rossii. Sotsialno-ekonomicheskie pokazateli 2012-2015. Rosstat [Regions of Russia. Socio-economic indicators 2012-2015. Rosstat] (2012). Moscow.
Rossiya i strany mira [Russia and the countries of the world]. (2016). Retrieved September 29, 2017, from http://www.gks.ru/free_doc/doc_2016/world16.pdf
Shishkina, E.S. (2012). Rossiiskii rynok truda: problemy i perspektivy [Russian labor market: problems and prospects]. Vestnik SamGU, 101 (101).
State Statistical Committee of the Republic of Azerbaijan. (2002-2017). Retrieved September 29, 2017, from http://www.stat.gov.az/
State Statistical Service of Ukraine. (1998-2017). Retrieved September 29, 2017, from http://www.ukrstat.gov.ua/
State Statistics Committee of Turkmenistan. (2008-2017). Retrieved September 29, 2017, from http://www.stat.gov.tm/ru/
State Statistics Service of Ukraine. (1998-2017). Retrieved September 29, 2017, from http://www.ukrstat.gov.ua/
Statistical Agency under President of the Republic of Tajikistan. (2004-2017). Retrieved September 29, 2017, from http://www.stat.tj/
Tukhashvili, M. (2013). Problems of socio-economic reintegration of returning migrants in Georgia. CARIM-East RR 2013/11, Robert Schuman Centre for Advanced Studies, San Domenico di Fiesole (FI): European University Institute.
Usachev, V.I. (2008). Trudovoi potentsial poreformennoi Rossii: sotsialno-demograficheskie aspekty [Labor potential of post-reform Russia: socio-demographic aspects]. Moscow: Ekon-Inform.
Uzbekistan v tsifrakh [Uzbekistan in figures]. (2017). Retrieved September 29, 2017, from http://data.mdg-stat.uz/ru/data_finder/
Vsemirnyi bank [The World Bank]. (2017). Retrieved September 29, 2017, from http://www.vsemirnyjbank.org/ru/country/turkmenistan/
World Economic Forum. (2016). The Global Competitiveness Report 2016-2017. Retrieved September 29, 2017, from https://www.weforum.org/reports/the-global-competitiveness-report-2016-2017-1
1. Southern Federal University, 344006, Russia, Rostov-on-Don, Bolshaya Sadovaya str., 105/42
2. Southern Federal University, 344006, Russia, Rostov-on-Don, Bolshaya Sadovaya str., 105/42
3. Southern Federal University, 344006, Russia, Rostov-on-Don, Bolshaya Sadovaya str., 105/42
4. Southern Federal University, 344006, Russia, Rostov-on-Don, Bolshaya Sadovaya str., 105/42
5. Southern Federal University, 344006, Russia, Rostov-on-Don, Bolshaya Sadovaya str., 105/42. E-mail: admurzin@yandex.ru