![]() ISSN 0798 1015
ISSN 0798 1015

![]() ISSN 0798 1015
ISSN 0798 1015
Vol. 39 (# 09) Year 2018. Page 38
Maissa Emirovna SEIFULLAEVA 1; Svetlana Viktorovna PANASENKO 2; Irina Petrovna SHIROCHENSKAYA 3; Anna Borisovna TSVETKOVA 4; Jeren YEVSEYEVA 5
Received: 29/01/2018 • Approved: 15/02/2018
ABSTRACT: The article analyzes the current state of Russian export markets of agricultural products, the impact that export and import have on the economic situation due to the introduction of import substitution and the food embargo in Russia introduced in response. The article states that the sanction regime caused a controversial impact on agricultural industry. On the one hand, the sanctions have had quite a negative impact on the export and import of dairy and meat products to the Russian Federation in the form of an increase in the procurement prices of milk, prices of milk producers, wholesalers, increasing production costs, model changes and priorities of consumer behavior. On the other hand, the sanctions allowed Russian producers to successfully occupy vacant niches and open up possibilities for accelerating the process of import substitution in Russia, provide a unique chance to gain a deserved place on the world market, increasing its effectiveness. |
RESUMEN: El artículo analiza el estado actual de los mercados de exportación rusos de productos agrícolas, el impacto que las exportaciones e importaciones tienen sobre la situación económica debido a la introducción de la sustitución de las importaciones y el embargo alimentario en Rusia introducido en respuesta. El artículo dice que el régimen de sanciones causó un impacto controvertido en la industria agrícola. Por un lado, las sanciones han tenido un impacto bastante negativo en la exportación e importación de productos lácteos y cárnicos a la Federación de Rusia en forma de aumento de los precios de adquisición de leche, precios de los productores de leche, mayoristas, aumento de los costos de producción , cambios de modelo y prioridades de comportamiento del consumidor. Por otra parte, las sanciones permitieron a los productores rusos ocupar con éxito nichos vacantes y abrir posibilidades para acelerar el proceso de sustitución de importaciones en Rusia, proporcionar una oportunidad única de ganar un lugar merecido en el mercado mundial, aumentando su efectividad. |

The research of the Russian agricultural export and import dynamics is an urgent and demanded area of researches, especially under the economic sanctions and anti-measures. The importance of the theme is also substantiated by a high role of the agricultural export from Russia as a major article of the national economy, as a whole. The share of the agro-industrial complex in the Russian export had increased from 2.30% up to 5.96% over the 2011 to 2016 period. According to the data for 2016, 7% of the Russian export of goods includes food, which is USD 17 bln. To compare, in 2015 the food export from Russia was USD 16.2 bln. (AB Center informational and analytical database of agrofood markets, 2017). The main products to export are grain, fish products, and vegetable oil. Russia is one of the world leaders in exporting them.
The goal of the research is to define the main tendencies and problems of the Russian agricultural export and import dynamics under economic sanctions. The tasks of the research include the following: to analyze the modern state of agricultural export and import (through the example of dairy, cereals, and meat products), to estimate positive and negative consequences of economic sanctions and anti-sanctions, to formulate conclusions and offers on developing agricultural export and perspectives of import substitution in Russia.
The object of the research is the export and import of agricultural products in Russia. The subject of the research is the tendencies and problems of Russian agricultural export and import dynamics under economic sanctions.
During the research a number of methods were used, including such general methods as observation, analysis and synthesis, induction and deduction, comparison and description, qualitative and quantitative analysis, system approach, and integrity of historical and logical methods. The authors used such particularly scientific methods as graphic, statistical, mathematical method of processing data, modeling, and economic experiment.
Thus, the authors’ knowledge-based observation as an empiric method allowed revealing modern tendencies and trends in agricultural export and import. The authors’ interpretation of the observation results was an important point of the observation. The comparison made it possible to reveal peculiarities of the modern period of developing agricultural export and import during several years.
The analysis and synthesis as general logical methods of knowledge made it possible to divide the object of the research in terms of basic types of dairy and meat products, and cereals to export and import, and to show their combination as an aggregate of composition elements. In its turn, the system approach allowed considering agricultural export and import as an important part of general national economic flows interrelating with the global system.
Particularly scientific economic methods allowed visualizing the obtained results in graphs and tables, processing statistical data, defining trends and making the relevant calculations.
As a whole, applying the above methods made it possible to solve the set goals and tasks of the economic research.
The analysis of the modern agricultural export and import made by the authors has shown that according to the Ministry of Agriculture, in 2016 wheat made up 27.7% of food import, frozen fish – 12.9%, sunflower oil – 9.5%, and corn – 5.6%. Besides, Russia exports crostacei (4.4% in the total volume of export), chocolate products (3.1%), barley (2.8%), and grain legumes (2.5%). It also exports sunflower seeds, meat, sugar, alcohol, vegetables and a number of other food (Tendencies of the general and non-resource export in Russia in the I quarter 2017, n. d.). The Russian Export Center also considers ready food, beverages and poultry as promising export goods.
As a whole, in 2016 Russia exported food for the amount of about USD 18 bln. This amount was larger only in 2014 when due to the ruble devaluation the total export had reached USD 18.9 bln. At the same time 76% of the Russian food is exported to the far abroad, and 24% - to CIS countries (Tendencies of the general and non-resource export in Russia in the I quarter 2017, n. d.).
In 2017 in the goods structure of the Russian export the share of food and raw materials export was 4.4%. At the same time, as compared to January 2016, the total value of these goods supplies had increased by 38.9%, and the actual volumes – by 41.9% (Customs Statistics of the External Trade. Federal Customs Service, n. d.).
According to the Russian Export Center (REC), in 2016 the main consumers of Russian food were China (10.1%), Turkey (9.2%), Egypt (7.9%), the Republic of Korea (7.8%) and Kazakhstan (7.1%) (Tendencies of the general and non-resource export in Russia in the I quarter 2017, n. d.).
According to the territorial departments of the Federal Service for Veterinary and Phytosanitary Surveillance, since the beginning of the agricultural year 2016/2017, and based on the issued phytosanitary certificates, 36.9 mln. t. of products were exported from the Russian Federation, excluding 36.2 mln. t. of those exported to the Customs Union countries.
In particular, as on the beginning of July 2017, 34,754 thous. t. of cereal crops have been exported, which is 3.5% higher than the volume in the same period of the previous season (33,587 thous. t.) (Tendencies of the general and non-resource export in Russia in the I quarter 2017, n. d.). Figure 1 shows the export of various cereal crops.
Figure 1
Directions and Strucutre of Cereal Crops Export from the Russian Federation in 2017, %
(Federal Service for veterinary and Phytosanitary Surveillance)
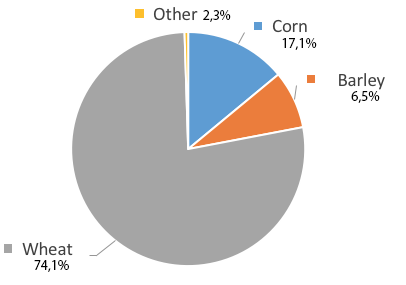
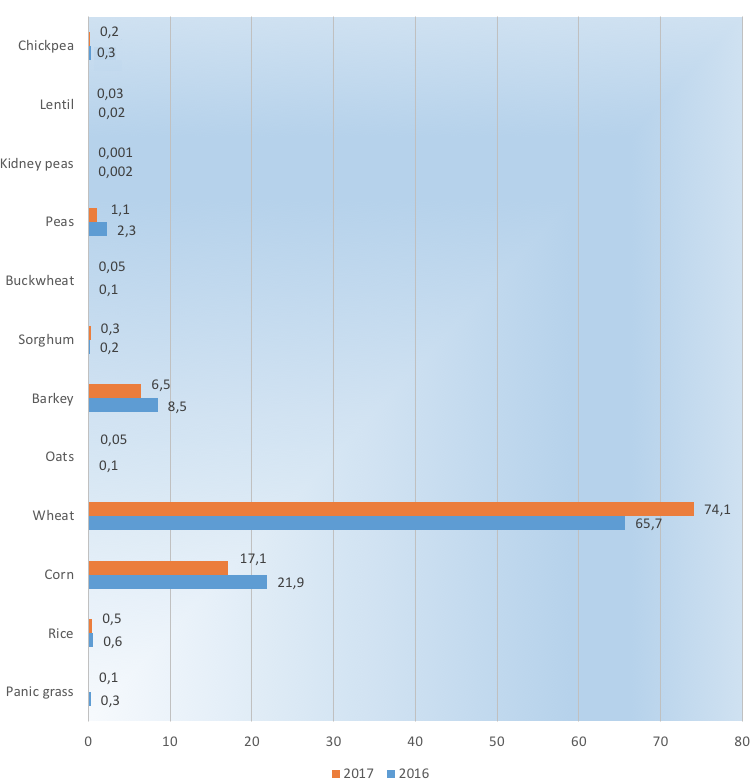
In January-April 2017 as compared to the same period of 2016, the structure of export by types of cereals export improved. Fig. 2 shows it. According to the analysis, in January-April 2017 the structure of cereals export from Russia by types was the following: wheat – 74.1%, 6.5% - barley, 17.1% - corn, 1.1%, 0.0003% - rye, 0.05% - oats, 0.5% - rice, 0.05% - buckwheat, 0.1% - panic grass, 0.3% - sorghum, 0.001% - kidney beans, and 0.03% - lentil (AB Center informational and analytical database of agrofood markets, 2017).
Wheat is still a leader in TOP 10 products. Its export has been 24.5 mln.t. since the beginning of 2016/17; corn – 4.3 mln. t. and barley – 2.5 mln. t. (Quick information about the export of grain and grain products as on 01.05.2017). As for the main export markets of wheat, in January-April 2017 it is necessary to single out the following TOP 10 key countries:
- Egypt (2,780.7 thous. tons, 34.5% in the total volume of export),
- Turkey (611.6 thous. tons, 7.6%),
- Yemen (565.3 thous. tons, 7.0%),
- Sudan (441.1 thous. tons, 5.5%),
- Nigeria (355.0 thous. tons, 4.4%),
- Bangladesh (339.0 thous. tons, 4.2%),
- Azerbaijan (258.9 thous. tons, 3.2%),
- the UAE (228.4 thous. tons, 2.8%),
- Indonesia (210.0 thous. tons, 2.6%), and
- Libya (173.6 thous. tons, 2.2%).
In total, for the specified period Russia exported wheat to 56 countries of the world.
Figure 2
Structure of Grain Export from Russia by Types of Crops in 2016-2017, %
(AB Center informational and analytical database of agrofood markets, 2017)
Analyzing the whole situation related to export in 2016, it is necessary to note that it had been characterized by changes in the structure of main buyers of the Russian food. Turkey is still the first, first of all, due to the import of cereals, oil crops and products made as a result of processing them. As for the second position, it is occupied by China that became the largest importer of Russian food, according to the results of 2016. Egypt and Korea are also the largest importers.
Over the previous year China has imported Russian food for the amount of above USD 1.5 bln. and exceeded Turkey that topped the rating of importers of this kind of goods according to the results for 2015. China increased the import of Russian goods gradually. In 2013 it occupied position four in the list of the largest importers, five - in 2014, two - in 2015, and finally in 2016 it became a leader.
The growing popularity of Russian food in China is explained by the fact that Chinese people value it for their environmental friendliness, while in order to increase the yield, China itself uses much harmful chemicals. Besides, the ruble devaluation contributed to the growth of import. As a result, on the one hand, the prices for Russian goods became attractive, but on the other hand, Russian producers became more interested in entering foreign markets.
According to the Federal Customs Service, in 2016 fish, crostacei, molluscs and other invertebrates were exported to China most of all – above USD 1 bln. or two thirds of the total volume of supplies. Besides, soybeans and sunflower oil are popular, too. The import of these products is USD 121 mln. and USD 107 mln., respectively (Customs Statistics of the External Trade. Federal Customs Service, n. d.).
In 2017 the food export from the Russian Federation remained on the level of the previous year (about USD 18 bln.). According to the Federal Customs Service, in January-April export of food and agricultural raw materials was USD 4,428.8 mln., which was 19% higher than for the previous period of 2016. In particular, the export of wheat increased by 13.6%, and that of vodka - by 15.4%. According to the Russian Export Center, now TOP 5 importers of Russian food include China – 10.1%, Turkey – 9.2%, Egypt – 7.9%, the Republic of Korea – 7.8%, and Kazakhstan – 7.1% (Russian export center, n. d.).
Thus, the modern Russia is actively developing the export of agro-industrial products and opens new markets for agricultural raw materials, food and beverages.
Along with this, the analysis of the actual state of Russian agricultural export shows that the introduction of economic sanctions by the USA and countries of the European Union, as well as Australia, Canada and Norway against Russia in 2014 had a considerable impact on the foreign trade between these countries and the Russian Federation (Import substitution in the Russian agro-industrial complex. Monograph, 2015). In our opinion, the trade limitations introduced upon Russia affected the cost volumes of the national trade export. The considerable effect of these measures is substantiated by the fact that many countries that initiated sanctions had been important partners of the Russian Federation for a long time. Thus, in 2013 30% of these products were imported to the Russian Federation from the USA, the EU, Canada, Norway, and Australia. For some products – fish, milk, cheeses, vegetables, and pork – the share was even more – from 40% to 50%.
It is known that as a response to introducing the economic sanctions, the Government of the Russian Federation approved Order of the President No. 560 dated August 6, 2014 “On Taking Some Special Economic Measures to Ensure Safety of the Russian Federation” and adopted Order No. 788 dated August 7, 2014 about the 1 year’s ban for importing agricultural products, raw materials and food to Russia from such countries as Australia, Canada, Norway, the USA, and the EU. These and other statutory acts had a considerable impact on the Russian import and export dynamics (State program of developing agriculture and regulating markets of agricultural products, and raw materials for 2013-2020, n. d.; Order of the Russian Government “On “Development of milk and dairy production for 2015-2020” state target program”, n. d.; Order of the Russian Government No. 778; Order on taking some special economic measures to provide safety of the Russian Federation, n. d.; Order of the President No. 120 dated January 30, 2010; Order of the President of the Russian Federation No. 560 dated August 6, 2014). The list of forbidden products featured 43 items, including such important products as meat, cheese, milk, fish, etc. European cheeses, butter, yoghurts along with quality dairy raw materials have almost disappeared from the Russian market.
The comparison of data about import and export related to all food and agricultural raw materials and data about certain types of agricultural products, raw materials and food approved in the Order shows that the sanctions of the Russian Federation touch upon those goods that in the foreign food trade occupy about 53% in the total volume of import and about 23% in the total volume of export. Therefore, it will be hardly possible to compensate for the goods from the ban list at the expense of decreasing export from the country. These conclusions are proved by average indicators of the import and export value. While since 2011 to 2013 the import of all types of food and agricultural raw materials of the Russian Federation was USD 42.1 bln., export remained relatively low and was on average USD 15.4 bln. per year (News. Economy” informational resource. Import in the Russian Federation for 2017, n. d.).
To our mind, the introduction of embargo has been a rather risky decision because it is necessary to remember that international sanctions of Western countries in relation to Russia have not so much foreign policy nature, as have a rather considerable economic impact on the development of Russian foreign economic relations. In its turn, it has a direct impact on the domestic agricultural production, consumption of agricultural products, dynamics of prices, as well as the whole technological chain as a whole, taking into account export and import operations, in particular, on the volumes of the domestic trade export and the structure of purchases itself.
According to the data of the Analytical Center under the Government of the Russian Federation, in 2013 the countries that were sanctioned by Russia in 2014 had imported such products to Russia for the amount of USD 9.06 bln. (Results of the year, n. d.). In 2013 other countries that were added at the second stage of embargo had imported food for the amount of USD 170.8 mln., and Ukraine which supplies were banned in 2016 had imported food products for the amount of USD 727.5 mln. As a result, as compared to the pre-sanctioned 2013, the share of supplies of food and agricultural raw materials (FEACN EEU 01-24 group) decreased by 42.3%. According to the Federal Customs Service of Russia, in numerical terms they decreased from USD 42.2 bln. down to USD 24.9 bln.
Thus, comparing the average monthly indicators of export and import, for January-July 2014 it was possible to note a considerable decrease in the goods exchange with the EU countries - on average more than by USD 1.2 bln. per month (Alehina, Baklakova and Panasenko, et al. 2016). Nevertheless, during the pre-sanction period about 42% of import and 52.9% of export of food and agricultural raw materials to the Russian Federation fell within the European Union countries, the economy of which was closely related to the Russian economy, as well as countries that suffered from the embargo in response.
Within this research we find it important to estimate how in terms of marketing the agricultural export and import have changed due to the introduction of economic sanctions and embargo in response (Golubkov 2014). At the same time it is necessary to take into account that in the goods structure of foreign trade the share of food and agricultural raw materials was about 13.5% of import and 3% of export.
In 2014 export of two or three largest goods groups increased (in monetary terms). Export of cereals (NBVED-10) grew considerably – by 46.7%, 1.6 times by actual measurement. The largest supplies were related to wheat (21.7 mln. tons or 1.6 times growth as compared to 2013), barley (4.0 mln. tons or 1.7 times), and corn (3.5 mln. tons or 1.3 times) (Weekly informational and analytical review, 2016).
The growth of export is explained by good yield and high external demand rather than by the price decrease as a consequence of the currency rate. Thus, the average price for Russian wheat (USD 245/t) that prevails in cereals export exceeded the average level of regional prices (for example, Kazakhstan – USD 244 per 1 ton, Ukraine – USD 217 per 1 ton). Export of the food industry wastes increased by 15.6%. Export of fish and fish products remained on the same level.
Since the introduction of sanctions, the import of agricultural raw materials has decreased, which is proved by the data for 2014 as compared to the volumes of 2013 (Food embargo of the Russian Federation and its impact on markets of meat and meat products importers, producers and consumers in Russia, 2015) (Table 1).
Table 1
Dynamics of Food Import to the Russian Federation by Main Goods Types, thous. t.
(Food embargo of the Russian Federation and its impact on markets of meat
and meat products importers, producers and consumers in Russia, 2015)
Code |
Product |
2012 |
2013 |
2014 |
2014/2013,% |
02 |
Meat and meat by-products субпродукты |
2,535.2 |
2,302.8 |
1,650.3 |
71.7 |
03 |
Fish and crostacei |
832.7 |
884.3 |
748.3 |
84.6 |
04 |
Dairy products |
|
|
|
|
|
Cheeses, butter |
581.9 |
652.3 |
546.8 |
83.8 |
|
Milk, cream, yoghurt and whey |
518.1 |
711.2 |
654.8 |
92.1 |
07 |
Vegetables |
2,724.0 |
2,980.1 |
3,342.5 |
112.2 |
08 |
Fruits |
6,158.4 |
6,352.2 |
5,589.9 |
88.0 |
09 |
Coffee, tea, spices |
332.6 |
347.8 |
351.9 |
101.2 |
12 |
Oil seeds |
867.3 |
1,332.2 |
2,225.5 |
167.1 |
15 |
Fats and oils |
968.2 |
1,069.2 |
1,023.8 |
95.8 |
18 |
Cacao |
354.2 |
358.0 |
301.8 |
84.3 |
19 |
Ready products made of cereal grains из зерна злаков |
366.9 |
425.9 |
465.3 |
109.2 |
20 |
Products made of fruits and vegetables |
1262.5 |
1,307.3 |
1,320.1 |
101.0 |
22 |
Alcoholic and soft drinks |
1,737.1 |
1,817.3 |
1,674.9 |
92.2 |
23 |
Food-industry wastes wastesпромышленности, |
1,149.7 |
1,266.8 |
1,130.4 |
89.2 |
24 |
Tobacco and its substitutes |
261.9 |
254.3 |
221.8 |
87.2 |
The analysis we made within this research proves that meat and dairy areas of the Russian agrarian sector happened to be the most vulnerable.
Thus, the volumes of food import in the “Meat and meat by-products” goods group decreased most of all. This decrease was 28.3% of the 2013 volumes. This is explained mainly by the reduction of pork supplies by 40% as compared to the 2013 volumes. In absolute terms the pork import (code 0203 FEACN) decreased by 248.7 thous. tons, and pork and poultry fat (code 0209 FEACN) – by 220.5 thous. tons. Supplies of pork (code 0203) from EU countries, above all from Denmark (by 83.5 thous. tons) and Germany (79.0 thous. tons), decreased most of all. They were substituted by import from Brazil. At the same time in 2014 the price of Brazilian pork (without taking duties into account) was USD 4,306 per 1 ton, which was higher than prices of Germany (USD 3,784 per ton) and Denmark (USD 3,812 per 1 ton) (Food embargo of the Russian Federation and its impact on markets of meat and meat products importers, producers and consumers in Russia, 2015).
There were also rather serious problems in the dairy area of the domestic food market. It depends much more on import supplies (Murtuzalieva, Seifullaeva and Shirochenskaya 2016; Panasenko 2016; Seifullaeva 2016; Seifullaeva 2011; Seifullaeva and Belenikina 2016; Surovtsev, Nikulina and Payurova 2015). Thus, specialists of the Milknews Analytical Center note that the Russians’ consumption of milk and dairy products has been decreasing during the last several years (Development of the dairy industry in 2015). Last time (statistically) the consumption of the recommended standard had been provided in 1991 when the actual volumes of consumptions were 347 kg/person/year. Then the volume of consumption decreased and had achieved its minimum by 1999 (214 kg/person/year). After that it was possible to observe the gradual growth up to 2012 (249 kg/person/year). Due to the economic crisis and decrease in the purchasing power, it decreased a little (down to 248 kg/person/year) in 2013 and continued decreasing in 2014 (down to 244 kg/person/year – 74% of the recommended standard).
For example, while in 2013 an ordinary consumer could buy 630.5 liters of drinking milk per month and 93.6 kg of butter, in 2014 he could buy only 570.0 (-10%) and 82.1 kg (-12%), respectively (News. Economy” informational resource. Import in the Russian Federation for 2017, n. d.). According to the Federal Service of State Statistics (Rosstat), during the post-sanction period the consumption of milk and dairy products continued decreasing – by 1.6% per year. At the present time on average in the Russian Federation, the volume of milk consumption per head is 244 kg/year, which is 36% lower than the standard (300-330 kg per year) recommended by the Ministry of Public Health (Order of the Ministry of Social Development of the Russian Federation No. 592n dated 02.08.2010) (Customs Statistics of the External Trade. Federal Customs Service, n. d.).
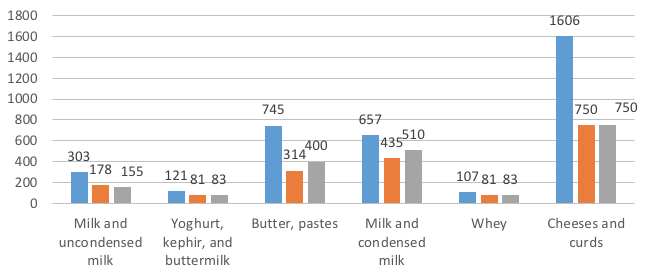
If to compare the current volumes of import with the ones of 2014, the difference is vivid. Thus, according to the Federal Customs Service, today Russia imports milk and cream for the amount of USD 155.3 mln. This is one half as much as in 2014. Milk and concentrated (or condensed) milk and dry milk are imported for the amount of USD 510.4 mln., which is 23% less, butter and dairy pastes – for the amount of USD 400.1 mln., which is 47% less. The highest fall is related to import of cheeses. While in 2014 we purchased products for the amount of USD 1.606.6 mln., in 2016 – only for the amount of USD 750.7 mln. Besides, the import of fresh and frozen meat decreased by 2.2%, raw sugar – 36.3 times, white sugar – by 19.4%. As a whole, in January-March 2017 food and agricultural raw materials for the amount of USD 6,495.0 mln. were imported to Russia. This is by 16.3% more than in January-March 2016 (USD 5,585.2 mln.). However, in the goods structure of all import to the Russian Federation, in January-March 2017 the share of food and agricultural raw materials decreased by 1.2% as compared to the same period in 2016, and was 14.4% (Customs Statistics of the External Trade, n. d.; Tendencies of the general and non-resource export in Russia in the I quarter 2017).
Fig. 3 shows the dynamics of milk and dairy products import for the period of 2014-2016
Figure 3
Dynamics of Milk and Dairy Products Import to Russia in 2014-2016,
mln. USD (Byrkova, n. d.)
The geography of purchases has also changed. There are fewer suppliers of many types of products. The leader among sellers is still Belarus. Its share in the import has increased much for two years: from 39.2% up to 84.5% for cheeses and curds, from 39.6% up to 75% for butter, and from 59.9% up to 96.6% for whey, yoghurt and kephir (trade position 0403 FEACN EEU). Actually, it is possible to call Belarus a monopolist of dairy products’ supplies to Russia. Its total share in the dairy products has reached 81% (Seifullaeva 2011).
However, Belarus is not the only country that successfully earns on the Russian food embargo. Today among importers there are more and more new suppliers from the farthest parts of the world.
Thus, Uruguay is actively conquering the Russian market. Another Latin American producer – Argentina – follows it. In 2016 it was the second after Belarus to export dry milk and cheeses to Russia. Now Argentina is one of the main suppliers of semi-hard and fresh cheeses, Cheddar, Edam, as well as the only supplier of blue cheeses after Finland, the Netherlands and France have left the market.
New Zealand also started conquering Russian suppliers. Its share on our dairy market has increased from 2% up to 5%. Earlier it supplied dry milk to us. However, now it started selling butter to Russia, too. Today it is the second after Belarus to supply it, and has a share of 3%. Producers from New Zealand import health oil for food that contains not more than 85% of fat, as well as milk fat used for industrial purposes to Russia (Market of Russian dairy products” informational bulletin, 2018).
After introducing the embargo, Russia has got more exotic suppliers of dairy products. For example, Chile, Morocco, Tunis, and Macedonia import cheeses of various sorts – Gruyere, Edam, and even blue cheeses – to Russia. Costa-Rica imports dry milk, and Nigeria supplies unpasteurized milk.
Table 2 shows the main suppliers of dairy products to Russia.
Table 2
Basic Countries Supplying Milk and Dairy Products in Russia in
2014/2016 (Market of Russian dairy products” informational bulletin, 2018)
Ser. No. |
Product |
2014 |
2016 |
Countries, % |
Countries, % |
||
1 |
Milk and non-condensed sugar free cream |
- Belarus, 73.1% - Kazakhstan, 8.5 % - Finland, 5.5 % - Poland, 2.5 % - Latvia, 2.5 %
|
- Belarus, 95.3 % - Kazakhstan, 4.3 % - Uruguay, 0.1 % - Serbia, 0.05 % - Azerbaijan, 0.01 %
|
2 |
Milk and condensed sugared cream including dry |
- Belarus, 84.8 % - Argentina, 3.9 % - Uruguay, 2.0 % - France, 1.3 % - Latvia, 1.0 %
|
- Belarus, 81.1 % - Argentina, 7.4 % - Turkey, 3.1 % - New Zealand, 2.1% - Uruguay,1.9 % |
3 |
Buttermilk, yoghurt, kephir |
- Belarus, 59.9 % - Finland, 15.8 % - Estonia, 5.5 % - Lithuania, 3.3 % - France, 4.3 % |
- Belarus, 96.6 % - Kazakhstan, 2.5 % - Uruguay, 0.3 % - Serbia, 0.3 % - Switzerland, 0.3 % |
4 |
Whey |
- Belarus, 66.7 % - France, 13.5 % - Argentina, 4.4 % - Ukraine, 4.7 % - Finland, 2.9 % |
- Belarus, 83.3 % - Argentina, 9.3 % - New Zealand, 3.5 % - Switzerland, 0.8 % - Uruguay, 0.5 % |
5 |
Butter, pastes |
- Belarus, 39.6 % - New Zealand, 11.9 % - Uruguay, 11.5 % - Australia, 8.9 % - Finland, 7.9 % |
- Belarus, 75.0 % - New Zealand, 13.3 % - Uruguay, 6.4 % - Kirgizia, 1.2 % - Moldova, 1.1 % |
6 |
Cheeses and curds |
- Belarus, 39.2 % - Netherlands, 7.8 % - Finland, 6.9 % - Argentina, 5.9 % - Denmark, 5.0 % |
- Belarus, 84.5 % - Argentina, 4.9 % - Serbia, 3.5 % - Uruguay, 2.1 % - Georgia, 1.3 % |
In spite of the fact that Russian companies managed to find new suppliers, the structure of purchases themselves raised certain fears. In 2016 Russia imported dry milk for the amount of USD 446.3 mln., and unpasteurized milk for the amount of USD 155.3 mln. (Market of Russian dairy products” informational bulletin, 2018). This is almost three times more, while in 2014 the difference was only 1.8 times. Now the share of such products is yearly more and more equal to the growth of supplies of palm oils and all possible substitutes.
As a whole, volumes of import of those goods that have been included in the sanction list are still low. If to compare the period for January-May 2014 that preceded the ban, and January-May 2016, import has decreased by 42% - from USD 9.5 bln. down to 5.6 bln. It will take much time to achieve the previous volumes of supplies – from three to five years if the ruble rate is not devaluated and the economy does not undergo serious shocks (Food embargo of the Russian Federation and its impact on markets of meat and meat products importers, producers and consumers in Russia, 2015).
Another rather serious problem that arose since introducing sanctions and adopting the embargo in response by the Russian Government is the stable tendency to the increase in prices for food on the domestic market. Such tendency is characteristic of all types of agricultural goods. And although their quantity in Russia increases, the index of consumer prices for them has increased as compared to the pre-sanction indicators approximately by 10-15% (Consumer prices index, n. d.).
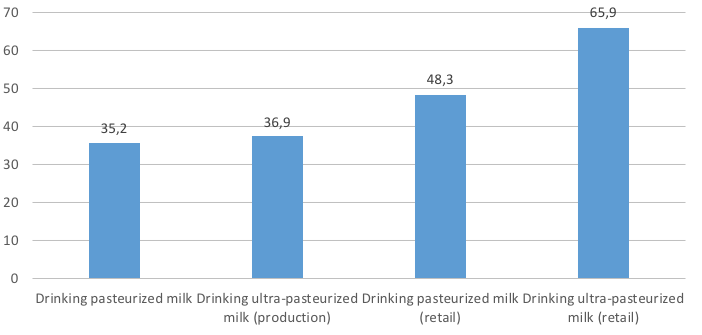
This tendency had the greatest impact on the dairy products market. Thus, since August 2013 till August 2015 the growth of prices for unpasteurized milk was 28.5%. For the same period industrial producers’ prices for full pasteurized milk grew by 31.5%, and retail prices for full pasteurized milk that contained 2.5-3.2% of fat grew by 31.4%. Figure 4 shows the dynamics of prices.
Figure 4
Average Prices for Drinking Milk (Production) and Full Drinking Milk with
Fat Content of 2.5-3.2% (Retail) in July 2016, RUB. (Results of the year, n. d.).
Along with this, producers’ prices for hard cheeses grew by 32.8%, cheese products – by 49.5%, retail prices for cheeses – on average by 38.8%. This was the same for butter. From August 2013 till August 2015 retail prices for butter grew on average by 38.9%, while producers’ prices grew by 30.3%. As a whole, in 2015 dairy products became more expensive by 13.7% (Results of the year, n. d.).
We explain such considerable growth of prices in the processing and retail segments by the delayed effect from increasing prices for unpasteurized milk in 2013-2014. It was caused by the agricultural producers’ attempt to ensure the level of profitability (that has not been achieved) required for modernizing the production in the context of the continuous deficit of unpasteurized milk and expanding the volumes of dairy import.
However, we think that the tempos of the growth of prices for dairy products and dairy raw materials will gradually fall because of the decreases in the demand for dairy products and a high price competition with Belorussian exporters of dairy products to Russia.
Since unpasteurized milk defines retail prices for all dairy products (in the structure of the price for drinking milk, the share of unpasteurized milk is 40%, and in the structure of the price for curds –36% on average, and in the structure of the price for cream – above 50%), the increase tendency is also observed on the curds and cheese products market.
Figure 5
Average Prices for Butter and Margarines in July 2016, RUB
(Materials of the II International Conference “Agricultural Industry, n. d.)
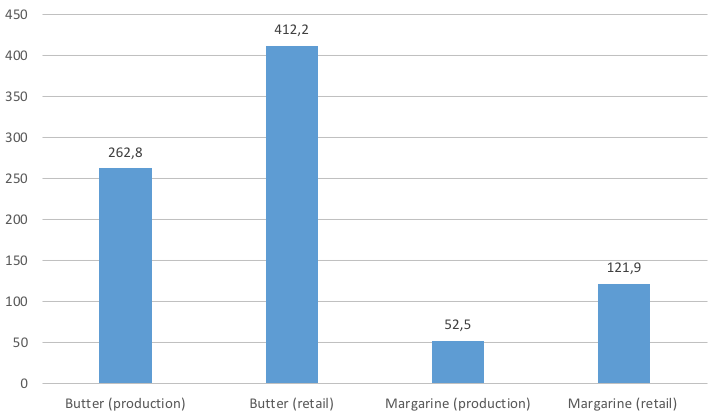
In July the industry producers’ average price for hard cheeses continued the ascending trend and added 2.1% (up to RUB 320.5 per 1 kg). For the year the price has increased by 8.3%. At the same time, the wholesale prices for cheese products have increased on average by 4.0%, up to RUB 87.8 per 1 kg. As for the retail segment, for a month prices for hard and soft cheeses have decreased a little (-0.2%, down to RUB 430.3 per 1 kg). At the same time, the average price is still higher by 6.8% than the previous year price (News of the agro-industrial complex: Russia and the world. Results, forecast and events” FSBU “Specialized Center of Accounting in the Agro-Industrial Complex” informational review, n. d.).
The prices for butter and margarines are also observed to have grown. (Fig. 5). The growth of wholesale prices for butter caused the increase in prices in the retail segment: in June 2016 in Russia prices for butter increased by 0.6%, up to RUB 412.2 per 1 kg (+6.9 % per year). In July 2016 prices for margarines also increased by 2.1% (up to RUB 52.5 per 1 kg) with producers, and by 0.5% (up to RUB 121.9 per 1 kg) with retailers.
Thus, it is necessary to conclude that the introduction of sanctions in 2014 had negative impact on price formation in the industry and caused the decrease in purchase prices for milk, prices of milk producers and wholesalers. Besides, the production expenses grew at all stages of milk production and processing due to the national currency devaluation. Nevertheless, the growth of producers’ prices had direct impact on the growth of consumer prices. Since the tendency on the increase in prices in the retail sector will continue, to our mind, this will affect the reaction of consumers and their consumer behavior that causes the decrease in the milk consumption (Materials of the II International Conference “Agricultural Industry, n. d.; Seifullaeva, Shirochenskaya, Shklyar, Mkhytaryan and Panasenko 2017).
The population’s purchasing power has also decreased, and along with it the priorities, needs and the whole model of the consumer behavior as a whole have also changed (Sidorchuk and Grineva 2014; Sidorchuk 2015). Many people had to replace habitual expensive and high quality products by more affordable and cheap goods. The consumption of such more expensive types of dairy products as creams, yoghurt, boiled fermented milk and various cheeses decreases.
Besides, prices on the domestic market grow not only because of deficit but also due to “artificial” weakening of competition by limiting the number of countries exporting goods to Russia. Introducing the import ban for certain countries, the Government of the Russian Federation has “artificially” reduced the number of the import market participants, and thereby weakened the competition among them. As a rule, the decrease in the competition comes with changes of the structure of the Russian import market. In this context, we do not exclude that on the markets of goods included in the list of goods banned for import oligopolistic and even monopolistic structures may occur. Oligopolistic structures on the goods import market can certainly cause a growth of prices for goods on the part of countries or a country that are not banned and will have an “exclusive” right for importing goods that are found in the list of the Russian Government. Thus, on the Russian import market there can be a situation that will contravene the anti-monopoly legislation of the Russian Federation.
It is necessary to note another negative trend: on the national market the share of incorrectly marked dairy products has increased. Thus, the share of products containing milk and sold to consumers as dairy products has increased up to 9%. It means that about 10% of the dairy products made in the country is adulterated (the milk fat is substituted by plant-based fats). According to the preliminary results of 8 months of 2016, the volumes of the palm oil import remained by 7% higher than the ones for the previous year. For June-August 2016, 568.5 thous. t. of palm oil worth $400.0 mln. (in 2015 it was 529.4 thous. t.) were imported to Russia (Results of the year, n. d.).
Resuming the above, we want to make the conclusion that the impact of economic sanctions and the Russian embargo for the Russian agriculture must be generally considered as rather controversial. However, we estimate the aggregate impact of sanctions and anti-sanctions as negative because they greatly affected the country’s agriculture and not only caused the change of import and export flows, but also affected the change of market structures both on the import and export market of the country. At the same time the sanctions caused special changes on the import markets of certain types of agricultural products, raw materials and food that changed the style of consumers’ behavior (transfer to the saving model of consumption) (Seifullaeva, Shirochenskaya and Shklyar 2017). In addition, the number of the market factors is decreasing, which in its turn weakens the competition, and, as a consequence, causes the growth of consumer prices on the domestic market. National products merely cannot successfully compete with foreign ones because they are expensive, which is caused by high expenses for production.
Moreover, the food embargo provided the Russian agrarians with great new opportunities. Many segments got the market niches, or, at least, these niches became poorer. The existing situation allowed Russian producers to, in particular, considerably increase the volumes of internal dairy production (cheeses, butter). Also, although the resourceful base for this (raw milk) is still a deficit (which is explained by the objective impossibility to quickly increase it due to rather long-term production and investment cycles in the dairy cattle breeding), it provides Russian producers and processing enterprises with the opportunity to successfully occupy the emerging niche, and a unique chance to take the rightful place on the global market and to improve their efficiency.
Thus, we state that the sustainable growth of the sale of Russian agro-industrial complex products on foreign markets, obvious reserves and possibility of the growth of agricultural production, raw materials and food as a whole become important factors of the increase in the export of agro-industrial complex products up to USD 40-50 bln. during 5-7 years.
Alehina E.S., Baklakova V.V. and Panasenko S.V. et al. (2016). Ekonomicheskie issledovaniya: analiz sostoyaniya i perspektivy razvitiya (ekonomika regionov) [Economic researches: analysis of the development state and perspectives (economy of regions)]. Voronezh: Voronezh State Pedagogical University
Byrkova E. (n. d.). Otkuda na samom dele syr i moloko v rossiyskih magazinah? [Where do Russian shops take cheese and milk from?]. PROVED Informational portal, 19.04.2017. [Electronic resource]. Date View November 1, 2017 http://proved.rf/economics/fea/41787-otkuda-na-samom-dele-syp-i-moloko-v-possiyskih-magazinah.html
Ezhenedelny informatsionno-analiticheskiy obzor (29.01.2016) [Weekly informational and analytical review (29.01.2016)]. Ministry of Agriculture of the Russian Federation [Electronic resource]. Date View November 1, 2017 http://www.don-agro.ru/index.php?id=1435
Golubkov E.P. (2014). Marketing dlya professionalov: prakticheskiy kurs [Marketing for professionals: practical course]. Moscow: U-Right Publishing House, pp. 474.
Gosudarstvennaya programma razvitiya selskogo hozyaystva i regulirovaniya rynkov selskohozyaystvennoy produktsii, syrya i prodovolstviya na 2013-2020 gody [State program of developing agriculture and regulating markets of agricultural products, and raw materials for 2013-2020]. Date View November 1, 2017 http://government.ru/programs/208/events.
Importozameschenie v APK Rossii: problemy i perspektivy. Monografiya [Import substitution in the Russian agro-industrial complex. Monograph]. (2015). Moscow: FGBNU “All-Russian Research Institute of Economy and Agriculture” (FGBNU VNIIESH).
Indeks potrebitelskih tsen (IPTs) [Consumer prices index]. Federal Service of State Statistics. 2017. [Electronic resource]. Date View November 1, 2017 http://www.gks.ru/wps/wcm/connect/rosstat_main/rosstat/ru/rates/79a3cc004a41fc37bdd8bf78e6889fb6
Informatsionniy bulleten “Rynok molochnoy produktsii RF” 2016 g. [“Market of Russian dairy products” informational bulletin]. (2016). Date View November 1, 2017 http://yaragro.info/25.11.2016 Market of Dairy Products of the Russian Federation.html
Informatsionniy obzor: “Novosti APK: Rossiya i mir. Itogi, prognozy, sobytiya” FGBU “Spetsializirovanniy tsentr ucheta v APK” [“News of the agro-industrial complex: Russia and the world. Results, forecast and events” FSBU “Specialized Center of Accounting in the Agro-Industrial Complex” informational review] [Electronic resource]. Date View November 1, 2017 http://pandia.ru/text/77/146/347.php
Informatsionniy resurs “Vesti. Ekonomika”. Import v RF za 2017 g. [“News. Economy” informational resource. Import in the Russian Federation for 2017] [Electronic resource]. Date View November 1, 2017 http://www.vestifinance.ru/articles/83983
Informatsionno-analiticheskaya baza dannyh agroprodovolstvennyh rynkov “AB-Tsentr” [AB Center informational and analytical database of agrofood markets] (2017).Date View November 1, 2017 http://ab-centre.ru/news/eksport-zerna-iz-rossii-v-2017-godu
Itogi goda. Razvitie molochnoy otrasli v 2015 g.” Novosti i analitika molochnogo rynka Milknews [Results of the year. Development of the dairy sector in 2015. Milknews. News and analytics of the dairy market] [Electronic resource]. Date View November 1, 2017 http://milknews.ru/analitika-rinka-moloka/molochnaya_otrasl.html#ya1
Materialy II mezhdunarodnoy konferentsii: “Agropromyshlennost: itogi 2016 goda perspektivy franko-rossiyskogo sotrudnichestva”. Tema: “Investitsionnaya privlekatelnost molochnoy otrasli” [Materials of the II international conference “Agricultural industry: results of 2016, perspectives of the French and Russian cooperation”] [Electronic resource]. Date View November 1, 2017 http://www.ccifr.ru/public/BELOV_SOUZMOLOKO.pdf
Murtuzalieva T.V., Seifullaeva M. E. and Shirochenskaya I.P. (2016). Prodovolstvennye sanktsii i voprosy importozamescheniya produktov pitaniya v Rossii (na primere molochnoy promyshlennosti) [Food sanctions and issues of food import substitution in Russia (through the examples of the dairy industry)]. Marketing in Russia and Abroad, 3
Operativnaya informatsiya ob eksporte zerna i produktov ego pererabotki po sostoyaniyu na 01.05.2017 g. s uchetom stran Tamozhennogo soyuza (predvaritelno) [Quick information about the export of grain and grain products as on 01.05.2017 taking into account countries of the Customs Union (preliminarily)]. Date View November 1, 2017 http://www.fczerna.ru/News.aspx?id=7330
Panasenko S.V. (2016). Problemy i perspektivy razvitiya regionalnogo agromarketinga [Problems and perspectives of developing regional agro-marketing]. Collection of articles according to the materials of the international research and practice correspondence conference “Actual aspects of developing the innovation mezo-economy”. Khabarovsk, pp. 104-109.
Postanovlenie Pravitelstva RF “O Gosudarstvennoy tselevoy podprogramme “Razvitie proizvodstva moloka i molochnoy produktsii na 2015 - 2020 gody” [Order of the Russian Government “On “Development of milk and dairy production for 2015-2020” state target program”]. Date View November 1, 2017 http://www.garant.ru/products/ipo/prime/doc/70727272/
Postanovlenie Pravitelstva RF ot 07.08.2014 No. 778 “O merah po realizatsii ukazov Prezidenta Rossiyskoy Federatsii ot 6 avgusta 2014 g. No. 560, ot 24 iyunya 2015 g. No. 320, ot 29 iyunya 2016 g. No. 305 i ot 30 iyunya 2017 g. N 293” [Order of the Russian Government No. 778 dated 07.08.2914 “On measures to fulfil orders of the President of the Russian Federation No. 560 dated August 6, 2014, No. 320 dated June 24, 2015, No. 305 dated June 29, 2016, and No. 293 dated June 30, 2017”]. GARANT System. Date View November 1, 2017 http://base.garant.ru/70712500/#ixzz4tRQYbokG .
Prodovolstvennoe embargo RF i ego vliyanie na rynkah importerov, proizvoditeley i potrebiteley myasa i myasoproduktov v Rossii [Food embargo of the Russian Federation and its impact on markets of meat and meat products importers, producers and consumers in Russia]. AIC- inform. (2015). Date View November 1, 2017 http://www.apk-inform.com/ru/exclusive/topic/1050235#.WbDvDqPkX-Y (inquiry date: 24.07.2017).
Razvitie molochnoy otrasli v 2015 g. Novosti i analitika molochnogo rynka Milknews [Development of the dairy industry in 2015. Milknews. News and analytics of the dairy market]. Date View November 1, 2017 http://milknews.ru/analitika-rinka-moloka/molochnaya_otrasl.html#ya1
Rosselhoznadzor. Ob eksporte zerna i produktov ego pererabotki za 2016-2017 gody [Federal Service for veterinary and Phytosanitary Surveillance. On export of grain and grain products for 2016-2017]. Date View November 1, 2017 http://www.fsvps.ru/fsvps/news/22020.html
Rossiyskiy eksportny tsentr. Razvitie rossiyskogo eksporta [Russian export center. Development of Russian export]. Date View November 1, 2017 https://www.exportcenter.ru/international_markets/russian_exports/
Seifullaeva M.E. (2011). Mezhdunarodniy menedzhment [International management]. Moscow: Knorus
Seifullaeva M.E. (2016). Marketingovye strategii sovremennyh TNK [Marketing strategies of modern transnational companies]. Monograph. Moscow: Research Consultant.
Seifullaeva M.E. and Belenikina M.G. (2016). Rynok molochnoy promyshlennosti Rossii: sostoyanie i perspektivy [Market of dairy industry in Russia: state and perspectives]. Marketing in Russia and Abroad, 6.
Seifullaeva M.E., Shirochenskaya I.P. and Shklyar T.L. (2017). Strategiya formirovaniya konkurentnyh preimuschestv produktsii rossiyskoy molochnoy produktsii [Strategy of forming competitive advantage of Russian dairy production]. Journal of International Scientific Researches, 1, 9
Seifullaeva М. E., Shirochenskaya I. P., Shklyar T. L., Mkhytaryan S. V. and Panasenko S.V. (2017). Strategy of import substitution at Russian food market: implementation problems and prospects. International Journal of Economic Perspective, 90
Sidorchuk, R. and Grineva O., (2014). Research for the marketing state in Russian museums. Review of European Studies, 6(4), 283
Sidorchuk, R., (2015). The concept of “value” in the theory of marketing. Asian Social Science, 11(9), 320
Surovtsev V.N., Nikulina Yu.N. and Payurova E.N. (2015). Sanktsii i devalvatsiya - ekonomicheskiy analiz posledstviy dlya molochnoy otrasli [Sanctions and devaluation – economic analysis of consequences for the dairy industry]. Dairy Industry, 4, 4-10.
Tamozhennaya statistika vneshney torgovli. Federalnaya tamozhennaya sluzhba [Customs Statistics of the External Trade. Federal Customs Service]. Date View November 1, 2017 http://www.customs.ru/index2.php?option=com_content&view=article&id=25198&Itemid=1981
Tendentsii obschego i nesyrevogo eksporta Rossii v 1 kvartale 2017 g. “Rossiyskiy eksportny tsentr” 2017 g. [Tendencies of the general and non-resource export in Russia in the I quarter 2017 “Russian Export Center”, 2017]. Date View November 1, 2017 https://www.exportcenter.ru/upload/iblock/874/Eksport Rossii 2017_03 (otchet).pdf
Ukaz o primenenii otdelnyh spetsialnyh ekonomicheskih mer v tselyah obespecheniya bezopasnosti Rossiyskoy Federatsii [Order on taking some special economic measures to provide safety of the Russian Federation]. Date View November 1, 2017 http://kremlin.ru/events/president/news/46404
Ukaz Prezidenta ot 30 yanvarya 2010 g. No. 120 “Ob utverzhdenii Doktriny prodovolstvennoy bezopasnosti Rossiyskoy Federatsii” [Order of the President No. 120 dated January 30, 2010 “On approving the Food Safety Doctrine of the Russian Federation”]. Date View November 1, 2017 http://www.garant.ru/hotlaw/federal/228793/
Ukaz Prezidenta Rossiyskoy Federatsii ot 6 avgusta 2014 g. No. 560 “O primenenii otdelnyh spetsialnyh ekonomicheskih mer v tselyah obespecheniya bezopasnosti Rossiyskoy Federatsii” [Order of the President of the Russian Federation No. 560 dated August 6, 2014 “On taking some special economic measures to provide safety of the Russian Federation”]. Date View November 1, 2017 http://base.garant.ru/70711352/
1. Plekhanov Russian University of Economics, 117997, Russia, Moscow, Stremyanny Ln., 36. E-mail: maisa2000@mail.ru
2. Plekhanov Russian University of Economics, 117997, Russia, Moscow, Stremyanny Ln., 36
3. Plekhanov Russian University of Economics, 117997, Russia, Moscow, Stremyanny Ln., 36
4. Plekhanov Russian University of Economics, 117997, Russia, Moscow, Stremyanny Ln., 36
5. Plekhanov Russian University of Economics, 117997, Russia, Moscow, Stremyanny Ln., 36