![]() ISSN 0798 1015
ISSN 0798 1015

![]() ISSN 0798 1015
ISSN 0798 1015
 Vol. 39 (Number 12) Year 2018. Page 3
Roman R. VEYNBERG 1; Alexander G. TIMOFEEV 2; Aleksey A. POPOV 3; Dina E. BORTSOVA 4
Received: 01/11/2017 • Approved: 20/11/2017
3. Indicators to be taken into account, measurement
ABSTRACT: In this paper, we discuss Data Driven Marketing (DDM) and its use in different segments of business. We suggest DDM as an effective tool in determination of a strategic part of business management from the point of data analysis. There will be affected not only the case for the use of data driven marketing, but the algorithm by which the implementation can be applied in almost all types of business. This article will be informative for marketers and CEO in applied IT field, banking, digital agencies. |
RESUMEN: En este documento, discutimos la herramienta Data Driven Marketing (DDM) y su uso en diferentes segmentos de negocios. Sugerimos DDM como una herramienta efectiva en la determinación de una parte estratégica de la gestión empresarial desde el punto de análisis de datos. No solo se verá afectado el uso del marketing basado en datos, sino también el algoritmo mediante el cual la implementación se puede aplicar en casi todos los tipos de negocios. Este artículo será informativo para los especialistas en marketing y CEO en campo aplicado de TI, banca y agencias digitales. Palabras clave: Marketing impulsado por datos, digital, Cultura de recopilación de datos, Análisis de datos, Análisis de RFM, Marketing, CLTV, ROA. |

Since web analytics has become necessary with the introduction of digital communications and even integrated online and offline marketing needs web analytics, marketers can now use the database analysis to gain individual understanding of the customers and to interact with the customer more efficiently.
Nevertheless, the question remains: how to make a successful transition to marketing management through database analysis? The complexity of the problem is not only due to the amount of data and a variety of data sources. Marketers should introduce a right tool to quickly analyze customer databases and other databases for new ideas, and then use this information in marketing strategy.
Traditional marketing implies a set of principles, concepts and methodological developments accumulated by the efforts of scientists, consultants, marketing practitioners in the 20th century with the following main features [1, p. 48].
New marketing is focused on increasing the value of business, a significant portion of which may include intangible assets, including consumer capital.
New marketing is often referred to adaptive marketing being a system of measures aimed at the search for needs and innovations, creation of demand for them and timely manufacturing and sale of products, meeting changing market conditions, technology and customer requirements, as well as development of an effective system to promote goods and services to the market. If slogan of traditional marketing is “Find a need and satisfy it”, a new look at marketing is expressed in the slogan “Develop a new product and create a need for it” [5]. In this connection, the main difference of adaptive marketing is the ability to adequately respond to changes in the external environment, including identification of the needs of consumers and its satisfaction through innovations.
However, adaptive marketing is not aimed at forecasting the needs of consumers and the corresponding preventive response by creating innovations that could satisfy the needs forecasted. As a result, there is a time gap from the moment when intuitive consumer need is detected to the appropriate response through creation of innovation and release of a new product as a result. Thus, we consider that there is a need to develop a marketing concept that would allow proactively responding to changes in the external environment and excluded a time lag from the moment when the need appears to the appropriate response to it through innovation.
Data-driven marketing is about far more than digital data. Examining email open rates or web analytics provides just slice of the overall customer experience. Combining the strong digital data foundation with other digital channel and offline data is essential to build the cross-channel information platform required to create the essential Single Customer View (SCV).
Properly structured product, price and promotion channel management processes must turn sellers in shipping department with the only task to issue invoices to the queue of your loyal customers. A period when every penny is counted is not a time for experiments. Entrepreneurs should improve the quality of marketing decisions. How to do it and do not make mistakes? To use work with data as the basis for all decisions there are four steps to help you doing it.
Figure 1
Algorithm Structure.
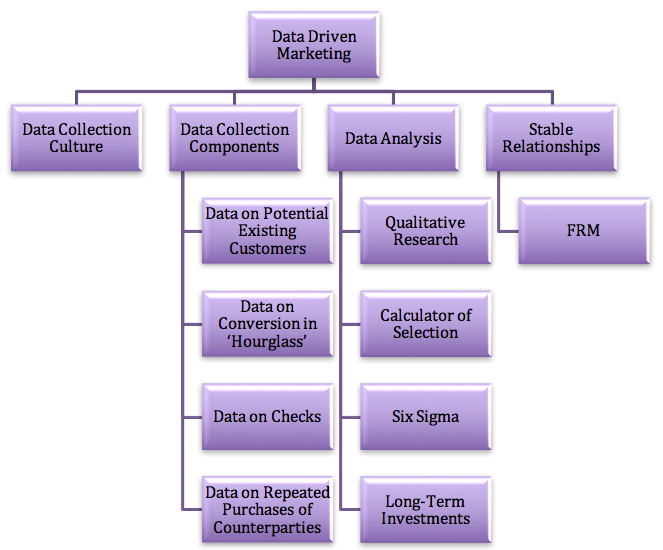
Companies around the world have paid attention to Data Driven Marketing, namely to the fact that marketing without data support is ineffective and strategically wrong process. However, there is no general algorithm; therefore portions of the strategy introduced to marketing departments do not bring the best results.
The algorithm which we propose to use will improve the effectiveness of marketing campaigns and business performance in general.
A key barrier to improving the quality of decision-making in marketing is the lack of unambiguous data collection and storage culture in the Russian companies. This is a problem of small, medium and large businesses. There are many companies that store information on about 18,000 product items and 2,000 retail outlets in Excel. From a strategic point of view it is absolutely wrong.
A correct tool to collect data is CRM system. A type of CRM system is not so crucial, but its presence and the use are important: it is important to record information about transactions in the electronic system. Comprehensive and timely completion of all fields in CRM should become alpha and omega of the company work.
Absolutely all modern CRMs allows making custom fields to enter data in them both manually and automatically from third-party applications or cash management equipment. Four large groups of data are required to make marketing decisions.
This could include information on gender, age, income level, education, geography of residence, source of the potential customer, CAC (cost to attract customers).
“Hourglass” is a famous model, which is increasingly used instead of traditional sales funnel. The customer passes not only through the stages of coverage, capture, heating and sale (classic tapering funnel), but also through the stages after-sales, loyalty and affiliation (the funnel expands at these stages again). To collect data on conversion, it is the easiest to use through analytics at Universal Analytics. It will allow to count ROMI (return on marketing investment), rather than abstract non-financial metrics.
This section includes not only data on the amounts of purchases, but also all data within a single transaction. For example, it is necessary to take into account what SKU are often sold together.
This requires a maximum number of users to have a unique identification number (for example, as a pair of login – password in e-commerce or in the form of a discount card in off-line retail). The most common mistake made by companies – distribution of loyalty cards to customers after some purchasing action with a condition (for example, we give the card only to those who bought for the sum of at least RUB 5,000). Such tactics, according to developers, should lead to growth in check amount because of the desire of a person to receive the card. But this is not the case: not the customer, but you need the card to identify him in the future. Therefore it is better to “cut” bonuses of the card into small pieces, but distribute it to the greatest possible number of customers.
When collecting these data, remember about two more important things. First, a set of data should be available to sort not only by customers, but also by transactions, SKU, brands, sellers and outlets. Second, when collecting additional data from the customers in questionnaire format – like service ratings or wishes – it is important to avoid AppStore things, i.e. the questions implying ordinal (“high”, “below average”, “available”) or nominal (“yes/no”) answers. The value of this kind of answers in terms of the data needed to make marketing decisions is minimal – we need numbers, not humanitarian-like answers. Therefore, for example, in the question of the customer’s level of income, offer a range of numbers (100,000 – 150,000 rubles per month).
Some companies collect data and are able to visualize them (sometimes by using third-party services like Qlik, Devexpress and the like), but absolutely do not learn to analyze them. The figures are collected, dynamic graphics are built based on them, sitting behind the desktop the director feels like a captain on the ship, but nothing happens. There are a few advices to help conduct a serious data analysis. I am a practitioner, so my advices may differ from sociological canon.
Textbooks on sociology equate qualitative and quantitative research with each other, but our practice of working with large retail and with micro businesses shows that it is necessary to use quantitative research as long as possible. And only when discovering any unexplained things in quantitative research (analysis of distributions), you can interpret them using qualitative methods (focus groups, expert surveys, etc.).
It is expensive and tedious to question customers, but it is very useful if you select the right amount of people. Some question its customers en masse, and some are limited to question two or three people. Do not forget that there are online calculators of selection (e.g., Socioline, Allcalc.ru, FDF Group).
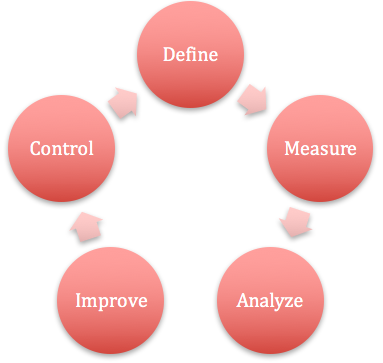
The main research method aimed at quick results in marketing, is to count Six Sigma – a method of quality management, which has gained international popularity. After spending two or three days to study it and to create infrastructure, you get a powerful tool.
DMAIC is a data-driven quality strategy used to improve processes. It is an integral part of a Six Sigma initiative. DMAIC is no a necessarily new method, but is needed to be used in Data Driven Marketing.
Figure 2
DMAIC process.
Begin using several types of analyzes in your work:
— Discriminant analysis determines probable value of the customer based on data about past purchases;
— Regression analysis assesses the extent of addiction such as the amount of purchases from the socio-demographic characteristics and helps to better understand your target audience;
— Correlation analysis will be useful for inventory management and efficiency of sellers;
— Frequency analysis based on a simple analysis of trends helps optimizing marginality, better manage cross-selling, and even predict the next purchases;
— Factor analysis reveals complex relationships between disparate data and shows what impacts on consumers’ decisions. It will be irreplaceable for determining and adjusting a unique selling proposition.
Good marketing is based on the approach of digitization of customer behavior. The most versatile of the widely used methods is RFM analysis (Recency / Frequency / Monetary) allowing to segment customers by loyalty.
Recency — the longer the customer did not commit repeated transactions, the lower the probability that he ever buys anything again.
Frequency — the less often the customer buys from us, the lower the probability that he will buy anything.
Monetary — the less than the average check of the customer, the higher the chance of losing him.
By using methods described in the second step, all these parameters can be studied and expressed by calculating the arithmetic mean. For example, in search for relationships, you can find that for one market segment R is 100 days (that is, you need to strive to repeated purchase within 100 days, otherwise the customer is lost), and for the other M is equal to approximately 40 dollars (you must strive precisely to this indicator to improve LTV).
For one of the large appliance stores, we found that the best way to bring customers back into the store is to offer them to buy a multicooker with discount within 46 days after the previous purchase.
The first step is to study Recency. To get started you should decide what will be the criterion for the customer activity. This may be a purchase, visit to a shop, or going to a link on the Internet at the company’s website. All depends on the goals of the company in conducting analysis and on the nature of activity.
Next, you should divide customers into five groups based on how long ago they used to take certain actions.
It is convenient to conduct such distribution by determining several time cycles (in this case – 5). For example, actions taken in the last month, 1 to 2 months ago, 2 to 3 months ago, 3 to 6 months, and from 6 months to a year.
A group collecting consumers, who have taken actions recently, is usually indicated by No. 5. No. 1 has a group of consumers who have not been active for the longest time.
The next step in the analysis is work with Frequency. The principle of division of customers into 5 groups is the same as in Recency. But instead of allocating time periods, determine how much activities will be a criterion of customer entering a particular group. For example, 20 or more purchases – group 5, 0-2 purchases – group 1. It should be understood that setting over- or underestimated thresholds of entering the groups can significantly affect accuracy of the results.
Further, following the procedure of RFM analysis, determine Monetary criterion. Everything here is the same as in the preceding paragraphs. Condition of customer entering a particular group is exceeding the specified level – the amount of money spent.
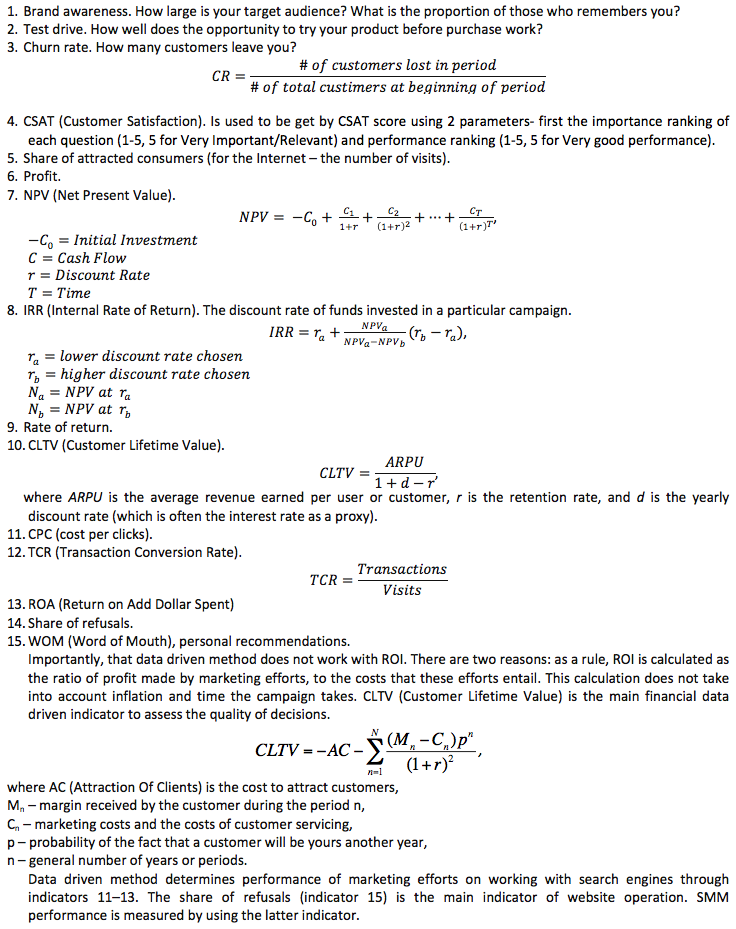
Figure 3
Analysis Procedure
Recency |
Frequency |
Monetary |
Purchase How long ago? Division into 5 groups |
Purchase How many? Division into 5 groups |
Purchase How much is spent? Division into 5 groups |
As a result, after analysis, you can generate as many as 125 groups from 111th to 555th (digits are combinations of group numbers by each indicator). But this does not mean that an individual approach should be applied to consumers in each group. In this case it will be most useful to distinguish various trends in customer behavior, identify the most important ones, key customers of the company and those who are close to become a loyal customer of the company.
Group 555, for example includes the most loyal customers, in which the company can be assured. But you should not think that they can be “forgotten” because they will stay anyway. You should show these customers that they are really needed to the company, and that the company is grateful to them (special conditions, loyalty program).
Group 111 includes the most unpromising consumers. However, it should be understood that at least once they used the company services. To try to bring them back or to understand the reason of low activity – are possible tasks for marketing specialists of the company.
Clients with Recency 5 are evaluating the company and will maybe apply to it again. You can easily attract them by post or Internet mailing, and encourage to make a purchase.
You can offer consumers from the group committing frequent purchases for small amounts to buy goods and services related to the ones that they purchase.
And so on.
The main thing that RFM analysis allows you to make is to understand the structure of the customer base, and see the processes in it.
Finally, the last step is to subordinate the tools that you use in marketing to the results of data analysis. Now you can teach your CRM system to evaluate each customer in terms of RFM and any other parameters, and to comprehend the risks of losing a customer. It should be set so as it manages personalized points of contact – e-mail, SMS, points of bonus programs and much more. Now all this can be generated individually for each customer taking into account all the risks and probabilities.
15 important indicators for data driven monitoring.
Thus, we have examined the algorithm comprising several approaches and having a statistical basis. Since we believe that the future of marketing is in numbers and rigorous scientific knowledge, it will allow companies to shift the focus from sales and enable companies to develop engineering capabilities.
Mazzocchi, Mario. Statistics for Marketing and Consumer Research,2008
Chapman, Christopher N., McDonnell Feit, Elea, R for Marketing Research and Analytics, 2015
Hastie, Tibshirani & Friedman, The Elements of Statistical Learning, 2001
Jeffrey Stanton, An Introduction to Data Science, 2013
Lisa Arthur, Big Data Marketing: Engage Your Customers More Effectively and Drive, 2013
1. Plekhanov Russian University of Economics, Moscow, Russia. e-mail: veynberg@gmail.com
2. Plekhanov Russian University of Economics, Moscow, Russia. e-mail: Rea101@mail.ru
3. Plekhanov Russian University of Economics, Moscow, Russia. e-mail: Popov.AA@rea.ru
4. Plekhanov Russian University of Economics, Moscow, Russia. e-mail: Bortsova.DE@rea.ru
5. [1, p. 50].Golubkov E.P. Marketing Theory and Methodology: Present and Future / E.P. Golubkov. – M. : Business and Service, 2008. – 208 p.