![]() ISSN 0798 1015
ISSN 0798 1015

![]() ISSN 0798 1015
ISSN 0798 1015
 Vol. 39 (Number 12) Year 2018. Páge 9
Galina V. GOLIKOVA 1; Andrey S. SVIRIDOV 2; Natalia А. SAFONOVA 3; Tatiana А. NEKRASOVA 4; Irina А. PURGAEVA 5
Received: 01/11/2017 • Approved: 25/11/2017
ABSTRACT: The article is devoted to studying various aspects of the concept of human development from the point of view of cross-country comparison of the Human Development Index. The comparative analysis was performed for three directions related to healthcare, education, and general economic development. More and more economically development countries are oriented in their macro-economic policy not so much at economic growth as at increase of the population’s living standards. The authors view the methodology of calculating the Human Development Index and conduct analysis of its main components. The analysis of financing of human capital in Russia – government expenditures for education and healthcare – is performed, and the scenario mechanism of the national economy development is presented. The necessity for structural transformation in the Russian Federation for reducing the underrun of human development from the leading economies of the world and increase of the population’s living standards is substantiated. |
RESUMEN: 1147/5000 El artículo está dedicado a estudiar diversos aspectos del concepto de desarrollo humano desde el punto de vista de la comparación entre países del Índice de Desarrollo Humano. El análisis comparativo se realizó en tres direcciones relacionadas con la atención médica, la educación y el desarrollo económico general. Cada vez más países de desarrollo económico se orientan en su política macroeconómica no tanto hacia el crecimiento económico como hacia el aumento de los niveles de vida de la población. Los autores ven la metodología de cálculo del Índice de Desarrollo Humano y realizan análisis de sus principales componentes. Se realiza el análisis de la financiación del capital humano en Rusia, los gastos del gobierno en educación y salud, y se presenta el mecanismo de escenario del desarrollo de la economía nacional. Se justifica la necesidad de una transformación estructural en la Federación de Rusia para reducir la insuficiencia del desarrollo humano de las principales economías del mundo y el aumento del nivel de vida de la población. |

The concept of human development replace the “classic” economic theories that viewed a human only as a driving force of economic development, and economic growth – as the main goal of public progress. The concept of human development is oriented at increase of human’s living standards, which is a complex notion which includes various aspects of life activities [1, 8]. Economic growth is not the final goal but a means of human development. However, the social function of macro-economic policy of the state is – according to the population – a precondition for increase of the living standards [12, 13].
One of the components of human potential, economic development, and integrity of society is human capital, which is a social benefit for an individual and a basis for formation and development of personality [6, 9, 10, 11].
The socio-economic situation in Russia requires structural transformations that consist in transition from the resource economy to innovational economy. This requires a complex of structural reforms for increase of effectiveness of human capital use, which will require growth of expenditures for education, healthcare, growth of population’s well-being, and reduction of inequality in distribution of income.
We offer to perform a comparative analysis of the main tool of the concept of human development in Russia and the world – the Human Development Index (HDI) - integral (total) indicator of the level of human development (living standards) in a certain country, which determines the level of average achievements in the three main directions: long and healthy life, knowledge, and decent living standards. The purpose of the article is to evaluate the position of the RF in the list of the countries of the world as to the HDI, as well as the ways of increase of living standards and development of human capital.
Every year, starting from 1990, the UN has been publishing the results of the HDI calculation for the countries of the world for inter cross-country national comparisons.
For each component of the HDI, the sub-indices are calculated: the index of life expectancy at birth, the index of achieved level of education, and the index of GDP per capita in USD (PPP) ; thus, HDI is a direct average of the sub-indices, as each of them has equal weight of one third [2]. Cross-country comparison of this indicator is performed by ranking the countries of the world as to the HDI value, which is in the range 0-1.
The index of the achieved level of education is measured as a sum of two indices: the index of literacy of adult population with the weight 2/3 and the coefficient of the total share of those studying with the weight 1/3.
Calculation of sub-indices is determined by the ratio of difference of the factual and minimal values of the indicator to the difference between the maximal and minimal values of the indicator.
The HDI also takes into account the index of GDP, determined similarly; however, the decimal logarithms of factual, maximal, and minimal values of GDP per capita are compared.
Minimal and maximal values of the corresponding indicators for calculating sub-indices of the HDI are presented in Table 1.
Table 1
Maximal and minimal values of the indicators for calculating the HDI sub-indices
Sub-index |
Value |
|
minimal |
maximal |
|
1. Index of life expectancy, years |
25 |
85 |
2. Index of population’s education level, % |
0 |
100 |
3. Index of GDP per capita, $ (PPP) |
100 |
40,000 |
The main purpose of the HDI calculation consists in focusing on the comparison of economic indicators of development of the countries and taking into account the difference in the living standards and development of human capital.
In 2010, the HDI was corrected – in addition to the used HDI, which was based on the average country statistical data and did not consider internal inequality, three new indicators were presented: the Index of human development, corrected in view of socio-economic inequality (HDIН), the Index of gender development (IGD), the Index of gender inequality (IGI), and the Multidimensional poverty index (MPI).
Low financing of the components of human capital is viewed as one of the main obstacles on the path of modernization of the Russian economy. Over the recent years, investments into human capital in the total investments or GDP have been reducing, and, accordingly, Russia’s underrun as to the volume and quality of accumulated human capital per capita has been growing. Let us compare the data for expenditure for education and healthcare in the Russian Federation and a range of countries from the OECD.
Let us evaluate the government expenditures for education in Russia and other countries in percentagewise to GDP (Table 2).
Table 2
Government expenditures for education, % of GDP
Country |
2010 |
2011 |
2012 |
2013 |
2014 |
Hungary |
5.5 |
5.1 |
4.7 |
4.6 |
5.2 |
Germany |
4.4 |
4.3 |
4.2 |
4.3 |
4.3 |
Greece |
4.1 |
4.4 |
4.5 |
4.6 |
4.4 |
Spain |
4.5 |
4.4 |
4.2 |
4.1 |
4.1 |
Italy |
4.4 |
4.1 |
4.1 |
4.1 |
4.1 |
Poland |
5.5 |
5.4 |
5.4 |
5.3 |
5.3 |
Portugal |
7.6 |
7.3 |
6.2 |
6.2 |
6.2 |
Russia |
4.1 |
3.7 |
3.8 |
4.1 |
3.9 |
Slovakia |
4.2 |
4.1 |
4.1 |
4.0 |
4.1 |
Slovenia |
6.5 |
6.4 |
6.5 |
6.5 |
5.9 |
USA |
6.8 |
6.7 |
6.4 |
6.2 |
6.1 |
France |
5.6 |
5.5 |
5.5 |
5.5 |
5.5 |
Czech Republic |
10.9 |
10.9 |
11.0 |
11.1 |
11.1 |
South Korea |
4.9 |
5.0 |
5.2 |
5.2 |
- |
Japan |
3.6 |
3.6 |
3.6 |
3.6 |
3.5 |
Source — OECD, authors’ evaluation on the basis of the data of the Russian Treasury
Over the analyzed period of 2010-2014, the level of government expenditures for education in Russia reduced from 4.1 % in 2010 to 3.9 % in 2014. With such indicators, Russia is behind the OECD countries, except for Slovakia (4.1 % in 2014), Greece (4.4 % in 2014), and Spain (4.1 % in 2014). In mid-term, further reduction of government expenditures for education (3.8 % in 2015) will lead to larger underrun of Russia from the OECD countries as to the level of government expenditures for education percentagewise to GDP [3, 4, 5, 7, 9].
The issues of accessibility and quality of education influence the development of human capital, so they are included into the strategic programs of development of all developed and developing countries of the world. Russia is a country with a medium level of education (24th position out of 38); at that, the level of population’s literacy constitutes 99.8 % (in the world - 88 %), which is a level of the countries with high level of income. The share of the Russian population with higher education constitutes 34,4 %; 96% of the Russians have at least senior secondary education, which is above the average for the countries of the OECD (75 %) and BRICS (as to this indicators, Russia is ahead of Brazil by 2 times and ahead of China by 4 times).
The number of those studying by the higher education programs in 2010-2014 is presented in Table 3.
Table 3
The number of people studying by the programs of higher education per 1,000 people in 2010-2014
Страна |
2010 |
2011 |
2012 |
2013 |
2014 |
Hungary |
39 |
38 |
38 |
36 |
33 |
Germany |
… |
… |
… |
35 |
36 |
Spain |
40 |
42 |
42 |
42 |
43 |
Italy |
33 |
33 |
32 |
31 |
… |
Poland |
56 |
54 |
52 |
49 |
… |
Portugal |
36 |
38 |
37 |
35 |
35 |
Russia |
65 |
61 |
58 |
54 |
51 |
Slovakia |
43 |
42 |
41 |
39 |
36 |
Slovenia |
56 |
52 |
50 |
47 |
44 |
USA |
66 |
67 |
67 |
63 |
62 |
France |
36 |
36 |
36 |
37 |
37 |
Czech Republic |
42 |
42 |
42 |
41 |
40 |
South Korea |
67 |
68 |
68 |
67 |
… |
Japan |
30 |
30 |
31 |
30 |
… |
In the given list of countries, Russia is among the leaders as to the number of people studying by the programs of higher education per 1,000 people. The highest values of the viewed indicator are observed in South Korea and the USA – 67 people. At that, the similar indicator was observed in the RF in 2010 – after that, there was a sustainable tendency for reduction, and by 2014 there were only 51 people studying by the programs of higher education per 1,000 people.
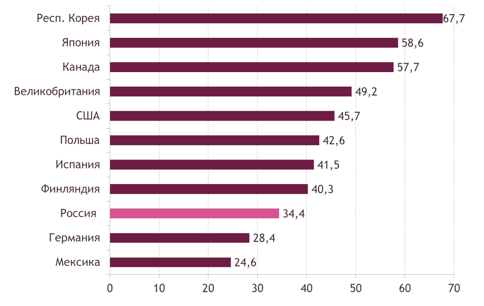
Cross-country comparison for 2015 as to the share of population with higher education in the countries of the world is given in Figure 1. As is seen, Russia is ahead of Mexico and Germany, but is behind South Korea, Japan, and Canada (Figure 1).
Figure 1
Share of the population with higher education in 2015, %
Let us perform cross-country comparisons of government expenditures for healthcare based on the data presented in Table 4.
Table 4
Government expenditures for healthcare, % of GDP
Country |
2010 |
2011 |
2012 |
2013 |
2014 |
Hungary |
5.1 |
5.1 |
5.2 |
5.0 |
5.0 |
Germany |
7.0 |
6.8 |
6.8 |
7.0 |
7.2 |
Greece |
6.8 |
6.4 |
5.8 |
5.1 |
4.7 |
Spain |
6.6 |
6.5 |
6.2 |
6.1 |
6.1 |
Italy |
7.4 |
7.1 |
7.2 |
7.2 |
7.2 |
Poland |
5.0 |
4.7 |
4.6 |
4.6 |
4.6 |
Portugal |
7.3 |
6.8 |
6.5 |
6.4 |
6.2 |
Russia |
1.9 |
3.2 |
3.4 |
3.3 |
3.2 |
Slovakia |
1.8 |
1.9 |
1.8 |
1.8 |
1.9 |
Slovenia |
7.0 |
7.1 |
7.1 |
6.9 |
6.6 |
USA |
8.8 |
8.8 |
8.7 |
8.6 |
8.8 |
France |
7.9 |
7.9 |
8.0 |
8.1 |
8.2 |
Czech Republic |
9.4 |
9.7 |
9.9 |
9.8 |
9.8 |
South Korea |
3.7 |
3.7 |
3.7 |
3.9 |
– |
Japan |
6.9 |
7.3 |
7.4 |
7.4 |
7.5 |
Source — OECD, the authors’ evaluation based on the data of the Russian Treasury
The data provided in Table 4 allows concluding that government expenditures for healthcare in Russia are lower than for education; in 2014, they constituted 3.2% of GDP. Only Slovakia has the indicator that is lower – 1,9% in 2014. According to the recommendations of the World Health Organization, expenditures for healthcare should constitute 6-8% of GDP – thus, Russia has to increase this indicator by two times, in order to reduce the underrun from other countries as to the quality of medical services [3, 4, 5].
Let us compare certain indicators of development of the system of healthcare: the number of doctors in total and per 100,000 people, as well as the number of beds per 100,000 people in Russia and the given countries (Table 5).
As to the number of doctors, Russia is ahead of all given countries, except for the USA. However, the population of the USA is twice the population of Russia. As for the number of doctors per 100,000 people, Russia is ranked 2nd behind Greece; Greece has 140 more doctors per 100,000 people.
Table 5
Certain indicators of development of the healthcare system in 2014
Country |
Number of doctors |
Number of beds per 100,000 people |
|
total, thousand people |
per 100,000 people |
||
Hungary |
32.8 |
332 |
698 |
Germany |
332.7 |
411 |
823 |
Greece |
68.8 |
625 |
420 |
Spain |
176.7 |
380 |
297 |
Italy |
235.9 |
388 |
331 |
Poland |
87.7 |
231 |
663 |
Portugal |
46.0 |
443 |
332 |
Russia |
709.4 |
485 |
866 |
Slovakia |
16.2 |
300 |
579 |
Slovenia |
5.7 |
277 |
454 |
USA (in 2011) |
767.8 |
245 |
310 |
France |
206.2 |
322 |
641 |
Czech Republic |
38.8 |
369 |
646 |
South Korea |
112.5 |
223 |
1030 |
Japan (in 2013) |
303.3 |
238 |
1236 |
Russia and Germany has similar values of the qualitative indicators. Russia has 485 doctors per 100,000 people, Germany – 411; Russia has 866 beds per 100,000 people, Germany – 823.
Life span of the population is one of the main indicators that characterizes the state of healthcare and, therefore, quality of life and human development (Table 6).
Table 6
Life span in Russia and developed countries, 1970-1975 and 2010-2015
|
Men |
Women |
||
1970-1975 |
2010-2015 |
1970-1975 |
2010-2015 |
|
Countries with high income |
66.8 |
75.7 |
73.9 |
80.9 |
Countries with average high income |
58.8 |
71.8 |
62.5 |
74.9 |
Russia |
63.2 |
64.2 |
72.9 |
75.6 |
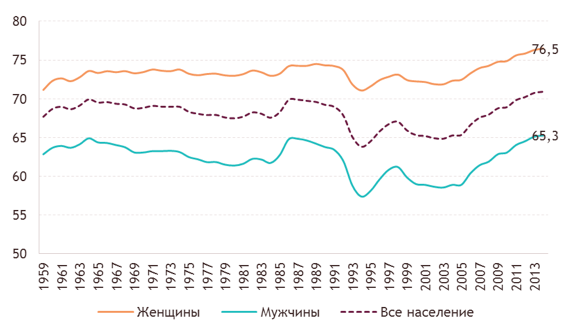
Life span of men in Russia increased from 63.2 to 64.2 years over the analyzed period; still, it is lower than in the countries with high and average high income – by 11.5 and 7.6 years, accordingly. Life span of women in Russia in 2010-2015 corresponds to life span in the countries with average high income and is by 5.3 years lower than in the countries with high income. At that, there’s a large gap between life span of men and women in Russia, which constituted 11.4 years in favor of women in 2010-2015 (Figure 2).
Figure 2
Life span in Russia, 1959-2013
In all Russian regions, life span of women is higher than of men, but in all Russian regions the HDI of women is lower than of men.
The main indicator of economic growth and, therefore, of economic development in Russia is the absolute value of GDP. Due to the current socio-economic situation in Russia, implementation of sanctions, and reduction of oil prices, there’s a need for measures for overcoming the crisis situation. According to the chair of the Center of strategic development, A.L. Kudrin, without a complex of structural reforms (further privatization, modernization of the law-enforcement and judicial systems, support for competition and small business, budget consolidation and redistribution of budget assets in favor of development of human capital and infrastructure, and the reform of state management), the growth rate of the Russian economy will remain within 2% of GDP in the long-term.
Without these transformations, the inertial scenario of Russia’s economic development will be realized, according to which the rates of growth of the Russian economy will be limited by 1 % per year in the next 15 years, which will lead to increase of the gap in the level of well-being from the developed countries (Table 7).
Table 7
Parameters of the inertial scenario of economic development of the
Russian Federation until 2030, the Ministry of Finance of Russia
Parameters |
2014 |
2015 |
2016 |
2017 |
2018 |
2019 |
2020 |
2025 |
2030 |
Price for Urals oil, $/barrel |
97.6 |
51.1 |
40.0 |
40.8 |
41.6 |
42.4 |
43.3 |
47.8 |
52.8 |
RUB/USD exchange rate |
38.4 |
61.0 |
68.2 |
68.3 |
68.8 |
69.6 |
70.9 |
74.9 |
77.2 |
GDP, growth rate, % |
0.7 |
-3.7 |
-0.8 |
1.0 |
1.4 |
1.3 |
1.2 |
1.2 |
1.3 |
Inflation as of year-end, % |
7.8 |
12.9 |
6.8 |
4.0 |
4.0 |
4.0 |
4.0 |
2.9 |
2.6 |
Real wages, % to the previous year |
1.2 |
-8.9 |
-3.5 |
0.2 |
1.7 |
1.6 |
1.9 |
1.5 |
1.5 |
Source — the Ministry of Finance of Russia, based on the data of Vedomosti, Federal State Statistics Service
Russia to face 15 years of stagnation, if there are no reforms and increase of oil prices // Vedomosti, 15.02.2016 http://www.vedomosti.ru/economics/articles/2016/02/15/629411-15-let-zastoya
According to the authors of the report in human development in Russia-2016, based on the data of the Ministry of Economic Development of Russia and the Ministry of Finance of Russia, the expected realistic and desired rates of GDP growth until 2030 are seen in Figure 3.
Figure 3
Expected growth rates of real GDP of Russia, %
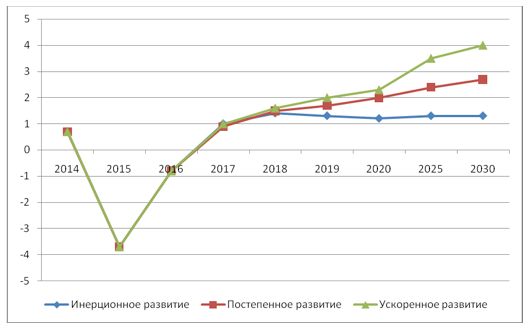
Thus, the Figure shows expected growth rates of real GDP based on three variants of development of economy: inertial, gradual, and quick. According to the experts, the expected growth rated of the Russian GDP with inertial development will constitute 1-1.3 % by 2030, with gradual development – 1.8-2.3 %, and with quick development – 2.5-4.0 %.
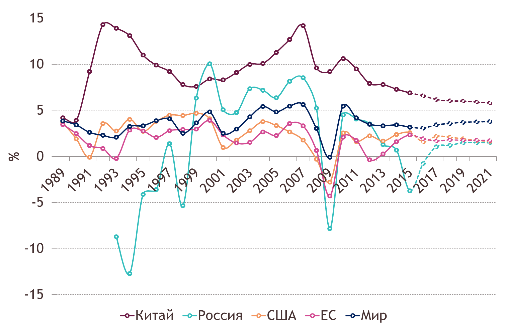
As for dynamics of growth of GDP in the world, it can be seen with the data given in Figure 4.
Figure 4
Dynamics of growth of GDP in the world, %, 1989-2021
The UN ranks the countries as to decrease of the calculated HDI values, dividing them into four groups: very high (the value of the index at least 0.8), high (the value of the index at least 0.7), medium (the value of the index at least 0.55), and low (the value of the index below 0.55) levels of human development. Russia’s indicator 0.798 (similar to the value of HDI of the Republic of Belarus) of 2014 put it into the countries with high level of human development (Table 8).
On average for the world, the value of the index constituted 0.711, which is lower than the Russia’s indicator. Starting from 2000’s, Russia has been showing positive dynamics of the index change. In 2015, the Russia’s HDI equaled 0.804, which gave it 49th position in the world. The leader as to the level of human development is Norway with the index of 0.944 (the first position in 1999–2004 and from 2007 until now). In 2005– 2006, the leader was Iceland, before 1999 — Canada, and before that — Japan. The countries of Central Africa are outsiders. The last positions were occupied in 2015 by the Central African Republic (0.35) and Nigeria (0.348). The main reason for underrun of these countries was absence of the general system of education.
Table 8
Dynamics of the Human Development Index (according to the UNDP methodology)
No. |
Country |
1999 |
2000 |
2010 |
2011 |
2012 |
2013 |
2014 |
2014* |
1 |
Norway |
0.849 |
0.917 |
0.940 |
0.941 |
0.942 |
0.942 |
0.944 |
0.893 |
6 |
Germany |
0.801 |
0.855 |
0.906 |
0.911 |
0.915 |
0.915 |
0.916 |
0.853 |
8 |
USA |
0.859 |
0.883 |
0.909 |
0.911 |
0.912 |
0.913 |
0.915 |
0.760 |
9 |
Canada |
0.849 |
0.867 |
0.903 |
0.909 |
0.910 |
0.912 |
0.913 |
0.832 |
14 |
United Kingdom |
0.773 |
0.865 |
0.906 |
0.901 |
0.901 |
0.902 |
0.907 |
0.829 |
20 |
Japan |
0.814 |
0.857 |
0.884 |
0.886 |
0.888 |
0.890 |
0.891 |
0.780 |
22 |
France |
0.779 |
0.848 |
0.881 |
0.884 |
0.886 |
0.887 |
0.888 |
0.811 |
26 |
Spain |
0.756 |
0.827 |
0.867 |
0.870 |
0.874 |
0.874 |
0.876 |
0.775 |
36 |
Poland |
0.713 |
0.786 |
0.829 |
0.833 |
0.838 |
0.840 |
0.843 |
0.760 |
50 |
Belarus |
- |
0.683 |
0.786 |
0.793 |
0.796 |
0.796 |
0.798 |
0.741 |
50 |
Russia |
0.729 |
0.717 |
0.783 |
0.790 |
0.795 |
0.797 |
0.798 |
0.714 |
56 |
Kazakhstan |
0.690 |
0.679 |
0.766 |
0.772 |
0.778 |
0.785 |
0.788 |
0.694 |
72 |
Turkey |
0.576 |
0.653 |
0.738 |
0.751 |
0.756 |
0.759 |
0.761 |
0.641 |
75 |
Brazil |
0.608 |
0.683 |
0.737 |
0.742 |
0.746 |
0.752 |
0.755 |
0.557 |
81 |
Ukraine |
0.705 |
0.668 |
0.732 |
0.738 |
0.743 |
0.746 |
0.747 |
0.689 |
90 |
China |
0.501 |
0.588 |
0.699 |
0.707 |
0.718 |
0.723 |
0.727 |
- |
116 |
SAR |
0.621 |
0.632 |
0.643 |
0.651 |
0.659 |
0.663 |
0.666 |
0.428 |
130 |
India |
0.428 |
0.496 |
0.586 |
0.597 |
0.600 |
0.604 |
0.609 |
0.435 |
188 |
Nigeria |
0.214 |
0.257 |
0.326 |
0.333 |
0.342 |
0.345 |
0.348 |
0.246 |
* The 2014 data, recalculated in view of the in-country inequality.
The higher the country’s inequality, the lower the corrected value of the index. The Russia’s index in view of inequality is 0.714, the global average index— 0.548.
Index of income distribution (the Gini coefficient) characterizes the level of deviation of factual distribution of the total volume of income (consumer expenditures) of the population from the equal distribution. The value of the coefficient may vary from 0 to 1 – at that, the higher the indicator, the more unequal the distribution of income in the society (Table 9).
In Russia, differentiation of the population as to the level of income is very high, which is shown by the Gini coefficient (41.6) and the decile coefficient (16) – as to this indicator, Russia is at the same level with the UK, Turkey, and Nigeria. According to the UN recommendations, decile coefficient should not exceed 10 times, so as to create no conditions for growth of social tension.
Table 9
The level of socio-economic grouping of population and poverty level, %
Country |
Years |
Share of income (consumer expenditures) for each of the 20% groups of the population |
Gini coefficient |
Decile coefficient (in times) |
||||
I |
II |
III |
IV |
V |
||||
Germany |
2010 |
8.3 |
13.1 |
17.1 |
22.4 |
39.1 |
30.6 |
7.4 |
USA |
2010 |
4.7 |
10.4 |
15.8 |
23.1 |
46.0 |
41.1 |
21.5 |
Canada |
2010 |
7.1 |
12.4 |
16.8 |
22.7 |
41.0 |
33.7 |
9.6 |
United Kingdom |
2010 |
5.8 |
11.4 |
16.2 |
22.6 |
44.1 |
38.0 |
15.0 |
Poland |
2011 |
7.9 |
12.3 |
16.6 |
22.3 |
40.9 |
32.8 |
8.0 |
Belarus |
2014 |
9.4 |
13.7 |
17.1 |
22.0 |
37.8 |
27.5 |
6.0 |
Russia |
2014 |
5.2 |
9.9 |
14.9 |
22.6 |
47.4 |
41.6 |
16.0 |
Kazakhstan |
2014 |
9.4 |
13.2 |
17.1 |
22.4 |
37.9 |
27.8 |
5.7 |
Turkey |
2011 |
5.8 |
10.6 |
15.2 |
21.9 |
46.5 |
40.0 |
14.1 |
Brazil |
2012 |
3.4 |
7.7 |
12.4 |
19.3 |
57.2 |
52.7 |
40.1 |
Ukraine |
2014 |
10.9 |
14.4 |
17.9 |
22.1 |
34.2 |
22.6 |
4.4 |
China |
2010 |
4.7 |
9.7 |
15.3 |
23.2 |
47.1 |
42.1 |
17.7 |
SAR |
2011 |
2.5 |
4.3 |
7.7 |
15.6 |
69.9 |
65.0 |
51.2 |
India |
2009 |
8.5 |
12.1 |
15.7 |
20.8 |
42.8 |
33.9 |
7.8 |
Nigeria |
2010 |
5.4 |
9.6 |
14.5 |
21.6 |
48.9 |
43.0 |
15.1 |
Thus, the Russia’s HDI constituted 0.804 in 2015, which allowed it to be among the countries with very high level of income and be ranked 49th in the world. At the same time, taking into account the Russia’s economic situation, the possibility of transition from resource economy to innovational economy, as well such uncertainty as oil prices and risks of geopolitical instability, which might be expressed in aggravation of perspectives of economic cooperation of Russia with some countries and be accompanied by increase of the Russian sanctions in certain sphere, there are several variants of Russia’s economic development. According to the experts, the growth rates of Russia’s GDP in case of inertial development will constitute 1-1.3 % until 2030, with gradual development – 1.8-2.3%, with quick development – 2.5-4.0%.
There’s a need for structural reforms, which could be hindered by low financing of the components of human capital in Russia, which has had a tendency for reduction over the recent years.
Russia is behind the leading countries of the world for such indicator as the level of government expenditures for education and healthcare.
In Russia, life span of women exceeds life span of men by more than 10 years, and is much lower than in the countries with high and average high income.
As for education, Russia belongs to the group of countries with the medium level of education – 24th position out of 38. The level of population’s literacy is 99.8%, which is much higher than the average global value - 88%.
1. The report on human development in the Russian Federation for 2016 / edited by S.N. Bobylev and L.M. Grigoryev. — М.: Analytical center with the Government of the Russian Federation, 2016. 298 p.
2. Demographic and social statistics: Encyclopedia of statistical terms. In 8 volumes / Federal State Statistics Service. – М.: 2011. Vol. 5. – 482 p. (p. 278).
3. The official web site of the Federal State Statistics Service www.gks.ru (Accessed: 20.06.2017).
4. Russia to face 15 years of stagnation, if there are no reforms and increase of oil prices // Vedomosti, 15.02.2016 URL:http://www.vedomosti.ru/economics/articles/2016/02/15/629411-15-let-zastoya (Accessed: 20.06.2017).
5. Russia and countries of the world. 2016: Statistical collection/ Federal State Statistics Service. – М.: 2016. - 379 p.
6. Bezrukova T.L.. The structure of intellectual capital in innovational organizations / T.L. Bezrukova, Е.V. Chugunova // Journal of Forestry. - 2011. - No. 4 (4). - P. 130-134.
7. Bezrukova T.L. Formation of intellectual potential in the innovational organization/ T.L. Bezrukova, Т.Е. Kuznetsova, Е.V. Chugunova // Perspectives of the innovational development of modern global society: economic & legal and social aspects: materials of the International scientific and practical conference 2012, Voronezh, April 24-27, 2012: [5 Vol.] / edited by S.L. Igolkin, T.L. Bezrukova and A.E. Akhmedova. - М., 2012. - V. 3. - P. 92-97.
8. Bezrukova T.L. Comparative analysis of the methodological approaches to evaluating the living standards of the population in economic research / T.L. Bezrukova, D.U. Bikulova // Current directions of scientific research of the 21st century: theory and practice: collection of scientific works on the materials on the international scientific and practical conference. - Voronezh, 2014. - No. 3, P. 1 (8-1). - P. 345-352.
9. Borodina, T.А. Educational and socio-cultural environment of a university as the factor of innovational development of Russia / Т.А. Borodina, О.V. Pastushkova // Volume: Current approaches to transformation of the concept of state regulation and management in socio-economic systems, 2015. – P. 25-32.
10. Borodina, Т.А. Raising quality of life as a top-priority direction of the state policy / Т.А. Borodina // Volume: Current approaches to transformation of the concept of state regulation and management in socio-economic systems, 2016. – P. 39-41.
11. Golikova, G.V. Interconnection between the system of higher education and the needs of labor market in the conditions of innovational transformation of the Russian economy / G.V. Golikova, I.А. Tolstykh // Region: systems, economic, management, 2015. No. 3(30). – P. 82-85.
12. Sviridov А.S. The methodological approach to development of the basic strategies of managing the processes of socialization of business in the Russian regions/А.S.Sviridov // Bulletin of Voronezh State University. Series: Economics and management. 2015.No. 3. P. 154-158.
13. Sviridov А.S. Sоcial functions of business – theoretical analysis /А.S. Sviridov /Mоdern economy: problems and solutions. 2015. No. 4. P. 86-96.
1. Voronezh State University, Voronezh, Russia. e-mail: ggalina123@yandex.ru
2. State University of Sea and River Fleet named after the admiral S.O. Makarov, Voronezh branch, Voronezh, Russia. e-mail: sviridov2010@mail.ru
3. State University of Sea and River Fleet named after the admiral S.O. Makarov, Voronezh branch, Voronezh, Russia. e-mail: nata.safonova.1960@mail.ru
4. Voronezh State Technical University, Voronezh, Russia. e-mail: nekrasova-tatiana@list.ru
5. Voronezh State Technical University, Voronezh, Russia. e-mail: tolsira@yandex.ru
6. Demographic and social statistics: Encyclopedia of statistical terms. In 8 volumes / Federal State Statistics Service. – М.: 2011. Vol. 5. – 482 p. (p. 278).