![]() ISSN 0798 1015
ISSN 0798 1015

![]() ISSN 0798 1015
ISSN 0798 1015
 Vol. 39 (Number 12) Year 2018. Page 30
Viktoriya V. LING 1
Received: 17/11/2017 • Approved:05/01/2018
ABSTRACT: The article provides an overview of the financial indicators used to analyze the efficiency of oil field development. The technique of calculation, the scale normative values and their interpretation in the framework of the objectives of the analysis. |
RESUMEN: El artículo proporciona una visión general de los indicadores financieros utilizados para analizar la eficiencia del desarrollo del campo petrolífero. La técnica de cálculo, los valores normativos de escala y su interpretación en el marco de los objetivos del análisis. |

Oil and gas are one of the groundworks of the Russian economy. Russia takes one of the leading places in the world in the field of production and export of crude oil and natural gas. About 6.1% of the world's explored oil reserves are concentrated in the depths of Russia. Approximately 60% account for Urals and Siberia share, which creates potential export opportunities in both the western and the eastern directions. Russia's fuel and energy complex (including coal) provides 27% of the land’s GDP. At the same time, 43% of oil and gas revenues to the budget account for the fuel and energy complex, the share of the fuel and energy complex is 63%, in the export sector, in addition, the share of citizens employed in the fuel and energy sector is 3.6% of the total number of employees. Russia is also the world's largest exporter of natural gas and energy resources in general.
According to FSSS, oil production in Russia, including gas condensate, increased in the first quarter of 2015 by 1.2% to 132 million tonnes. Gas production fell by 8.2% to 150 billion m3. Coal production increased by 6.8% to 91.1 million tonnes. (FSSS: Official statistics. 2015)
Oil companies around the world spend large amounts of money on computer modeling of oil fields annually. From the economic point of view, it is necessary to determine the oil levels to obtain the maximum economic efficiency of the oil field development investment project.
This problem becomes urgent and especially important in terms when oil and gas prices are low or unstable, and the profitability of the project is at risk.
The task of analyzing the economic efficiency of the oil field development project is to calculate the main economic indicators of the project evaluation, choose the most profitable of them that will ensure the maximum economic effect, determine the payback of planned investments, and obtain the planned gross profit from the project.
When making a decision, it is also important to clarify the dependence of the influence of various factors on economic efficiency. In this situation, a rapid and quality analysis of a large number of options based on economic criteria is essential. Economic assessments should take into account the geological-physical, geological-industrial, technological and ecological features of the production facilities and development fields.
Let us consider the main financial and economic factors affecting the oil production process and form a set of indicators enabling to assess its effectiveness.
When determining the influence of economic factors on oil production efficiency, it is necessary to reflect the conditions of product distribution in the market (external, domestic market), changing of the current tax system (applying preferential taxation or reducing tax rates), and various discount rates.
Evaluation of the effectiveness of taken decisions is assessed by a set of calculated indicators serving as economic criteria.
Economic assessments should include the following factors:
Economic evaluation of development options is carried out using a metrics peculiar to the market economy, widely used in foreign and now in domestic practice. The calculation procedure should be in accordance with the procedure of technological documents drawing up for the development of oil and gas-oil fields (RD 153-39-007-96, 2009).
The main criteria for assessing the effectiveness of the project are:
Capital investments. Capital investments include fixed assets, including costs for capital construction, expansion, reconstruction and technical re-equipment of existing enterprises, purchase of machinery, equipment, tools, inventory, design and survey work, and other costs.
Capital investments are calculated by the years of introduction of field in the development until the end of the drilling and arrangement and further beyond that time, if necessary.
For oil formations equipped and already brought into development, the purpose of capital investments is determined in accordance with their reproductive structure: new construction, expansion, reconstruction or technical re-equipment.
When drawing up the project documentation for the fields under development, especially if they are geographically adjacent to other fields, capital investments should be calculated with due account for the possibility to use the available capacities of the field facilities for the needs of the projected facility.
Capital investments can be calculated also by specific areas including the costs for drilling wells and construction. Capital investments in drilling wells are determined on the basis of the estimated cost of 1 m of sinking by boring, determined depending on the well depth, the number of producing, injection, and other wells bringing from drilling (Economic messages, 2015)
Capital investments in the construction of facilities for oil gathering and transportation, integrated automation of technological processes, water supply of industrial facilities, power supply, communications and the production service base are determined by multiplying the specific capital costs in the appropriate direction by the number of oil wells brought from drilling, and in flooding oil reservoirs – by the number of injection wells.
For the preparation of oil, treatment facilities, capital investments are calculated by multiplying the specific capital costs in the appropriate direction by the oil production and cleaning capacity introduced in the given year.
The infrastructure is calculated as a percentage of the cost for oil field construction. The costs for environmental protection measures are calculated as a percentage of the total amount of investments cost including the cost of drilling operations (Altunin A.E. and Semukhin M.V., 2007).
Operational costs. When evaluating development options, operating costs can be calculated by expenditure costs - calculation articles or cost elements. In this case, these costs are calculated using a method based on the calculation articles.
The operating costs are calculated in accordance with the specific operating costs and volumetric technological indicators in the context of the following articles (Altunin A.E. and Semukhin M.V., 2007):
The costs of servicing the production wells are determined depending on the number of active wells and include the wages (basic and additional) of workers, shop costs, general production costs, as well as the costs for equipment maintaining and operating.
Energy costs are calculated depending on the volume of mechanized extraction of liquid. The calculation of these costs is based on the average cost of electricity and its specific consumption.
The costs for gathering, transportation of oil and gas, processing of oil are calculated depending on the volume of produced liquid without regard to depreciation charges.
The costs of reservoir pressure maintaining are the sum of the costs of servicing the injection wells and the costs of water loading. The costs for water loading are determined on the basis of the amount of water pumped into the reservoir, its cost and energy consumption. The standard for determining the energy consumption when pumping water into the reservoir is established on the basis of specific electricity consumption and the cost of 1 kWh of electricity (Terekhov L.P. and Antonyan L.A., 2006).
Depreciation of fixed assets is calculated on the basis of their balance value and current standards for their full recovery. Depreciation charges are one of the sources of reproduction of fixed assets. Various ways of accrual of depreciation can be used at their estimation: linear (proportional) and accelerated(Altunin A.E. and Semukhin M.V., 2007).
At present, depreciation is mainly calculated by linear or proportional method. This method involves calculation of depreciation charges for renovation based on the average life of fixed assets. During this period, the balance value of these funds is completely transferred to production costs. As a rule, this standard in the oil industry makes 10-20%. If the field is already developed and there are previously established funds, then not only the newly but already created funds must be taken into account in calculating the depreciation charges.
Accelerated depreciation provides a complete transfer of the balance value of fixed assets to production costs within a shorter period than it is provided for by norms of the current depreciation charges. Thus, it becomes possible to create a reserve fund used for new capital investments and expansion of production capacities (Altunin A.E. and Semukhin M.V., 2007).
Environmental costs, credit payments, and taxes related to production cost are included in the operating costs of oil and gas production in addition to the traditional articles of calculation (Ermolov B.A. and Tsykin I.V. and Leonov L.V., 2008).
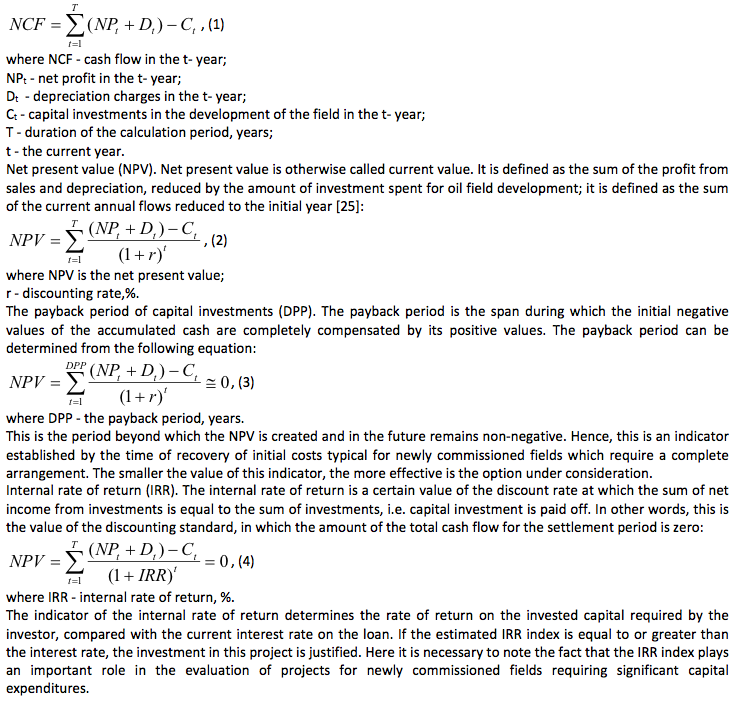
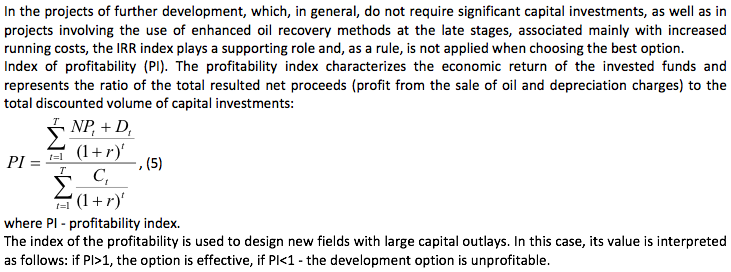
Cash flow (NCF). The cash flow is the sum of the profit from sales and depreciation charges, reduced by the amount of investment and calculated by the formula (Terekhov L.P. and Antonyan L.A., 2006):
When developing fields that are already equipped or in the late stages, this index is determined with taking into account existing fixed assets.
The income of the state is taxes and payments to the budgetary and extra-budgetary funds of the Russian Federation.
All listed technical and economic indicators are presented by field development periods - 5, 10, 20 years. The main integral indicators are calculated at a discount rate of 10 and 15% (Somov G.R., 1991).
The ultimate goal of the economic evaluation of the development options is to choose the best option to ensure the feasibility of industrial development of the facility under the project and the greatest efficiency of oil production. It is recommended to compare the various options and choose the best one using the above mentioned system of indicators. This system of indicators, used to determine development project effectiveness, takes into account the interests of direct participants of the project implementation, as well as the interests of the federal and local budgets.
The main indicator determining the choice of the recommended option from all considered is the discounted cash flow (NPV). The best option is the one with the maximum NPV value for the design term of development. A characteristic feature of this indicator is that, as a criterion for choosing an option, it is applicable both for newly introduced fields and for fields already under development. The calculation of NPV gives the answer on the effectiveness of the option in general (Analysis of oil production efficiency indicators, 2015).
Financial efficiency of the development of one of the fields located in Western Siberia in the north of the Tyumen region, Russia was assessed on the basis of the presented methodology. Estimation of fields can be carried out at any stage of development. It should be stressed that the development of the field is considered to be cost-effective, with an internal rate of income exceeding the discount rate used in the calculations.
When conducting a financial evaluation of this project’s effectiveness, the price base was used as of 01.01.2015, the project period was 12 years (from 2012 to 2023), the discounting rate was 12%. The price for the sale of oil was taken in accordance with Order No. 413-E / 11 of the Federal Tariff Service of the Russian Federation dated December 24, 2008 "On wholesale prices for oil and gas produced and sold to consumers of the Russian Federation". The fixed prices were adjusted according to the forecast of prices changes in 2016-2020. (State Corporation “Bank for Development and Foreign Economic Affairs (Vnesheconombank)”, 2008).
Capital investments in the development of the field are calculated on the basis of the estimate documentation for the construction of wells and the facility construction (Table 1). The average estimated cost of the well construction is $ 1.56 million, the total capital costs for the construction of 7 wells will be $ 11.15 million. The cost on the facilities is determined with taking into account the need for oil treatment, underground and surface disposal of significant volumes of reservoir water, creation of operational base for servicing the facility construction.
The operational costs in the development of the field are determined by calculation with taking into account the data on the analogs in the prices as on 01.01.12 (Table 1)
Table 1
Capital investments, mln. dollars
Year |
Well consrtuction |
Field facility construction |
Total capital investments |
2012 |
11,15 |
3,44 |
14,59 |
2013 |
0 |
1,56 |
1,56 |
2014 |
0 |
0 |
0 |
2015 |
0 |
0 |
0 |
2016 |
0 |
0 |
0 |
2017 |
0 |
0 |
0 |
2018 |
0 |
0 |
0 |
2019 |
0 |
0 |
0 |
2020 |
0 |
0 |
0 |
2021 |
0 |
0 |
0 |
2022 |
0 |
0 |
0 |
2023 |
0 |
0 |
0 |
-----
Table 2
Basic data for calculating the economic efficiency of the project
Indicators |
Meas. unit |
Σ |
1. Well infrastructure development |
piece |
7 |
2. Decommissioning (liquidation) |
piece |
0 |
3. Number of active wells |
piece |
- |
4. Annual average oil production |
mln. m3 |
30,04 |
5. Cumulative oil production |
mln. m3 |
360,48 |
6. Operating costs (without MPT), including: |
mln. dollars |
18,47 |
for oil production |
mln. dollars |
3,65 |
for oil processing |
mln. dollars |
0,43 |
for water disposal |
mln. dollars |
0,37 |
depreciation charges |
mln. dollars |
14,02 |
7. Capital investments in construction of wells |
mln. dollars |
11,15 |
8. Capital investments in construction |
mln. dollars |
5 |
9. Associated extraction of water |
thousands m3 |
1750,49 |
10. Cost of oil production |
dollars/1000 m3 |
55,84 |
11. The price of sales of oil without VAT |
dollars/1000 m3 |
- |
Revenues from sales are determined depending on the prevailing market price on the valuation date. Calculation of taxes for a legal entity is made in accordance with the Tax Code of the Russian Federation. The economic efficiency of the field development project is calculated on the basis of the data on the volume of capital investments and operating costs for the extraction of minerals.
Table 3
Operational activities for the project
Indicators |
Meas. unit |
Σ |
1.Revenues |
mln. dollars |
47,53 |
2. Current cost |
mln. dollars |
18,47 |
including wells liquidation |
mln. dollars |
0 |
3. MPT |
mln. dollars |
1,66 |
4. Gross profit |
mln. dollars |
27,40 |
5. Property tax |
mln. dollars |
2,09 |
6. Income tax |
mln. dollars |
5,26 |
7. Total taxes |
mln. dollars |
7,36 |
8. Net income |
mln. dollars |
20,05 |
-----
Table 4
Financial indicators of the project
Indicators |
Meas. units |
Σ |
Cashflow |
mln.dollars |
17,91 |
Cumulative cash flow |
mln.dollars |
17,91 |
New discounted income (NDI) (i = 12%) |
mln.dollars |
2,24 |
New discounted income (NDI) |
mln.dollars |
2,24 |
Internal rate of return (IRR) |
% |
15,02 |
Payback period (simple) |
years |
5,9 |
Payback period (discounted) |
years |
9,3 |
Index of return of capital investments |
fr. units |
1,14 |
-----
Table 5
Formation of profit from the sale of oil, mln. dollars
Years |
Oil production, mln.m3 |
Revenues from sale without VAT |
VAT on sold products |
Property tax |
Income tax |
Net income |
2012 |
0,52 |
0,05 |
0,01 |
0,15 |
0,00 |
-0,55 |
2013 |
14,11 |
1,44 |
0,26 |
0,30 |
0,00 |
-0,46 |
2014 |
43,79 |
5,15 |
0,93 |
0,29 |
0,60 |
2,41 |
2015 |
43,77 |
5,92 |
1,07 |
0,26 |
0,76 |
3,04 |
2016 |
43,90 |
5,94 |
1,07 |
0,23 |
0,77 |
3,08 |
2017 |
41,38 |
5,60 |
1,01 |
0,21 |
0,71 |
2,84 |
2018 |
35,34 |
4,78 |
0,86 |
0,18 |
0,56 |
2,23 |
2019 |
31,82 |
4,31 |
0,78 |
0,15 |
0,47 |
1,89 |
2020 |
29,22 |
3,96 |
0,71 |
0,12 |
0,41 |
1,64 |
2021 |
27,11 |
3,67 |
0,66 |
0,09 |
0,36 |
1,45 |
2022 |
25,48 |
3,45 |
0,62 |
0,07 |
0,33 |
1,30 |
2023 |
24,04 |
3,25 |
0,59 |
0,04 |
0,29 |
1,17 |
Total: |
360,48 |
47,53 |
8,56 |
2,09 |
5,26 |
20,05 |
Thus, the payback period of the capital investments in the project is achieved after 5,9 years of oil production (or 9,3 years with cash flow discounting). The project brings losses during the first 5-7 years due to the large volume of capital investments in the construction of wells and development of the field. It is possible to reduce the payback period with a reduction of production costs level or in case of outpacing growth in oil prices. The consolidated budget revenues are 32% of the sales. Evaluation of the field development effectiveness based on the proposed indicators proves economic efficiency of field development.
Within the scope of the research of the indicator set for financial evaluation of the field development efficiency, the author made a number of interrelated conclusions:
1. The correct selection of a set of indicators in the evaluation is the basis for the development of strategic managerial decisions by the investor. This helps to increase the adaptability of an industrial enterprise to the market.
2. Indicators of the project's economic efficiency can be significantly changed due to changes in various internal and external factors.
3. The proposed set of indicators for calculating project efficiency is universal for the oil industry and can be used to determine the company's long-term strategy and its adjustment.
Altunin A.E. and Semukhin M.V. (2007). Calculations in conditions of risk and uncertainty in oil and gas technologies. Tyumen: Pub. TSU, pp. 256
Analysis of oil production efficiency indicators. (2015). Retrieved from: http://www.gazkont.ru/text/849
BP Global. (2015). Russia's share of world oil reserves. Retrieved from: https://www.bp.com/content/dam/bp/pdf/energy-economics/statistical-review-2015/bp-statistical-review-of-world-energy-2015-full-report.pdf
Economic messages, (2015). Retrieved from: http://www.economicwind.ru
Ermolov B.A. and Tsykin I.V. and Leonov L.V. (2008) On the model of oil production cost price. The Economy of Russia: The 21st Century, 1(11): 22-31.
FSSS: Official statistics. (2015). Retrieved from: http://www.gks.ru/wps/wcm/connect/rosstat_main/rosstat/ru/statistics/accounts/
RUPEC information and analytical center. (2017). Share of FEC in GDP. Retrieved from: http://www.rupec.ru/download.php?url=%2Fupload%2Fiblock%2Fd32%2Fd3272416ed0b414ecd7cd95f51c1b2a9.pdf
RD 153-39-007-96. (2009). Regulations for drawing up design technological documents for the development of oil and gas and oil fields. Omega-L, pp. 121.
Somov G.R. (1991). The project for the development of the Saigatinsky license area. Surgut, pp. 234
Terekhov L.P. and Antonyan L.A. (2006). Optimization of costs for oil production. The Economy of Russia: XXI century, 20: 19-20.
State Corporation “Bank for Development and Foreign Economic Affairs (Vnesheconombank)”. (2008). Retrieved from: http://www.veb.ru/common/upload/files/veb/analytics/macro/pr201608_1.pdf
1. Federal State Budget Educational Institution of Higher Education “Industrial University of Tyumen”/ IUT, 625000, Urals Federal district, Tyumen region, Tyumen, Volodarskiystreet 38. Email: linvika@ya.ru