![]() ISSN 0798 1015
ISSN 0798 1015

![]() ISSN 0798 1015
ISSN 0798 1015
Vol. 39 (Number 16) Year 2018 • Page 41
Galiya JAXYBEKOVA 1; Aliya NURGALIYEVA 2; Azhar NURMAGAMBETOVA 3; Nazira GUMAR 4; Altynai ASANOVA 5
Received: 28/02/2018 • Approved: 05/03/2018
ABSTRACT: The paper considers innovation instruments for second-tier banks’ liquidity risk evaluation and management. The authors studied the main notions and definitions of the liquidity risk evaluation given by the present domestic and foreign scholars, the elements of the liquidity risk management process which consists of five stages. The basic factors of bank liquidity risk were identified. These figures show changing interconnection between bank risks and represent a report on the financial position of the research target. The authors worked out a factor model for liquidity risk evaluation where the authors used the changing structure of assets and liabilities of the researched second-tier bank of Kazakhstan as factors and the authors identified the liquidity risk evaluation instruments to implement the liquidity risk model. The factor model will make decisions on liquidity risk management more feasible. |
RESUMEN: 1012/5000 El documento considera los instrumentos de innovación para la evaluación y gestión del riesgo de liquidez de los bancos de segundo piso. Los autores estudiaron las principales nociones y definiciones de la evaluación del riesgo de liquidez brindadas por los académicos nacionales y extranjeros actuales, los elementos del proceso de gestión del riesgo de liquidez que consta de cinco etapas. Se identificaron los factores básicos de riesgo de liquidez bancaria. Estas cifras muestran la interconexión cambiante entre los riesgos bancarios y representan un informe sobre la posición financiera del objetivo de investigación. Los autores elaboraron un modelo de factores para la evaluación del riesgo de liquidez donde los autores utilizaron la estructura cambiante de los activos y pasivos del banco de segundo piso de Kazajstán investigado como factores y los autores identificaron los instrumentos de evaluación del riesgo de liquidez para implementar el modelo de riesgo de liquidez. El modelo de factores hará que las decisiones sobre la gestión del riesgo de liquidez sean más factibles. |

Under current economic conditions, any organization sees its efficient risk management as an important issue to provide its financial stability. Risk management is very significant in the banking sector because instability of the global economy and crisis in some euro-zone countries in the recent years clearly demonstrated the interconnection between various types of risks in the banking sector. It is the reason why the authors must not consider such risks separately but as a single system. One of the main banking risks is the liquidity risk which means a bank’s inability to fulfill its timely and full debt and financial obligations, including future ones. Nowadays, the global experience shows that analysis and timely evaluation of liquidity risk are key issues in the banking risk management.
Today, there is no model for the banking liquidity risk evaluation which would use as factors not only changing structure of assets and liabilities but other risks (exchange risk, interest risk, repayment risk) which influence this structure. This model will enable to make more feasible decisions on liquidity risk management. These reasons justify the relevance of the research, the need to study the processes related to the banking liquidity risk, choose an appropriate data analysis method, work out a liquidity risk evaluation model and program instruments for implementation.
To work out a banking liquidity risk evaluation model seeking to improve the existing methods of risk management.
This purpose justifies the following objectives:
1. to identify the banking liquidity risk factors which take account of the figures which show the changing interrelated banking risks and reflect the financial statement;
2. to work out a banking liquidity risk evaluation model for taking account of the influence of revealed risk factors;
3. to work out program instruments for liquidity risk evaluation which would implement the risk evaluation model.
Forte Bank JSC – a second-tier bank.
Banking liquidity risk evaluation via the analysis of the dynamics of bank’s assets and liabilities.
The theory is based on the works of domestic and foreign specialists in financial mathematics, system analysis, mathematical statistics, economic and mathematic modeling, banking risks. The paper considers the following methods: ratio analysis, GAP-analysis and methods based on scenario modeling.
Materials of periodicals and electronic literature on risk management, files of scientific conferences, published data by information agencies, statistical data from RK’s National Bank and Forte Bank JSC.
The worked out model, the program instruments may be used by any financial institution because of their high adaptability to the risk management requirements under the conditions of dynamic change of the internal and external environment. The results obtained will enable to decrease possible financial losses of the bank owing to the full and timely fulfillment of its obligations.
The study has the following results:
1. Revealed the liquidity risk factors simultaneously taking into account: the figures reflecting the other changing interrelated banking risks; the figures characterizing the bank’s balance sheet; the short-term liquidity ratio; the net stable funding ratio.
2. Worked out program instruments for the bank’s liquidity risk evaluation. In order to further implement the bank’s liquidity risk evaluation model, the elements of the management process, sequence and interconnection between sub-processes will be considered.
3. Worked out the risk evaluation model for the bank’s deposits outflow. This model will enable to increase evaluation accuracy of that risk due to the bank’s non-fulfillment of its obligations. It will help to make more feasible decisions related to liquidity management.
In the present period of risk management development, there are some various definitions of risk. Each social life area has different approaches to define this notion and its boundaries. In spite of some expected favorable financial effect, the risk is inextricably bound up with probable material loss which can be caused by an unfavorable decision or circumstances, such as changes in market conditions or force majeure.
The Encyclopaedical dictionary on finance and economics under the editorship of Prof. Gryaznova gives several interpretations of the notion “risk”: 1) adverse effect event probability; 2) danger of contingent loss, receiving less profits than due (Encyclopaedical dictionary on Finance and Credit, 2005, p. 845).
The Contemporary economic dictionary under the editorship of Rayzberg, Lozovsky, Starodubtseva interprets “risk” as “danger of unforeseen loss of expected profit, income or property, monetary funds due to a random change in the economic activity conditions, unfavorable circumstances” (Rayzberg, Lozovsky and Starodubtseva, 2006, p. 312).
This suggests that risk can be understood as the probability of unfavorable event with danger of loss of any resources or some damage to an economic entity.
According to a team of authors headed by Lavrushin, “risk” means “a situational characteristics of the activity of any manufacturer, including a bank, which reflects the uncertainty of outcome and probable unfavorable effects in case of failure, or favorable effects in case of success” (Lavrushin, Mamonova and Valentseva, et al., 2006, p. 59).
As for liquidity risk, Kostyuchenko thinks that the liquidity risk means a risk of loss caused by inappropriate repayment periods of assets and liabilities. Such loss can cover shortfall in profit due to the diversion of resources to support liquidity (Kostyuchenko 2010, p. 31).
A commercial bank’s liquidity represents a probable use of its asset as cash resources or prompt conversion into cash, and an asset’s capability to keep its nominal value permanent. Problems related to liquidity management in commercial banks are important issues considered by any bank. If force majeure makes a bank incapable of providing liquidity, the bank can become bankrupt (Jaxybekova and Nurgaliyeva, 2015).
Shapkin discloses the essence of the liquidity notion as the bank’s capability to fulfill its debt and financial liabilities in due time and in full to all the clientele. According to him, the notion “liquidity” is closely connected with the illiquidity risk when the bank cannot pay money to its clients promptly if they gave their money to the bank for a short time (Shapkin, n. d., p. 232).
Kadzhayeva and Dubrovskaya consider the liquidity risk as a danger of loss due to the credit institution’s incapability to fulfill its liabilities in full. The liquidity risk is caused by the imbalance between financial assets and financial liabilities of a credit institution (Kadzhayeva and Dubrovskaya 2008, p. 34).
The liquidity risk management issues are important for Kazakhstani banks because the liquidity is the key characteristics of any bank and is constantly exposed to risks. The bank’s strategy on liquidity risk management is to collect liquidity assets for meeting customers’ demands and purchasing assets in the capital market if the demand for them suddenly appears (Nurgaliyeva 2016).
By reference to the liquidity risk definitions in the international practices, the system of risk management must represent a complex of methods of banking liquidity prediction and regulation which would assist to reveal in time the current and future liquidity deficiency/surplus, various influencing factors, and therefore, to undertake prompt measures to change the bank’s liquidity situation in appropriate periods.
The analysis of the works in banking risk management within the framework of this research, the authors revealed the main stages of the liquidity risk management process. In order to implement the banking liquidity risk evaluation model, the authors start with the elements of the liquidity risk management process, the sequence and synergies between the separate sub-processes. The banking liquidity risk management process consists of the following stages (Figure 1):
Figure 1
The banking liquidity risk management process
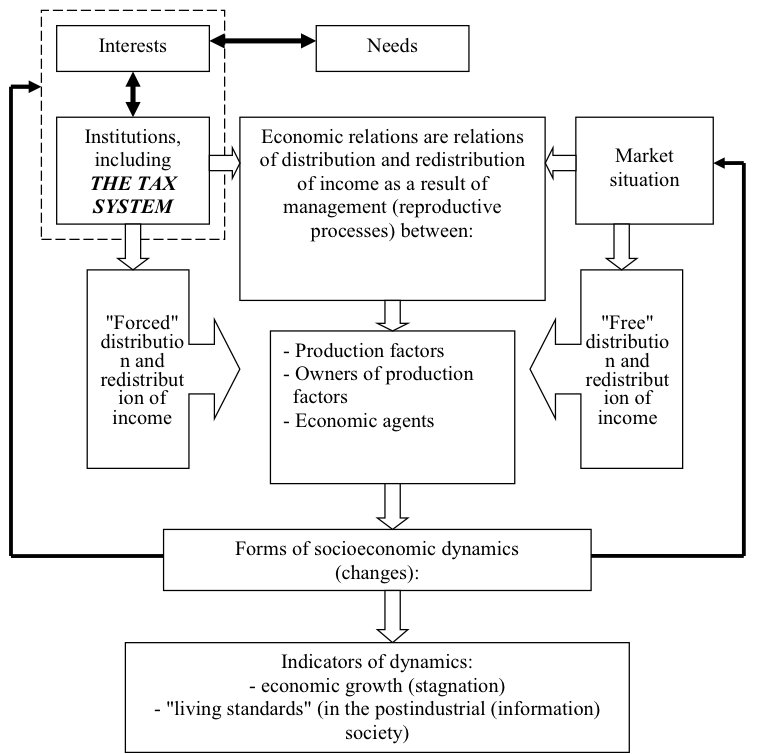
Note: based on (Fedorov 2013)
The first stage covers accumulation of relevant information and analysis for further evaluation of the liquidity risk. This stage stipulates the following actions to:
identify risk factors;
identify the sources with relevant information on the factors influencing the risk level.
The information sources for risk events probability are: automated banking systems, economic institutions which predict the market behavior, rating agencies which evaluate reliability and stability of participants of foreign economic activity, and state regulators.
The second stage analyzes all available information on the liquidity risk, evaluates its completeness and reliability. The purpose of this stage is to reveal all potential liquidity risk factors and further formal characterization.
While revealing the banking liquidity risk factors, it is necessary to make the following actions to:
- identify all factors which can impact the liquidity risk level;
- identify the banking operations which can cause risk events;
- identify a list of the objects to be analyzed.
All the above-mentioned actions require to:
- identify the risk zone boundaries;
- make analysis of operational data containing any information impacting the risk level;
- make analysis of effects and identify the impact level of factors on the liquidity risk.
The risk evaluation stage is very significant for liquidity risk management. At the stage of the banking liquidity risk evaluation, the values are formed to characterize the impact degree during a risk event. The purpose of such evaluation is to substantiate efficient allocation of liquidity funds for the structure of active and passive transactions, to coordinate risk control which implies the absence of breach of obligations. To recognize the impact on the deposits liquidity risk, it is necessary to analyze the data on deposits and other accounts containing the information on closing, and on this basis to identify the figures which enable to build a model by means of the mathematical statistics methods.
The authors will now evaluate the composition and structure of the assets and liabilities of Forte Bank JSC starting with the liabilities analysis and pay attention to deposits of the bank researched (Figure 2). Then the authors will make 5 years’ dynamics analysis.
Figure 2
Analysis of the composition and structure of liabilities of Forte Bank JSC in 2010-2014
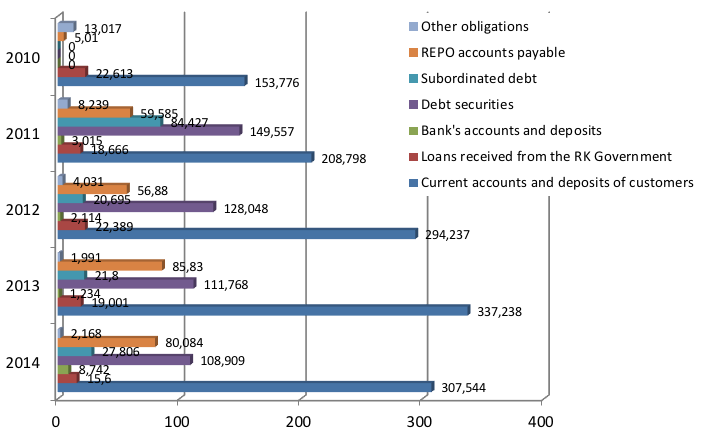
Note: based on the reported data by Forte Bank JSC within 2010-2014 (Web site of Forte Bank JSC.)
Based on the analysis of the composition and structure of the liabilities of Forte Bank JSC for the last 5 years’ period, one can say that the largest liability portion covers the customers’ current accounts and deposits. One can see the dynamics growth during 5 years, though compared to 2013, there is a decrease by almost KZT 30 million.
The least liability portion covers other liabilities and makes KZT 2.168 million.
The accounts and deposits of the bank in 2014 amounted to KZT 8.742 million and increased by 7 times compared to 2013. The liabilities of Forte Bank JSC in 2014 are shown in Figure 3:
Figure 3
Analysis of the liabilities of Forte Bank JSC in 2014
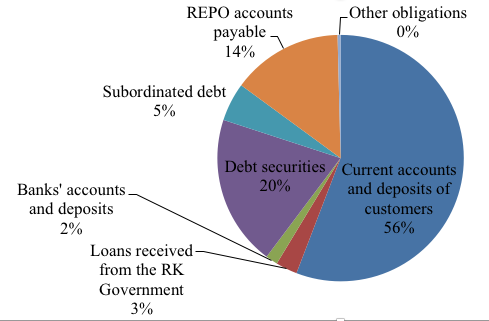
Note: based on the reported data by Forte Bank JSC in 2010-2014 (Web site of Forte Bank JSC)
The current accounts and deposits of the clients make the largest liability portion of the researched bank (56%) followed by debt securities (20%) and repo accounts payable (14%).
The authors will consider the figures which show probable closing of a deposit account as risk factors. Investigating the liability structure of the deposit transactions of Forte Bank JSC, the authors can see the following groups: retail and corporate deposits (enterprises, organizations), and division of the individuals’ deposits and the deposits of enterprises and organizations by periods: short-term and long-term.
In the structure of deposits, the authors can identify such a notion as accounts of enterprises and organizations which can be understood as corporate accounts with finance and credit bodies depending on their legal nature, cashless settlements forms and other factors. As for individuals, their accounts must be understood as the funds kept at the bank on demand. In this research, different types of accounts were combined into one notion “accounts”. The liability structure shows two groups of funds: those attracted by the bank and other liabilities comprising various funds. The specific feature of the attracted bank’s funds is that their major portion is deposits, and their minority consists of non-depository sources. The authors researched the following deposits: deposits of individuals, deposits of enterprises and organizations. The average volume of the attracted deposits of the bank in 2014 made more than 68%, and the total made more than KZT 513.559 million, total liabilities – KZT 745.163 million. In the structure of the deposits, the largest liabilities are the deposits of enterprises and organizations – 41.92%, which amounts to KZT 312.353 million, fixed-term deposits – 32.12% (KZT 239.352 million). The dynamics of the deposits’ structure over the period 2010-2014 are displayed in Table 1:
Table 1
Structure of deposits of Forte Bank JSC in 2010-2014, KZT, million
Type of deposit |
2014 |
2013 |
2012 |
2011 |
2010 |
1 |
2 |
3 |
4 |
5 |
6 |
Individuals’ deposits |
|||||
Current accounts and deposits on demand |
18.785 |
12.276 |
11.502 |
8.712 |
7.292 |
Fixed-term deposits |
177.687 |
147.273 |
142.728 |
102.055 |
67.533 |
Guarantee deposits |
4.734 |
1.554 |
2.296 |
2.105 |
2.044 |
Total individuals’ deposits |
201.206 |
161.103 |
156.526 |
112.872 |
76.869 |
Deposits of enterprises and organizations |
|||||
Current accounts and deposits on demand |
56.122 |
28.180 |
42.830 |
47.135 |
42.303 |
Fixed-term deposits |
239.352 |
117.003 |
136.957 |
130.949 |
88.756 |
Guarantee deposits |
16.879 |
1.258 |
0.925 |
3.281 |
0.870 |
Total deposits of enterprises and organizations |
312.353 |
146.441 |
180.712 |
181.365 |
131.929 |
Total deposits of enterprises |
513.559 |
307.544 |
337.238 |
294.237 |
208.798 |
Note – based on the reported data by Forte Bank JSC(Web site of Forte Bank JSC) |
|||||
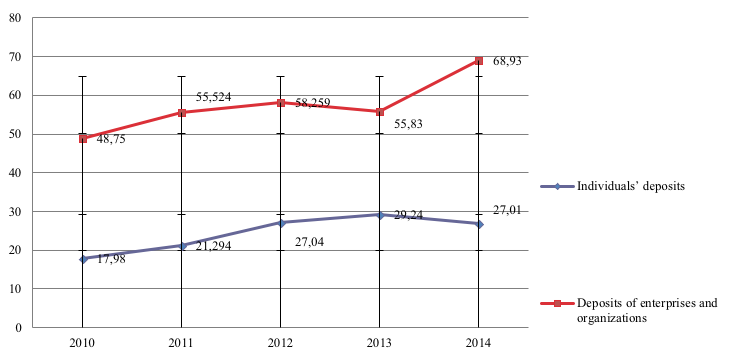
Figure 4 shows the dynamics of basic deposits of Forte Bank JSC within 2010 - 2014 in million tenge.
Figure 4
Dynamics of basic deposits of Forte Bank JSC in 2010-2014
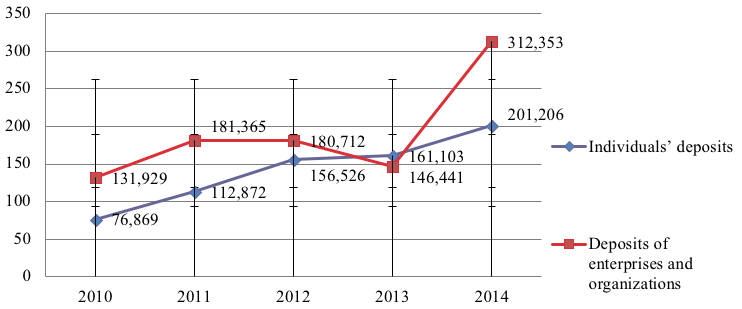
Note: based on the reported data by Forte Bank JSC in 2010-2014 (Web site of Forte Bank JSC)
A sharp increase of deposits of enterprises and organizations as well as private customers in 2014 can be seen compared to the previous period. This fact argues for a good performance of the bank focused on deposits attraction, improvement of deposit terms and conditions. Deposits in 2014 made KZT 513.559 million, that is more than 2.5 higher than in 2010.
Table 2
Shows the key figures of liability deposits of Forte Bank JSC in 2010-2014 (of the total liabilities), %
Type of deposit |
2014 |
2013 |
2012 |
2011 |
2010 |
Individuals’ deposits |
|||||
Current accounts and deposits on demand |
2.52 |
2.22 |
1.99 |
1.644 |
1.71 |
Fixed-term deposits |
23.85 |
26.74 |
24.66 |
19.26 |
15.79 |
Guarantee deposits |
0.64 |
0.28 |
0.39 |
0.39 |
0.48 |
Total individuals’ deposits |
27.01 |
29.24 |
27.04 |
21.294 |
17.98 |
Deposits of enterprises and organizations |
|||||
Current accounts and deposits on demand |
7.53 |
5.12 |
7.399 |
8.9 |
9.89 |
Fixed-term deposits |
32.12 |
21.24 |
23.66 |
24.71 |
20.76 |
Guarantee deposits |
2.27 |
0.23 |
0.16 |
0.62 |
0.12 |
Total deposits of enterprises and organizations |
41.92 |
26.59 |
31.219 |
34.23 |
30.77 |
Total deposits of enterprises |
68.93 |
55.83 |
58.259 |
55.524 |
48.75 |
Note – based on the reported data by Forte Bank JSC in 2010 – 2014 (Web site of Forte Bank JSC) |
|||||
The diagrams of changing key figures in million tenge and % of the total volume in relation to the group of the liabilities are similar. The dynamics of the key figures of the banks’ deposits in % of the total liabilities is seen in Figure 5:
Figure 5
The dynamics of changing key figures of the deposits in the liabilities of Forte Bank JSC in 2010-2014
Note: based on the reported data by Forte Bank JSC in 2010-2014 (Web site of Forte Bank JSC)
The analysis of the dynamics of the composition and structure of the assets of Forte Bank JSC in 01.01.2010-01.01.2014 is made in Table 3 and Figure 3:
Table 3
The structure of assets of Forte Bank JSC in 01.01.2010-1.01.2014
(million tenge)
Figures |
01.01.2014 |
01.01.2013 |
01.01.2012 |
01.01.2011 |
01.01.2010 |
1 |
2 |
3 |
4 |
5 |
6 |
ASSETS |
|||||
Accounts and deposits with bank |
197 |
329 |
184 |
700 |
2.702 |
Derivative instruments measured at fair value |
4.7
|
14.695
|
20.101
|
21.716
|
16.369
|
Loans to clients |
307.818 |
388.930 |
328.784 |
251.827 |
243.707 |
Available-for-sale financial assets |
118.811 |
121.222 |
115.803 |
102.199 |
- |
Fixed assets and intangible assets |
19.618 |
21.150 |
22.233 |
23.100 |
97.657 |
Current tax asset |
71 |
81 |
68 |
1.123 |
919 |
Deferred tax asset |
- |
17.954 |
17.912 |
- |
25.012 |
Other assets |
8.476 |
8.505 |
8.310 |
7.928 |
17.340 |
Total assets |
475.768 |
590.009 |
529.888 |
427.584 |
419.094 |
Note – based on the reported data by Forte Bank JSC within 2010-2014 (Web site of Forte Bank JSC) |
|||||
The structure of assets of Forte Bank JSC as on 01.01.2014 is as follows:
Figure 6
Analysis of the asset structure of Forte Bank JSC as on 01.01.2014
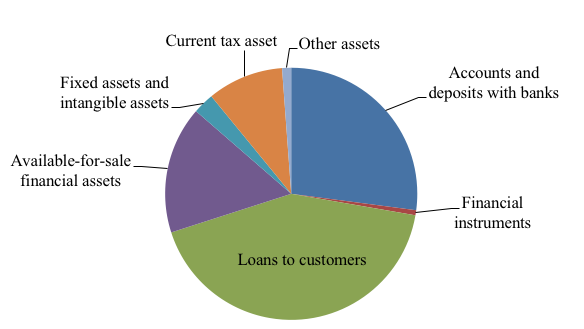
Note – based on the reported data by Forte Bank JSC in 2014 (Web site of Forte Bank JSC)
The largest portion of the bank’s assets covers the loans granted to clients (42%), followed by accounts and deposits. The least portions comprises the derivative instruments and other assets, each being 1%.
The dynamics of the asset structure for 5 years’ period
in Forte Bank JSC is considered in Figure 7:
Figure 7
Analysis of the dynamics of the asset structure in Forte Bank JSC within 2010-2014
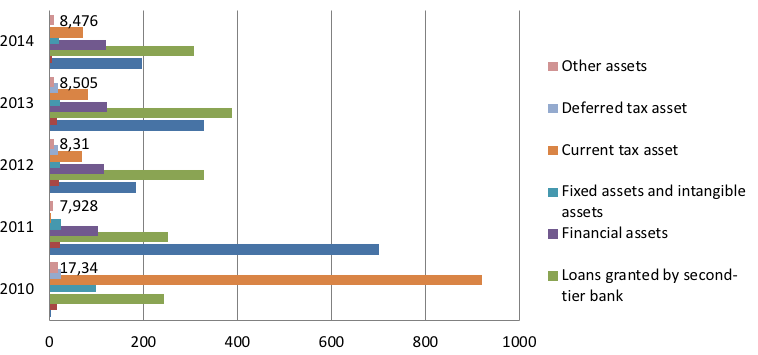
Note: based on the reported data by Forte Bank JSC in 2010-2014 (Web site of Forte Bank JSC)
As one can see from Figure 7, the current tax asset decreased by almost 13 times from KZT 919 million in 2010 to KZT 71 million in 2014.
The loans granted by the second-tier bank within the 5 years’ period are the same amount, with small deviations. The largest amount of the granted loans in 2013 was KZT 388.930 million. The fixed and intangible assets sharply decreased in 2011 by almost 4 times, and have not changed since that time to the present day.
The prudential standards of Forte Bank JSC for liquidity in the current year meet the requirements of the National Bank of the Republic of Kazakhstan.
The above analysis of assets and liabilities shows that their structure can be changed by risk factors which can negatively affect the attracted funds and market instruments, impeding timely fulfillment of the obligations.
Taking into account the international practice in relation to the liquidity risk management, the documents regulating banking activities, the recommendations of Basel Committee on Banking Regulations and Supervisory Practices, it is proposed to use not only the indicators which characterize the bank’s assets and liabilities structure, but also the indicators of other banking risks linked up with the bank’s liquidity risk. These factors can be divided into two groups: external factors and balance sheet figures.
The external factors cover other risks from the banking risks structure. Depending on their peculiarities, these risks can be divided into two groups: quantitative and price-related. The scheme of risks impact is displayed in Figure 8 (Altman 2013).
Figure 8
Risks which impact the bank’s liquidity level
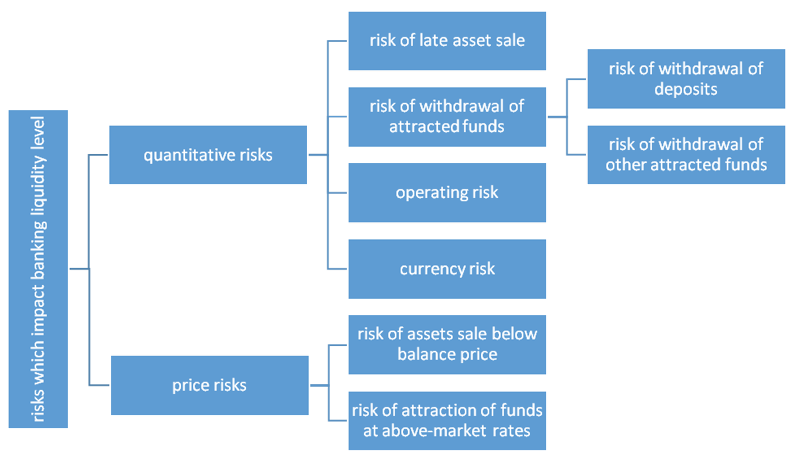
Note: based on (Altman, 2013; Jorion, 2006).
As external indicators which impact liquidity risk the authors chose the following:
r1 – the risk level of withdrawal of deposits;
r2 – the risk level of asset sale below balance sheet price;
r3 – the risk level in case of diminution in value of a part of the creditor’s assets. They are characterized by probable loss due to the diminution in value of the loan portfolio;
r4 – the currency risk level characterized by a probable sharp change in currency rates;
r5 – the risk level of withdrawal of other funds;
r6 – the risk level of allocation of large liquidity surplus at a rate below mid-market;
r7 – the risk level of late payment of debt and interest thereupon due to the partial or complete incapability of a party to fulfill its pecuniary obligations to the creditor;
r8 – the operating risk level characterized by error operations or failures in the banking processes.
Quantitative risks are characterized by direct influence on the structure and volumes of the bank’s incoming and outgoing payments.
From now on, a part of the risk factors will be decomposed for more accurate identification of the risk reasons.
For instance, the risk of withdrawal of funds is considered as consisting of the risk of withdrawal of deposits and the risk of repayment of other funds due to the great difference between deposits and other funds in the liabilities structure of the researched bank. Price risks impact the liquidity due to the unfavorable change in market prices of financial instruments which are a part of the bank’s assets and liabilities (Risk Management and Financial Institutions, 2009).
Each of the indicators is calculated by the internal banking methodology based on the modified, widely used risk evaluation methods (Value at Risk, Risk Metrics and others). However, in the authors’ opinion, the risk evaluation model used by the bank in relation to the attracted and deposit funds does not meet the current demands of the bank. This model is based on the probability estimate method which enables to evaluate the withdrawal risk of attracted and deposit funds more simply and statistically by calculating the percentage of fulfilled and unfulfilled decisions of the total decisions taken.
As the indicators reflecting the balance sheet structure, it is suggested to use the coefficients which characterize the liquidity situation. As the bank’s liquidity is directly related to time, these coefficients must be distributed in accordance with time periods. The authors suggest using NSFR and LCR coefficients which are, in essence, the indicators of short-term, medium-term and quick liquidity. These indicators may be displayed as follows (Passioned Group. ETL-tools and Data integration, 2013):
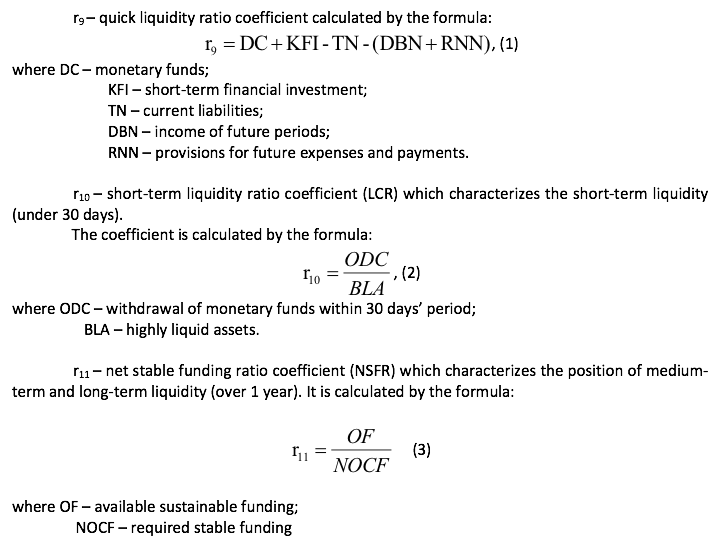
Highly liquid assets can be divided into two groups which have different weighted coefficients (Delmon 2009):
1) cash funds, publicly traded government stock (weighted coefficient – 1);
2) 20% risk weighted assets of governments, central banks, government enterprises, bonds of enterprises and bodies having rating АА- and higher (weighted coefficient – 0.85).
Stable funding means the aggregate financial instruments and liabilities which represent reliable sources of funds for more than 1 year’s period. The values of the identified risk factors calculated by methods available in each bank or by means of the NBRK’s methodology are used for the creation of the liquidity risk evaluation model. However, the current published researches on banking risk management contain no risk evaluation model for outflow/withdrawal of deposit funds. For this reason, the authors suggest to work out the model which enables to get more accurate figures of this risk. It is important for further building of the liquidity risk evaluation model.
In order to create such model, the authors suggest using 4-stage process (Figure 9):
Figure 9
Scheme of the creation of the banking liquidity risk evaluation model
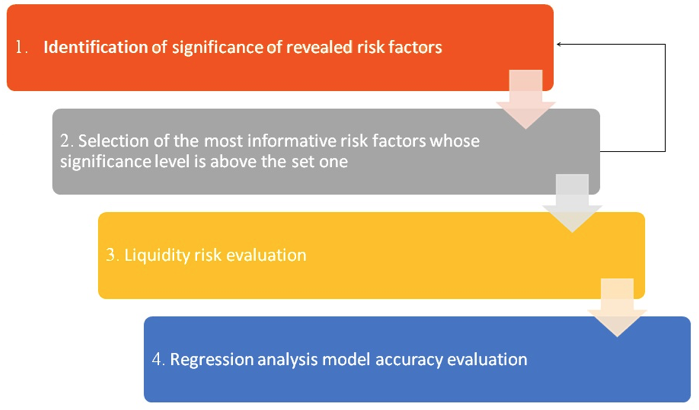
Note – compiled by the authors
The stages go one by one but an iterative return to a previous stage can occur. For instance, if at the stage of selection of the most informative risk factors, one rejected those with the significance level being not sufficient, then one must pass the stage of significance identification again to improve the accuracy of the model (Goіng global: the world of publіc-prіvate partnershіps, 2007).
In order to get the data which would describe the processes of an economic entity in the most accurate way, it is necessary to identify the current interrelationships. This approach requires the identification of really existing regularities. The really existing regularities represent such relation between the processes when change in one of them will influence the others. Not all the risk factors presented equally impact the risk level, so at the second stage, one must identify the significance of the risk factors. The selection of the method to check the relation between the liquidity risk value (Y) and the vector (X), where Xi – risk factors values, depends on what scale these factors were calculated in:
In the considered case, Y and Xi are measured in the quantitative scale, so the last method was chosen. The considered vector of the risk factor values follows the normal probability law. Therefore, it is necessary to use the correlation analysis to identify the relation between the liquidity risk value Y and the risk factor Xi (Yoshіakі 2010).
The liquidity risk benchmark data calculated by the methods available in the bank as well as the other risks which impact the liquidity risk identified earlier will be considered now. The benchmark data are those on the activity of Forte Bank JSC which is one of the too-big-to-fail banks. Some data used within the framework of this research were partially distorted in view of the mandatory compliance with the Act of the Republic of Kazakhstan “On Banks and Banking Activities in the Republic of Kazakhstan” and the regulations on non-disclosure of confidential information. However, the ratio between the key figures of the risk factors and the structure of assets and liabilities of the bank correspond to the real data. In order to improve the accuracy of the model, the authors suggest using the past two years’ values with three months’ spacing.
In order to make the analysis of the linear dependence between the liquidity risk and each of the risk factors and to evaluate the mutual influence of the risk factors, the authors suggest using the matrix of paired correlation coefficients R.
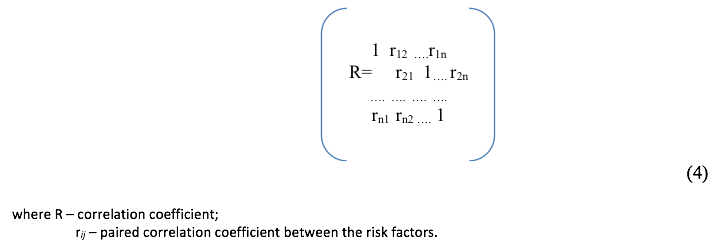
The paired correlation coefficient fluctuates within [-1;+1]. The closer the correlation coefficient to +/-1, the higher the dependence between the indicators. If the correlation coefficient takes on a value of +/-1, then
a functional relation exists between the indicators, but if 0, there is no linear relation. The matrix of the paired correlation coefficients for the bank’s liquidity risk is presented in Table 4:
Table 4
Matrix of the paired correlation coefficients
|
y |
r1 |
r2 |
r3 |
r4 |
r5 |
r6 |
r7 |
r8 |
r9 |
r10 |
r11 |
y |
1 |
0.83 |
0.75 |
0.76 |
0.35 |
0.04 |
0.63 |
0.66 |
0.05 |
0.53 |
0.57 |
0.45 |
r1 |
0.83 |
1 |
0.08 |
0.10 |
0.46 |
0.78 |
0.15 |
0.16 |
0.27 |
0.04 |
0.09 |
0.02 |
r2 |
0.75 |
0.08 |
1 |
0.67 |
0.58 |
0.15 |
0.98 |
0.45 |
0.18 |
0.07 |
0.02 |
0.13 |
r3 |
0.76 |
0.10 |
0.67 |
1 |
0.55 |
0.09 |
0.72 |
0.93 |
0.12 |
0.05 |
0.05 |
0.04 |
r4 |
0.35 |
0.46 |
0.58 |
0.55 |
1 |
0.39 |
0.28 |
0.32 |
0.04 |
0.12 |
0.13 |
0.10 |
r5 |
0.04 |
0.78 |
0.15 |
0.09 |
0.39 |
1 |
0.18 |
0.23 |
0.07 |
0.09 |
0.12 |
0.07 |
r6 |
0.63 |
0.15 |
0.98 |
0.72 |
0.28 |
0.18 |
1 |
0.55 |
0.09 |
0.13 |
0.08 |
0.08 |
r7 |
0.66 |
0.16 |
0.45 |
0.93 |
0.32 |
0.23 |
0.55 |
1 |
0.12 |
0.17 |
0.13 |
0.05 |
r8 |
0.05 |
0.27 |
0.18 |
0.12 |
0.04 |
0.07 |
0.09 |
0.12 |
1 |
0.04 |
0.07 |
0.09 |
r9 |
0.53 |
0.04 |
0.07 |
0.05 |
0.12 |
0.09 |
0.13 |
0.07 |
0.55 |
1 |
0.55 |
0.63 |
r10 |
0.57 |
0.09 |
0.02 |
0.05 |
0.13 |
0.12 |
0.08 |
0.13 |
0.07 |
0.55 |
1 |
0.70 |
r11 |
0.45 |
0.02 |
0.13 |
0.04 |
0.10 |
0.07 |
0.08 |
0.05 |
0.09 |
0.63 |
0.70 |
1 |
Note – compiled by the authors |
||||||||||||
Building the matrix of the paired correlation coefficients, the authors discovered that the liquidity risk is the closest to the risk of deposits withdrawal, the credit risk and the risk of asset sale under balance sheet price. However, the interconnection between the risk factors is close enough. For instance, there is a functional dependence between the risk of asset sale under balance sheet price (r2) and the risk of allocation of great liquidity surplus at the rates under mid-market (r6)-r2r6=0.96, and in addition, the credit risk (r3) and the risk of diminution in value of a part of assets (r7)-r3r7=0.93. The influence of the operating risk (r8) and the risk of withdrawal of other funds (r5) on the liquidity risk is not significant and makes 0.03 и 0.05, respectively. Upon the identification of the availability of statistically significant relations between the factors and the level of the bank’s liquidity risk, it is necessary to mathematically describe the type of dependences using the regression analysis.
While using the regression analysis it is necessary to apply the multiple regression model, which can help to build a model with a large number of factors identifying the influence of each of them on the indicator(s) modeled.
It can be presented as follows:
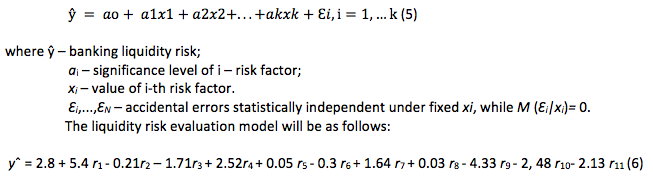
One can see from the regression equation that not all the coefficients are statistically significant, while the economic interpretation of the reverse influence of a part of the risk factors cannot be economically substantiated.
In order to improve the reliability of the model, the composition of risk factors must be changed by excluding those which bear no significant information and cannot add to the information contained in the factors. Therefore, at the second stage of the modeling, one can suggest selecting the risk factors having their significance below the set level. According to the expert opinion of the bank’s risk department, for simplicity, one cannot take into account those risk factors with significance lower a particular level which do not impact materially the liquidity risk.
If not all risk factors are significant, one must work out a new equation without insignificant regressions. Then the model comes to the second stage. A new iteration takes place. The next stage can be possible only when all selected factors are significant for the model. Within this research, one can suggest using a lower threshold level of risk factor significance higher than 0.05 for building the model. As a result, the further calculations will not take into account the operating risk and the risk of outflow of other funds. Bearing in mind the close interrelationship between the risk of diminution in value of a part of the creditor’s assets and the risk of late payment of debt and interest thereupon by a borrower, one can suggest to include only one of them into the further model of liquidity risk evaluation. Such decision can be substantiated by the fact that during economic interpretation one can make a conclusion that the mentioned factors represent the reflection of the credit risk.
Therefore, it is advisable to leave that of the factors which has larger impact on the liquidity risk (p3), implying the credit risk. Similarly, the factors can be presented as the price risk because the authors revealed the close relationship between the risk of asset sale below balance sheet price and the risk of allocation of great liquidity surplus at the rates below mid-market.
In order to do the further analysis, the authors identified the risk factors which have sufficiently close relationship with the bank’s liquidity risk figures. In addition, the authors generalized the factors which mutual relationship strength was close to the functional, namely: the risk of withdrawal of deposits, the risk of unbalanced assets and liabilities transactions by terms, the market risk, the currency risk, the price risk.
Multiple determination R2=0.83 shows the model adequacy, and t-statistics criterion value exceeds the value for all coefficients of regression equation. It shows significance of all explicative variables of the model.
The worked out model of the banking liquidity risk evaluation enables to more truly predict the risk of the bank’s failure to fulfill its obligations. It will promote more reasonable decisions on liquidity management.
The authors revealed the liquidity risk factors simultaneously taking into account the indicators reflecting change in other banking risks; the indicators characterizing the bank’s balance sheet; short-term liquidity ratio; net stable funding ratio and worked out the model of the banking liquidity risk evaluation based on the revealed risk factors. The benefit of this model is simultaneous measurement of the figures of other banking risks and the figures characterizing the balance sheet structure.
Altman, E.I. (2013). Managing and Measuring Risk: Emerging Global Standards and Regulations After the Financial Crisis. World Scientific Publishing Company.
Delmon, J. (2009). Prіvate Sector Іnvestment іn Іnfrastructure: Project Fіnance, PPP Projects and Rіsk. The World Bank and Kluwer Law Іnternatіonal, pp. 230.
Encyclopaedical dictionary on Finance and Credit (2005). Moscow: Finance and Statistics, pp. 1168.
Fedorov, B.M. (2013). Risk evaluation of withdrawal of specific groups of banking attracted funds, Economics, statistics and computing science. Vestnik UMO, 5, 112-116.
Goіng global: the world of publіc-prіvate partnershіps. CBI. (2007). http://www.goingpublicexperts.com. (accessed date: 05.06.2017).
Jaxybekova, G.N. and Nurgaliyeva, A.M. (2015). Financial stability criteria of banks. Economics and contemporary management: theory and practice, 1 (45). http://cyberleninka.ru/article/n/kriterii-finansovoy-ustoychivosti-funktsionirovaniya-bankov (accessed date: 05.06.2016).
Jorion, P. (2006). Value at Risk: The New Benchmark for Managing Financial Risk. NewYork: McGraw-Hill Trade.
Kadzhayeva, M.R. and Dubrovskaya, S.V. (2008). Banking Operations. Moscow: “Academy” Publishing Centre, pp. 400.
Kostyuchenko, N.S. (2010). Analysis of credit risks. St. Petersburg: “Scythia” Publishing and Trading House, pp. 440.
Lavrushin, O.I., Mamonova, I.D. and Valentseva, N.I., et al. (2006). Banking Business: textbook. Moscow: KNORUS, pp. 768.
Nurgaliyeva, AM. (2016). Liquidity risk management policy at the second-tier banks of the Republic of Kazakhstan. Universum: Economics and Law: electronic scientific journal, 6 (27). http://7universum.com/ru/economy/archive/item/3244 (accessed date: 05.06.2016).
Passioned Group. ETL-tools and Data integration. (2013). Passionned Nederland B.V.
Rayzberg, A., Lozovsky, L.S. and Starodubtseva, Ye.B. (2006). Contemporary economical dictionary. Moscow: INFRA-M, pp. 495
Risk Management and Financial Institutions. (2009). New York: Wiley Finance
Shapkin, A.S. (n. d.). Economical and financial risks. Evaluation, management, investment portfolio: Monograph. Moscow: Publishing and Trading Corporation Dashkov & Co, pp. 544.
Web site of Forte Bank JSC. http://www.fortebank.com/ru/branch-network/branches (accessed date: 05.06.2017).
Yoshіakі, O. (2010). Іnterbank competіtіon and іnformatіon productіon: Evіdence from the іnterest rate dіfference. Journal of Fіnancіal Іntermedіatіon, 19.
1. Almaty Management University, 050060, Republic of Kazakhstan, Rozybakiev Street 227.
2. NARXOZ University, 050035, Republic of Kazakhstan, Almaty, Zhandosov Street 55; E-mail: aliya_mn@mail.ru
3. NARXOZ University, 050035, Republic of Kazakhstan, Almaty, Zhandosov Street 55.
4. Caspian public university, Kazakhstan, Almaty.
5. NARXOZ University, 050035, Republic of Kazakhstan, Almaty, Zhandosov Street 55.