![]() ISSN 0798 1015
ISSN 0798 1015

![]() ISSN 0798 1015
ISSN 0798 1015
Vol. 39 (Number 18) Year 2018 • Page 2
Asem Melsovna ASHIKBAYEVA 1; Nazira Anuarbekyzy GUMAR 2; Gaukhar Kaldanovna ZHANIBEKOVA 3
Received: 13/03/2018 • Approved: 13/04/2018
ABSTRACT: The specific features of the global market and modern traits of the global economy affect the strategy of such resource countries as Kazakhstan. Being one of the richest countries in the world in terms of its reserves of both non-renewable and renewable natural resources, the Republic of Kazakhstan remains a country with a resource-inefficient economy. The resource intensity of a GDP unit is 3-5 higher than that in Japan, USA and socially and technologically developed EU countries. Today’s Kazakhstan strategy is intended for further development of the oil and gas system of the country, supporting activities in forecasting and identifying new perspective oil and gas fields, their accelerated exploration, development and commissioning. Furthermore, the intensified globalization causes the environmental issue to aggravate globally, which places serious tasks in the area of the oil system. Similar to developed countries, Kazakhstan strives to reduce specific volumes of wastes (contaminating emissions) and their negative impact on the environment during all life cycle stages. |
RESUMEN: Las características específicas del mercado global y los rasgos modernos de la economía global afectan la estrategia de países con recursos como Kazajstán. Siendo uno de los países más ricos del mundo en términos de sus reservas de recursos naturales no renovables y renovables, la República de Kazajstán sigue siendo un país con una economía ineficiente en recursos. La intensidad de recursos de una unidad de PIB es 3-5 más alta que la de Japón, EE. UU. Y los países de la UE desarrollados social y tecnológicamente. La estrategia actual de Kazajstán está destinada a un mayor desarrollo del sistema de petróleo y gas del país, apoyando actividades de previsión e identificación de nuevos campos de petróleo y gas en perspectiva, su exploración acelerada, desarrollo y puesta en marcha. Además, la globalización intensificada hace que el problema ambiental se agrave globalmente, lo que coloca tareas serias en el área del sistema petrolero. Al igual que en los países desarrollados, Kazajstán se esfuerza por reducir los volúmenes específicos de desechos (emisiones contaminantes) y su impacto negativo en el medio ambiente durante todas las etapas del ciclo de vida. |

Crude oil refining at a refinery is one of the life cycle (LC) stages for a wide range of oil products. This LC includes crude oil production, its field preparation for transportation, mains transport (pipelines, tankers, railroad, etc.), refining at refineries and oil-chemical synthesis facilities, provision of oil products to consumers, consumption of these products, and management of wastes (solid, liquid, steam and gaseous, mixed) formed during each of these stages. A comprehensive cost-effectiveness (CE) analysis of environmental protection (EP) against the negative impact of the oil sector, first of all, requires switching from the impact characteristics of oil products on individual components of environment to integrated (comprehensive) evaluation of their impact and, secondly, switching from assessing their negative impact at individual LC stages of oil products to the evaluation of their impact during the entire LC. A comprehensive evaluation becomes extremely important when the LC of any group of oil products is concentrated within a region, since in this case, the evaluation bears both industry and regional load.
The environmental CE can be expressed in two forms:
- as a reduction in the volumes of regular payments compensating the regulatory damage caused to the environment by business activities and the volume of punitive sanctions compensating the extra-regulatory damage; as a rule, this reduction is caused by implementation of innovative design and process solutions resulting in reduced volumes of wastes and/or the reduced degree of their hazard for the environment at the stage of production and waste management;
- as acquiring income from selling the products obtained as a result of processing wastes, which earlier have been subject to destruction or disposal at dumps; in this case, the products to be sold are considered as by-products (additional products) and wastes are deemed to be feedstock to produce them, so that they don’t bear any negative impact on the environment anymore; at the same, the need to make payments to compensate damages related to existing wastes is abandoned.
The economic efficiency of environmental protection at a refinery can be expressed in both forms.
The foundation for comprehensive evaluations is individual indicators (IIs) reflecting the negative impact of business activity on the environment and the economic consequences (characteristics) of this activity at the level of basic sources of negative impacts – individual units of production equipment (process, transport, storage, service, energy, etc.) and individual production activities carried out using this equipment. A specific combination of basic sources forms a production cycle (flow, line, chain, etc.) whose intent and result is a product or a group of products. IIs and their quantitative characteristics make the EP CE comprehensive evaluation possible at the level of the production cycle with further serial integration of these evaluations at the level of enterprise, cluster, sub-branch and branch-specific sector of economy.
As an example, Fig. 1 shows an enlarged process flow diagram of a modern refinery (European IPPC Bureau at the Institute for Prospective Technological Studies, 2003) whose inlet is supplied with feedstock (crude oil) and whose output is the production activity results, several dozens of target individual oil products combined into eleven commodity groups. Bold lines highlight process and transport activities intended to produce one of such groups – a group of bitumens. The II formation methodology will be considered against the example of one of the activities within this group. Fig. 1 shows no wastes formed during individual production activities. As the requirements to stability of industrial production are getting higher, these wastes are more frequently considered as non-targeted production of production activity and management of such products – as a final stage of target products LC.
Figure 1
Enlarged process flow diagram of modern refinery
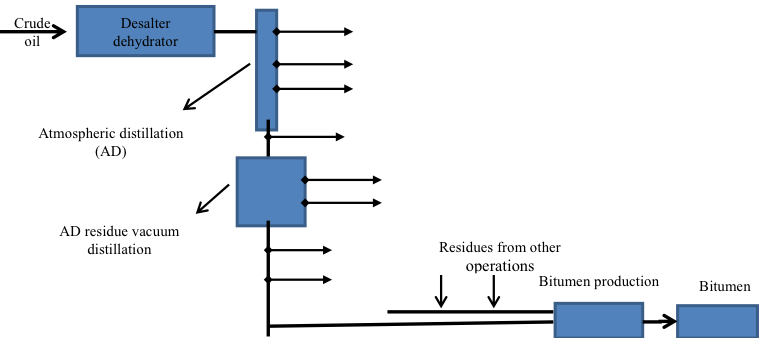
The bitumen production cycle includes:
- process operations of crude oil desalting/dehydration (DD), oil atmospheric distillation after DD, vacuum distillation of residue after atmospheric distillation, processing of vacuum distillation of residue and two other intermediate products into bitumens;
- inter-operational piping transport;
- power supply for process and transport operations;
- water supply of process operations;
- water removal of contaminated (waste) waters;
- neutralization of atmospheric emissions;
- formation and removal of wastes.
Figure 2 represents an enlarged process flow diagram of the DD process (European IPPC Bureau at the Institute for Prospective Technological Studies, 2003).
Figure 2
Enlarged process flow diagram of crude oil dehydration/desalination
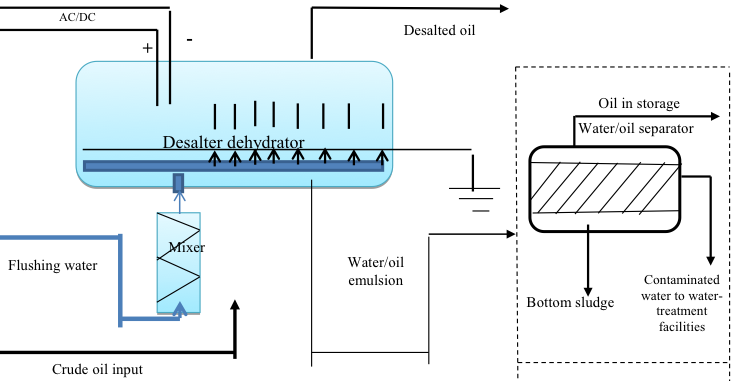
The primary unit implementing this diagram is a desalter dehydrator (D-D). An electrical field with an intensity of 1-5 kV/cm is generated inside the D-D using an array of paired electrodes and a grounded electrode. The action of this field and deemulsifiers injected into the D-D separates crude oil into DD oil and water oil emulsion. The emulsion is divided into the salted water and water-cut oil fractions. The oil fraction is returned to the crude oil storage, and the water fraction is discharged to water-treatment facilities. Particles of mineral products contaminating crude oil (sand, corrosion products, etc.) are removed as water/oil-containing bottom sludge. The physical and chemical processes taking place during DD and D-D operation modes are in details described in (European IPPC Bureau at the Institute for Prospective Technological Studies, 2003); Glagoleva & Kapustina 2007).
The primary types of negative impacts on the environment occurring during DD include:
- energy consumption (thermal energy – TE) for heating of the water/oil emulsion in the heat exchanger before its injection into the D-D; electrical energy (EE) to create an electrical field inside the D-D and power supply electrical engines;
- using flushing water (FW) from the refinery water reuse system to produce a water/oil emulsion at the D-D inlet;
- discharging contaminated water (CW) to water-treatment facilities;
- planned water losses;
- emergency losses of treated and contaminated water in case of pipeline ruptures, damages and destructions of vessels and valves supporting the DD operation;
- removal and disposition of sludge wastes (SW);
- removal of wastes formed during maintenance and repair of equipment;
- planned losses of crude and DD oil;
- emergency losses of crude and DD oil in case of pipeline ruptures, damages and destructions of vessels and valves supporting the DD operation;
- atmosphere contamination with vapors of volatile organic compounds (VOCs) contained in crude oil.
The highest negative environmental impact and at the same time the highest component of expenses for this operation (apart from feedstock cost) is energy and water consumption, formation of CW supplied to water-treatment facilities, SW removal and disposition. The primary quantitative gross indicators characterizing these flows from the viewpoint of EP and economy are as follows:
- TE: heating media (steam or hot water) amount, pressure and temperature at the inlet and outlet to the heat exchanger for crude oil heating, respectively, Mh.in. [t] or [m3], Ph.in. [Pa], T [K] and Mh.out. [t] or [m3], Ph.out. [Pa], Th.out. [K]; total amount of TE (J), including secondary one and that generated using renewable sources of energy;
- EE: installed equipment capacity Nel [kW]; EE share generated using renewable sources of energy;
- FW: amount, pressure, temperature, D-D inlet and outlet pH, indexation and type dimensions Mf.in./out – similar to TE;
- CW: temperature, composition and number of contaminants at the D-D outlet (to identify treatment facilities where the stream must be supplied to: municipal, offsite, special, local, and expenses related to CW treatment.
- SW (bottom sludge): formation rate, composition by primary components.
Quantitative gross indicators are determined using the readings of respective meters (instrumental metering) and are sufficiently reliable but provide no information in order to be deemed as an informational basis to form comprehensive EP EE indicators, the EP policy and to assess the economic efficiency of its implementation. To attribute informational content to gross indicators, they must be transformed into reduced (specific, rated) IIs. The list of reduced IIs necessary and sufficient to assess the EP EE for a production operation is determined using guiding documents developed by a number of international and national organizations (United Nations, 2003; National Round Table on the Environment and the Economy, 2002; Velikanova 1975). The recommendations in these documents have no regulatory nature and permit the list to be both expanded and reduced. As a basis for reduction, time units (hour, day, year), metering units for feedstock amount supplied to the operation (such as t/h of crude oil) or product amount yielded after operation (such as t/hour of oil DD), units of expenses for the operation (operational prime cost), such as Rubles, are used; the reduced indicators are regarded as absolute II values used to form comprehensive indicators. In case TE, EE, FW and CW hourly flow rates are known, as well as SW generation rates (Mcomp/h or m3comp/h) and the cost of these components at the inlet to the operation (expenses for CW treatment and SW disposition for CW and SW), RURcomp/h, the reduced IIs can be formed, such as RURcomp/h. These IIs reflect hourly expenses for the DD operation in terms of thermal/power energy, flushing water, and decontamination expenses for CW and SW. In these terms, they are components of such a production operation characteristic as the machine-hour cost. The traditional structure of a machine hour and the methodology to determine its price are given in (Velikanova 1975). Introducing indicators into this structure that represent negative environmental impact of the operation makes the machine-hour cost both a technical-economic and ecological-economic characteristic.
Now (Psareva 2003; Padalko & Psareva 2012) we must set up a comparison basis (CB) (comparison reference) for each of the reduced indicators; this basis permits: attributing qualitative and quantitative estimates to the values in relation to the CB: qualitative: at the reference level, higher, lower, etc.; quantitative: 1.5 higher/lower than CB; 75% of CB, etc.; tracking actual dynamics of indicators relative to the CB for the previous period (provided the systemic approach to acquiring quantitative indicators is employed) and forecasting such dynamics for short-term, middle-term and long-term perspective; taking correct management decisions based on the analysis of reasons for such dynamics.
The CB selection depends on several factors: tasks of the refinery or its corporative structure (hereinafter referred to as the refinery); the level of their social and technological development; initial evaluation of refinery assessment on the environment; environmental condition in the region where the refinery is situated; financial and intellectual resources available to the refinery; refinery capabilities in terms of acquiring or procuring information necessary to select the CB; a corporative regulatory basis stimulating the systematic work in setting up IIs, comprehensive indicators based on them and the EP EE in general.
As a CB, the following indicators can be considered:
- better or averaged for refineries included in the corporation and located within the region or its own country;
- those achieved by leading refineries in foreign social and technologically developed countries and published in regulatory updated guides Best Available Technics Reference Books (BREF) (European IPPC Bureau at the Institute for Prospective Technological Studies, 2003; European IPPC Bureau at the Institute for Prospective Technological Studies, 2006; European IPPC Bureau at the Institute for Prospective Technological Studies, 2009) obtained as a result of marketing studies and/or competitive scouting;
- indicators achieved by the refinery itself during the year preceding the commencement of setting up IIs and comprehensive indicators based on them.
The practice shows that the most complicated barrier in CB definition is the informational one: while the information related to the enterprise in general can be found in the annual reports (accounting, environmental, etc.), the operational level reporting in enterprises is either absent or kept strictly confidential. When the BREF is used as a source of information, the following shall be taken into account:
- information obsoletion: theoretically, BREFs must be updated every five years, but, for instance, the guide book (European IPPC Bureau at the Institute for Prospective Technological Studies, 2003) issued in 2003 has not been updated so far, and in March 2012, only the second edition of the updated version was published;
- no economic information necessary to generate IIs and further assess the EP EE.
As an example, let us consider indicators characterizing the DD operation and given in the guide book (European IPPC Bureau at the Institute for Prospective Technological Studies, 2003).
1. The content of components removed at the outlet from the operation, wt%: water – ≤ 0.3; solid particles – ≤ 0.015.
2. FW standard flow rate, wt% of the flow rate of processed crude oil, depending on oil density: 3-4% at 825 kg/m3 to 10% at ≥ 875 kg/m3.
3. Power consumption: 0.075-0.15 kW∙h/t of crude oil.
4. Oil-containing oil sludge: 60-1500 t/year depending on the contamination of crude oil and its processing volume; composition, wt%: emulsified oil and paraffins 20-50, water – 5-10, solid corrosion products, clay, sand – the rest.
5. Content of contaminants in CW at the DD operation outlet, Table 1.
Table 1
Characteristics of water discharged after the desalination-dehydration operation
Contaminants |
Typical concentration, mg/l |
Temperature, deg. C |
115-150 |
Solid particles |
50-100 |
Oil/emulsified oil |
high |
Dissolved hydrocarbons |
50-300 |
Phenols |
5-30 |
Benzene |
30-100 |
BOD |
high |
COD |
500-2000 |
Ammonia |
50-100 |
Nitrogen compounds (determined acc. to Kjeldahl) |
15-20 |
Sulphides (on H2S basis) |
10 |
With an incomplete number of IIs referred to the DD operation, the guidebook gives a number of recommendations to improve the DD quality and economic indicators: two/three-stage DD (especially when solid residues of further distillation are processed using catalysts), CW return from the last DD stage to the first one as FW, combined use of AC and DC to create electrical fields in the D-D, CW treatment with local treatment equipment located in immediate vicinity to the D-D, including pre-separation of oil discharged from the D-D, from CW with this oil returning to the D-D inlet, a number of measures to ensure complete recovery of sold particles ≥ 99%, using drains and water steam condensate formed during several refinery operations as FW at the D-D inlet and some others.
Due to the above, the most productive option of CB selection is the last one, especially when the refinery starts operation (project) to create the EP EE assessment system. As this work will be developing, CBs borrowed from external sources can be used along with own CBs.
The qualitative characteristics of individual indicators are determined as a part of management accounting and environmental accounting – a procedure requiring individual calculation of expenses related to resource consumption and environmental protection within the same frames and highlighting these expenses as an individual item in the structure of the products’ prime cost. The functional quality criteria of centers (a basis to reduce individual indicators to a non-dimensional form) are individual indicators obtained when the best-among-available technical, organizational, social and other solutions are used.
The use of the proposed methodology is represented in the thesis with an example of the desalination-dehydration of crude oil within the bitumen production process cycle at one of the Russian refineries. The refinery data (as an evaluation object) have been obtained as a part of the management accounting, and the reference standard is the refinery data with almost similar annual volume of crude oil processing, its density and content of impurities to be removed, Table 2.
Table 2
Individual indicators of the negative impact of crude oil
desalination-dehydration on environment (one-stage process)
Item No. |
Indicator |
Dimension |
Numeric value |
|
Evaluation object |
Reference (comparison basis) |
|||
1 |
Total flushing water consumption - including recycled water |
m3/h |
600 570 |
500 550 |
2 |
Power consumption - electricity - thermal energy |
kW-h/CO tons* GJ/CO tons* |
70 0.025 |
80 0.023 |
3 |
Content of contaminations in discharged water - solid particles - dissolved hydrocarbons - phenols - benzene - BOD - cCOD - ammonia nitrogen - sulphides
|
mg/l |
85 170 3 80 92 1400 50 10 |
75 175 5 65 80 1250 75 10 |
4 |
Operational process prime cost |
RUR/CO ton |
90 |
80 |
Note: * crude oil ton
The data of the table do not allow making a non-ambiguous conclusion on higher or lower integral negative impact of the compared objects on the environment.
European Environmental Agency. EEA core set of indicators. Guide. (2005). Luxembourg: Office for Official Publications of the European Communities, pp. 38
European IPPC Bureau at the Institute for Prospective Technological Studies. (2003). Integrated Pollution Prevention and Control (IPPC). Reference Document on Best Available Techniques for Mineral Oil and Gas Refineries. Seville. (p. 518). Retrieved October 14, 2017, from http://eippcb.jrc.es
European IPPC Bureau at the Institute for Prospective Technological Studies. (2006). Integrated Pollution Prevention and Control (IPPC). Reference Document on Economics and Cross-Media Effects. Seville. (p. 175). Retrieved October 15, 2017, from http://eippcb.jrc.es
European IPPC Bureau at the Institute for Prospective Technological Studies. (2009). Integrated Pollution Prevention and Control (IPPC). Reference Document on Best Available Techniques for Energy Efficiency. Seville. (p. 430). Retrieved October 15, 2017, from http://eippcb.jrc.es
Glagoleva, O.F., & Kapustina, V.M. (Eds.). (2007). Tekhnologiya pererabotki nefti [Oil Processing Technology]. Moscow: Khimiya, KolosS. (p. 400).
National Round Table on the Environment and the Economy (Canada). (2002). Calculating Eco-Efficiency Indicators: A Workbook for Industry. (p. 70).
Padalko, O.V., & Psareva, N.Y. (2012). Okhrana okruzhayushchei sredy i regionalnaya promyshlennaya politika [Environmental Protection and Regional Industrial Policy]. Uchenye zapiski Rossiiskoi akademii predprinimatelstva, 31.
Psareva, N.Y. (2003). Kholdingovye otnosheniya: teoreticheskie i metodologicheskie aspekty [Holding Relations: Theoretic and Methodological Aspects]. Moscow: Vysshee obrazovanie i nauka. (p. 304)
United Nations. (2003). United Nations Conference on Trade and Development: A Manual for the Preparers and Users of Eco-Efficiency Indicators. New York, Geneva. (p. 114).
Velikanova, K.M. (Ed.). (1975). Raschety ekonomicheskoi effektivnosti novoi tekhniki. Spravochnik [Calculations of Economic Efficiency of New Equipment]. Guidebook. Leningrad: Mashinostroenie. (p. 430).
1. Almaty Technological University, Kazakhstan, 050012, Almaty, Tole bi St., 100
2. Caspian Public University, Kazakhstan, 050012, Almaty, Seyfillin Ave., 521, E-mail: gumnaz@mail.ru
3. Caspian Public University, Kazakhstan, 050012, Almaty, Seyfillin Ave., 521