![]() ISSN 0798 1015
ISSN 0798 1015

![]() ISSN 0798 1015
ISSN 0798 1015
Vol. 39 (Number 18) Year 2018 • Page 28
Sergei Anatol'evich ERMOLAEV 1; Larisa Gennadievna CHEREDNICHENKO 2; Mayya Valerianovna DUBOVIK 3; Aleksandr Zakharovich SELEZNEV 4
Received: 17/01/2018 • Approved: 28/02/2018
4. Price volatility of raw materials
ABSTRACT: The purpose of this article is to review the economic mechanisms of oil and gas dependence of the Soviet Union, such as the long-term change in terms of trade (the Prebisch-Singer hypothesis), the Dutch disease and the volatility of commodity prices. The work shows that the Dutch disease manifested itself in the Soviet economy in a specific way: during the commodity boom, there could be no comparable growth in investment in the oil sector. And, conversely, investments could increase during the fall in the price of oil. The volatility of commodity prices was very detrimental to the Soviet economy in terms of a sharp decrease in the ability to import the required types of products. However, the Soviet government reacted to the drop in the price of oil in an unusual way - by increasing investment in its extraction. The industrialization of the Soviet Union was carried out long before the appearance of the Prebisch-Singer hypothesis. The extent to which this hypothesis was true for the Soviet economy requires a separate study. The scientific novelty of the work is to apply the results of modern studies of resource dependence of the economy to the analysis of oil and gas dependence of the Soviet Union. |
RESUMEN: El propósito de este artículo es revisar los mecanismos económicos de la dependencia del petróleo y el gas de la Unión Soviética, como el cambio a largo plazo en los términos de intercambio (la hipótesis de Prebisch-Singer), la enfermedad holandesa y la volatilidad de los precios de los productos básicos. El trabajo muestra que la enfermedad holandesa se manifestó en la economía soviética de una manera específica: durante el boom de los productos básicos, no podría haber un crecimiento comparable en la inversión en el sector petrolero. Y, a la inversa, las inversiones podrían aumentar durante la caída del precio del petróleo. La volatilidad de los precios de las materias primas fue muy perjudicial para la economía soviética en términos de una fuerte disminución en la capacidad de importar los tipos de productos requeridos. Sin embargo, el gobierno soviético reaccionó a la caída en el precio del petróleo de una manera inusual, al aumentar la inversión en su extracción. La industrialización de la Unión Soviética se llevó a cabo mucho antes de la aparición de la hipótesis de Prebisch-Singer. La medida en que esta hipótesis era cierta para la economía soviética requiere un estudio por separado. La novedad científica del trabajo es aplicar los resultados de los estudios modernos de la dependencia de los recursos de la economía al análisis de la dependencia del petróleo y el gas de la Unión Soviética. |

Between the end of World War II and the mid-1960s, the Soviet Union’s economy was one of the most vibrant in the world. The country had successfully launched the first man into space and was competing with the United States in developing cutting-edge military technology. However, by the end of the 1980s, the economy was in a miserable state (but this was not obvious to everyone). How did it get to that point? Back in 1960, just twenty-five years earlier, the Soviet Union’s GDP per capita was on par with Japan’s. There are many explanations for the decline of the Soviet economy:
The existing methods of social sciences do not apparently allow us to conduct a detailed analysis of the role of the above-mentioned factors, considering the share of each of them, in the slowdown and depression of the Soviet economy. In this article we will focus on purely economic mechanisms of formation of the Soviet economy’s oil and gas dependence.
For an extended period of time, the Soviet Union was the world’s largest producer of energy resources. In 1989 (the last year for which comprehensive data is available), total energy production, including oil, natural gas, coal, hydropower, and atomic energy amounted to about 21 percent of the world’s total production, as opposed to the United States’ 20-percent share. Gas made up 36 percent of the total energy output in the USSR; oil comprised 36 percent; and coal amounted to 20 percent (Manmohan et al, 1991).
There were ongoing debates about the resource dependence of the Soviet, and later, Russian economy. The debates intensified, most naturally, after each time the price of oil began to decline (soon followed by price drops in gas and other natural resources). In particular, this happened during and after the crises of 1982, 1986, 1998, 2008, and 2014.
Here, we would like to conduct a review of the main economic concepts (which could be called separate theories) of the so-called resource curse theory and how applicable they are for the Soviet economy
The Role of Planned Economy in Managing Natural Resources
Before the resource curse theory emerged, the problems linked to the Soviet Union’s oil and gas complex were usually divided into two groups (Gustafson, 2014):
We will take a brief look at each of these factors. The central planning system affected economic policy through three main channels. Firstly, the system is considered to have generated incorrect, incomplete, or irrelevant information, which was then passed into the wrong hands. In particular, the price system was creating the wrong supply and demand signals, especially related to new goods and services. Interest and discount rates did not reflect the preferences of society (and only loosely reflected those of the country’s leaders) in regards to risks or the choice between the present and the future. Information flows were moving mostly vertically, not horizontally. The people who were supposed to make decisions lacked the necessary information, whereas those who had access to the best information were not responsible for making decisions. This is why plans based on misinformation are hard to implement.
As Vasiliy Pater, the former head of the State Planning Committee’s (Gosplan’s) oil industry subdivision, recalls, in the 1970s, annual plans did not correspond to the five-year plans, and actual figures were different from both of them. For instance, in 1975, the five-year plan prescribed to extract 505 million tons of oil (5). This figure was then reduced to 487.4 million tons in the annual plans, and 491 million tons were actually extracted. Despite the fact that the five-year plan was not fulfilled, they planned to extract 640 million tons in 1980, then lowered the figure to 606 million tons in the annual plans, and actually produced 603 million tons. Again, despite not hitting the previous target, in 1985, the country was supposed to produce 630 million tons according to the five-year plan; annual plans lowered the level to 628 million tons, and 595 million tons were actually extracted (it’s important to mention that despite problems with accurate information in the five-year plans for the development of the national economy, the difference between the planned level and the actual one was not as striking as one might expect, and amounted to 2.8–5.8 percent in the mentioned years) (Slavkina 2015). The gaps were particularly dangerous in regards to receiving and using information on oil and gas deposits that were potentially ready for exploration.
Secondly, the planned system generates irrational incentives and conflicting preferences and doesn’t have a way of bringing them together other than time-consuming negotiations or administrative pressure. For instance, distorted incentive systems and the lack of strict financial limitations encouraged excessive use of all resources, despite the quality standards and delivery timetables in use, and neglect for the needs of the consumers.
Thirdly, as a consequence of the first two reasons, the goals set by the leadership were considerably distorted in the process of achieving them. Resources were delivered in the wrong composition, were presented in the wrong order, and then often used for a purpose other than that for which they were intended. Manufacturers shirked the consequences, which went to consumers, and reported wrong information about fulfilling the plans to the leadership. This caused another round of dysfunctional planning.
Egan Neuberger, Thane Gustafson (2014), and, later, Gaddy and Ickes (2013), put an emphasis on another important feature of the Soviet economic system: its accumulated effects, embodied in the country’s physical infrastructure. Gustafson uses a metaphor to compare the Soviet economy with a warped tree that has grown under the strong northerly wind of industrialization. This is reflected in the structure and location of the nation’s capital stock, network of roads and railroads, size and type of enterprises, distribution of labor resources, and the types of fuel and minerals it uses. This feature of the Soviet (and now the Russian) economy has determined, among other things, its high oil and gas dependence in a sense that large amounts of oil and gas were required to keep the economy running. From an economic viewpoint, this problem was caused by the extremely low mobility of economic resources, first and foremost, the low mobility of physical capital.
Bornstein (1985), Chistovich (1990), and Nove (1986) single out the following reasons why the use of energy was inefficient in light of nature of the Soviet planned economy (As cited by: Martinot 1998): (a) the heads of enterprises did not have incentives to minimize production costs; (b) energy caps and the distribution of energy led to an excessive use of energy; (c) technological progress was suppressed by the lack of incentives to innovate and the fact that any changes could lead to problems in receiving new resources and higher risks in achieving production goals; (d) exclusive production of multiple goods by one enterprise meant that the goods were always in demand, regardless of their features; (e) construction of a large number of apartments in the 1950s and the 1960s led to the situation where their quality and energy features were less important than the volumes of construction; and (f) it was meant a priori that large central heating systems had no alternatives, and systems that were potentially more efficient were never considered.
This posed the question about whether the appearance of large oil and gas revenues had actually made the mentioned drawbacks of the planned economic system worse. One of the leading experts in the resource curse, Michael Ross, on the back of reviewing multiple studies, assumes there are no sufficient grounds to state that oil negatively affects the quality of government institutions (Ross 2015). This means that oil was highly unlikely to aggravate the disadvantages of the planned economy.
When reflecting on whether the resource curse existed in the Soviet Union, it is important to determine the meaning of this term. We will adhere to its initial interpretation, which is the reduction of long-term economic growth rates of a country along with the growth of certain indicators of its resource availability (the share of raw materials in exports, total raw material exports, or raw material extraction per capita). There is a consensus in economic science that the resource curse, if it exists, is relative. This means that the negative consequences of high resource availability take place only under certain conditions (while the composition and threshold values of these factors are subject to debate; this is largely explained by the difficulty of evaluating the influence of different conditions on the dependence of economic growth from resource abundance empirically).
The resource curse theory is not an all-inclusive doctrine, but rather a combination of many hypotheses about the effect of different factors (mechanisms) that determine the negative correlation between the growth of resource availability and the change in economic growth rates. All these mechanisms could be divided between the purely economic and the political-economic. Until the end of the 1990s, economics mostly focused on economic factors, but currently, the emphasis has shifted to the political economy of the development of resource dependence.
According to this thesis, the terms of trade of resource-exporting nations get worse over time. This is linked to the fact that these countries mostly import final products, prices on which grow faster than prices on raw materials in the long term. As different kinds of raw materials occupy the main share in exports of most developing nations, they become victims in the global division of labor system (Ermolaev et al, 2012).
A consequence of the dissemination of this theory (first and foremost in Latin American nations) was large-scale import substitution industrialization. There is evidence that the Soviet Union’s industrialization became a role model for it. The idea that the Soviet Union adhered to during the industrialization aligned with the conclusion made by Latin American nations from the Prebisch-Singer thesis two decades earlier. This is the idea to reduce the dependence on developed nations in the consumption of industrial (and all technologically complex) production.
But, the Soviet Union was pursuing another goal that was, according to its leadership, just as important: the creation of a powerful military-industrial complex that was independent from the West. Recent studies have shown that only certain kinds of raw materials can experience a long-term downward price trend, and oil is not on the list (Harvey et al, 2010). But not only the long-term price trend for the exported raw materials but also its short-term fluctuations are important for a country. And few resources can be compared to oil in this regard (see more about price volatility below).
This disease emerges and progresses through the real exchange rate of a national currency and, in particular, through its strengthening (Corden and Neary 1982, Corden 1984). There are two ways that this could happen: through the increase of the national currency’s nominal exchange rate or through a higher rate of inflation in the country compared to that in other countries (its trading partners). This, in turn, causes two effects: resource movement and expenditure. The first effect leads to movement of capital and labor from the processing industry and the service sector. The second one, through spending extra revenue of the resource sector inside the country, increases the demand for services (it is assumed that the service sector is non-traded, that is, it’s hard to substitute foreign goods with domestically produced ones). Both effects cause the deindustrialization of the economy.
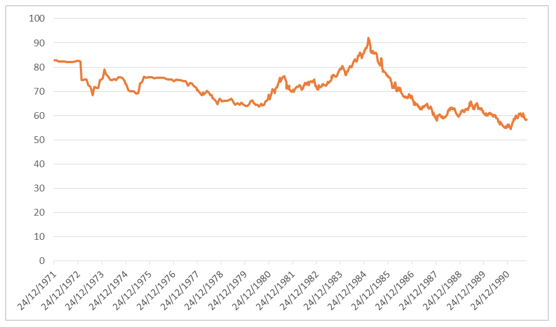
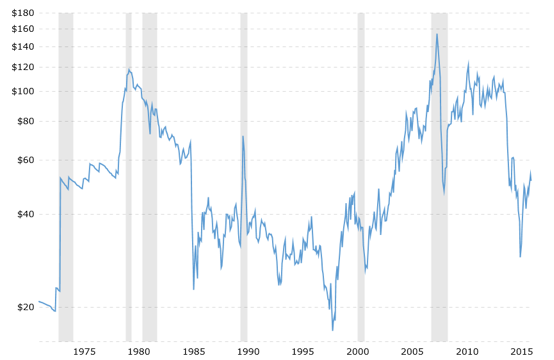
Were these mechanisms functional in the Soviet Union in the 1970s and early 1980s when oil prices skyrocketed? It was the State Bank, not the free market, which set the ruble’s nominal exchange rate. From the Soviet ruble’s official exchange rate (see figure 1), note that it often dropped during the periods when oil prices went up (for example, between August 1973 and February 1974). The principal price hike took place in January 1974: from $4.31 to $10.11 per barrel (see figure 2). However, between February 1974 and August 1975, the ruble’s exchange rate climbed from 0.79 to 0.69 per dollar (but oil prices increased insignificantly from $10.11 to $11.16 per barrel). Obviously, a change in the ruble’s real exchange rate did not correlate with the scale of changes in oil prices.
Figure 1
U.S.Dollar`s Official Exchange Rate (in Rubles per $100)
(Russian Central Bank Database)
-----
Figure 2
Oil price (at current prices). (Crude Oil Prices - 70 Year Historical Chart)
All the economic mechanisms of the resource curse we review presume the existence, in one form or another, of market mechanisms (that is, the existence of private economic agents who react to incentives). However, the planners (Gosplan staff) who were not interested in boosting the profits of state-run enterprises as business owners in capitalist countries are, still responsive to incentives, albeit with delay. The growing returns on the invested capital and labor in the oil industry should cause a resource movement effect, and they did.
However, available data (see table 1) shows that despite the rapid growth in oil prices after 1973, the share of investment in the energy sector decreased from 29.4 percent to 28 percent between 1971 and 1975, then stabilized and started growing only in 1978, reaching 38.6 percent in 1985. Thus, we can’t say that the effect of capital’s movement to the oil extraction industry started to work all at once, it started to take effect in the late 1970s, as the national leaders clearly realized that the increment of oil stock started to lag behind oil production. Between 1977 and 1985, the share of investment in the energy sector grew by 10 percentage points (in fact, since the early 1970s, geologists have not been fulfilling the exploration drilling plans every year (Gustafson 2014). Between 1970 and 1986, the growth rates of capital investment in the oil and gas industries were considerably higher (three- to five-fold) than in the industry and the economy on average. Between 1970 and 1973, before the energy crisis, the share of the oil industry in total capital investment across all industries hovered around 8.8–9.3 percent; in 1986, it amounted to 19.5 percent. The increase of the oil sector’s share in the whole energy complex was not as surprising; it rose from 31.4 to 40.6 percent (Arbatov, Feygin and Smirnov, 2005).
Table 1
The Share of Investment in the Energy Complex from the Industrial Sector, 1970-1985
(Except for Transmission, in pre-1982 prices)
Year |
% |
1970 Ninth Five-Year Plan 1971 1972 1973 1974 1975 Tenth Five-Year Plan 1976 1977 1978 1979 1980 Eleventh Five-Year Plan 1981 1982 1983 1984 1985 |
28,7
29,4 28,9 28,6 28,4 28,0
28,2 28,1 29,7 30,5 31,7
33,9 34,8 34,8 35,9 38,6 |
Source: National Economy of the USSR (various years)
(as cited by (Gustafson, 2014)
The mechanism at the heart of Dutch disease assumes that the movement of labor and capital to the resource sector only takes place when this sector experiences a boom, or, more precisely, until the returns on the invested capital are higher than in other industries. Unfortunately, we don’t have data for such an analysis, but we repeat: starting from 1986, the Soviet Union had to invest a lot of effort into boosting oil production because the price of oil dropped sharply in 1986. According to some experts, the cost of extracting an extra ton of oil during this period exceeded its price. Matthew J. Sagers (1987) estimates the cost of extracting an extra barrel in the mid-1980s at $15, while the world price of a barrel of oil stood at $14. According to other estimates, “It was only due to huge expenses that oil output somewhat increased in 1986. [In this year], [the authorities] allocated 31 percent more of capital investment than in 1985” (Arbatov, Feigin, Smirnov, 2005) (the 1986 output amounted to 615.4 million tons, that is, only 3.1 percent higher than in 1985 (6) This also meant that the rent from each additional ton of oil tended toward zero (and probably was occasionally negative).
The Dutch disease is called a disease because it implies that it’s hard for the economy to recover after a period of high oil prices since over this period the processing industry and agriculture lose their competitiveness due to reduced output volumes during a boom period (it learns by doing less than it could have if there was no boom). For the Soviet Union, the stagnation in agriculture was perhaps even more influential (see data on grain imports later on). We can assume that the Soviet authorities would have to reform the country much sooner if there were no high resource revenues.
In real life, the capital stock of the economy (material and human) cannot change its structure overnight, even if it gets very profitable to move it to other industries. This means that the economy has to undergo very painful changes in its industrial structure. However, ideal economic models deal with a perfect capital market, meaning that banks and other financial institutions can evaluate the prospects of investment projects even in completely new sectors of the economy and provide capital under a reasonable interest rate. This means that companies have easily available capital during periods of structural changes in the economy.
In a planned economy, there was no financial market in the modern sense (there was a fight between different ministries, authorities, and regions over maximizing their shares in the distribution of resources). However, even Gosplan had to react to the demands of consumers and the leaders of the country in one way or another and change the flows of investment. Can we imagine that the Soviet Union could have converted a part of the military-industrial complex into manufacturing civilian products more successfully and thus smooth the drop in oil prices? It is difficult to estimate this now.
When the Soviet Union received more dollars for the oil it was selling, this created an incentive to import more goods both for the population and for industrial consumption. It is important to keep in mind that the military-industrial complex was drawing in the best resources, including the most skilled staff and material resources. Even the oil and gas complex was suffering from the never-ending shortage of necessary resources and was highly dependent on imports of many investment products.
Available data shows that during the 1970s and 1980s, imports of a range of goods increased. “If in 1970, the USSR bought 2.16 million tons of grain, by 1985 the figure amounted to 44.2 million tons (a 20-fold increase). Procurements of meat from abroad increased by 5.2 times: from 164.9 thousand tons in 1970 to 857.5 thousand tons in 1985. Imports of clothes and footwear quadrupled in monetary terms (from 699 million to 2.7 billion rubles) and 4.6 times (from 271 million to 1.25 billion rubles), respectively,” notes Russian oil sector historian M. Slavkina (2015).
On the whole, it could be said that the mechanisms of Dutch disease manifested themselves in the Soviet economy in a specific manner: during the raw materials boom, resources were moved to the oil and gas sector, while the authorities’ willingness to develop the processing industry declined and agriculture stagnated.
Global raw materials’ prices were much more volatile than prices on end products. The results of many studies showcase this. An in-depth study of economic growth of thirty-five nations between 1870 and 1939, conducted by Christopher Blattman, Jason Hwang, and Jeffrey Williamson, concluded that nations specializing in the production of raw materials (with highly elastic prices) have a higher elasticity of the terms of trade, a smaller amount of foreign direct investment (FDI), and slower rates of economic growth.
We can’t discuss FDI in regards to the Soviet economy, but we know the following fact about the change in the country’s terms of trade: the purchasing power in 1988 of one barrel of Soviet oil, expressed in items of West German machinery, decreased to one-quarter from the 1985 level (PlanEcon Report 4, October 1988). A change in terms of trade like this is highly painful for the economy; it means that the country had to export four times as much oil in order to buy the same number of imported goods. (This is, of course, an exaggeration for foreign trade, but it’s still important to remember that oil and gas accounted for about four-fifths of the Soviet Union’s exports in the 1980s.)
It is highly ironic that before the 1970s, the Soviet Union was trying to hedge against fluctuations caused by its involvement in global trade, was creating a highly diversified industry for this purpose (it bought the goods it lacked in the members of the Council for Mutual Economic Assistance, or Comecon), and was importing high-tech products from Western nations only in case of a grave necessity. At the end of the day, the country suffered a lot from this trade (see below for more details on energy exports).
Early theories of economic resource dependence emphasized the economy’s reliance on exports of natural resources. But what if the principal volume of resource rent comes from the internal consumption of resources, rather than from their exports? In the latter case, the economy is highly dependent on the global market (and its consequences, such as Dutch disease and extremely high volatility of resource prices and capital flows). But what if the functioning of market mechanisms is suppressed? In this case, only planning authorities determine to which industries and in what volumes resources should be distributed (which, in theory, was supposed to prevent Dutch disease from developing).
If cross-border capital flows are nonexistent or very small, their volatility should pose no threat to the economy (as there is no stock market and the pressure on the national currency’s exchange rate is tiny in both directions). Would the resource curse exist in the ideal case of a completely autarkic country? In the case of a resource boom caused, for instance, by the discovery of new deposits, the costs of production (and hence consumption) would rapidly decrease; in case the deposits are drained, they would increase again. Thus, it still would not stop volatility in the economy. It would, however, be volatility caused by a fluctuation of volumes of resources in natural deposits. The Soviet Union had to encounter the volatility of both oil production and the demand for it.
In 1991, the Soviet Union collapsed, but the debate on the role of oil and gas dependence is still a huge issue. In 1987, one of the USSR Gosplan employees noted at a meeting of economists: “If Samotlor oil did not exist, perestroika [reconstruction] of the economy would have occurred 10-15 years sooner.” (Arbatov et al., 2005). In the Soviet period, oil prices peaked in 1980 ($88 per barrel) and then gradually fell to $50 per barrel by 1985 (a 43-percent drop), and crashed to $26 per barrel in 1986 (slightly recovering again to $36 per barrel in 1990 before starting to fall sharply again in 1991 (2006 BP Statistical Review of World Energy). Irrespective of the drop in international oil prices, we can’t state that oil prices played a key role in the crash of the Soviet Union. Many other oil-exporting nations suffered just as much, if not more than the Soviet Union. The Soviet Union had a relatively diverse economy compared to that of other oil dependent countries. Currently, many experts are convinced that the main reason behind the rapid crash of the Soviet system was perestroika.
And still the oil and gas factor played a very important part in the crash (in fact, oil has always been a much greater contributor to international currency than natural gas). At the peak of the development of the oil industry in 1980, the USSR’s oil export revenues amounted to $3,100 per capita, and by 1991 they had dropped by about two-thirds, to $1,050 per capita (Ross, 2015).
Modern theories related to the concept of the resource curse have led us to a better understanding of the mechanisms behind the negative effect of oil abundance on economic development. Many of these mechanisms were manifested in the Soviet economic system. It was Dutch disease that made things worse for the already troubled industrial and agricultural sectors, and the extreme volatility of oil prices that showed itself in the 1970s and 1980s, which first raised the Soviet economy to the top, and then plummeted it to the bottom.
The most important factor is that the institutions established in the Soviet planned system turned out to be extremely poor at preparing for adapting to the chaos of the world markets, which the state couldn’t control. The Soviet Union didn’t establish stabilization funds to smooth out the drops in oil prices (actually, very few nations did at the time), as it had never faced such situations before. It was unable to react by devaluing the currency, and even if it did, it would not make much sense as civic industry had continuously experienced a deficit of resources (as most high-quality resources were directed to the military-industrial complex output) and wouldn’t be able to boost output. Agriculture wouldn’t be able to boost the harvest output due to chronic problems that had accumulated over decades.
Perhaps, the main factor is that the authorities in the 1970s didn’t understand the nature of the situation they faced. A highly unusual situation—the multiple increase of prices on the world market and the discovery of huge oil and gas deposits—started to seem quite natural. This led to the government getting many permanent (not temporary) expenditure commitments, which it found difficult to fulfill afterward.
This study was financed by a grant from the Plekhanov Russian University of Economics.
2006 BP Statistical Review of World Energy. Date View November 28, 2017 http://www.bp.com/content/dam/bp-country/en_ru/documents/publications_PDF_eng/Statistical_review_2007.pdf (2007).
Arbatov A., Feygin V. and Smirnov, V. (2005). Unrelenting Oil Addiction. Russia in Global Affairs, 2. Date View November 28, 2017 http://eng.globalaffairs.ru/number/n_4960
Bornstein, M. (1985) The transfer of western technology to the USSR. Paris: OECD
Chistovich, C.A. (1990). Problems of heat supply development in the USSR. AVOK Journal, 1990, 36-43.
Corden W. M. (1984). Booming Sector and Dutch Disease Economics: Survey and Consolidation. Oxford Economic Papers, 36, 359-380.
Corden W. M. and Neary, P. J. (1982). Booming Sector and Deindustrialisation in a Small Open Economy. Economic Journal, 92(368), 825-848;
Crude Oil Prices - 70 Year Historical Chart. Date View November 28, 2017 http://www.macrotrends.net/1369/crude-oil-price-history-chart
Ermolaev S., Vasilyeva, O. and Mishura, A. (2012). Phenomenon of Resource Curse in Economic Development. Moscow: Plekhanov Russian University of Economics.
Gaddy C. G. and Ickes, B. (2013). Bear traps on Russia’s road to modernization. Routledge
Gustafson, T. (2014). Crisis amid plenty: The politics of Soviet energy under Brezhnev and Gorbachev. Princeton University Press, pp. 10–15.
Harvey D. I., Kellard N. M., Madsen J. B. and Wohar M. E. (2010). The Prebisch-Singer Hypothesis: Four Centuries of Evidence. The Review of Economics and Statistics, 92(2), 367–377.
Martinot, E. (1998). Energy efficiency and renewable energy in Russia: Transaction barriers, market intermediation, and capacity building. Energy Policy, 26(3), 905-915.
Mr Manmohan S., Kumar and Kent Osband, (1991). Energy pricing in the Soviet Union,” Working Paper, no. 91-125. Washington, D.C.: International Monetary Fund.
Nove, A. (1986). The Soviet Economic System. Allen &Unwin, Boston.
PlanEcon Report 4, nos.39-40 (October 1988), 2 (as cited by Gustafson, 286).
Ross, M. (2015). Oil Curse: How Rich Oil and Gas Raw Material Deposits Shape Development of States. Moscow: Gaidar Institute, pp. 359.
Sagers, M. .J. (1987). Oil Production Costs in the USSR,” PlanEcon Long-Term Energy Outlook. Washington, D.C.: PlanEcon, Inc., Fall, pp. 43-54
Slavkina, M. (2015). Oil and gas factor of domestic modernization 1939-2008. Moscow: Ves Mir, pp. 295–297.
1. Plekhanov Russian University of Economics, 36, Stremyannyi Ln., Moscow, 117997, Russia. E-mail: sergei_ermolaev@mail.ru
2. Plekhanov Russian University of Economics, 36, Stremyannyi Ln., Moscow, 117997, Russia
3. Plekhanov Russian University of Economics, 36, Stremyannyi Ln., Moscow, 117997, Russia
4. Moscow State Institute of International Relations (MGIMO University), 76, Vernadsky Ave., Moscow, 119454, Russia
5. All tons (of oil, etc.) mentioned in this paper are metric tons.
6. Calculated on the basis of: Global, British Petroleum, “Statistical Review of World Energy 2006,” http://www.bp.com/content/dam/bp-country/en_ru/documents/publications_PDF_eng/Statistical_review_2007.pdf (2007).