![]() ISSN 0798 1015
ISSN 0798 1015

![]() ISSN 0798 1015
ISSN 0798 1015
Vol. 39 (Number 18) Year 2018 • Page 32
Received: 26/12/2017 • Approved: 05/02/2018
5. Conclusion/ Summary and concluding remarks
ABSTRACT: The concept of Competitiveness has drawn tremendous attention of both scholars and governors aiming to portray a consensus leading to financial and economical stability of their country as well as to keeping their markets competitive. The World Economic Forum (WEF) publishes its annual report which encompasses Global Competitiveness Index (GCI) in order to measure national competitiveness in different countries. The purpose of this paper is to provide information for improving national competitiveness in different countries around the world through identifying the most impactful indexes affecting its level. The analyzed sample consists of 102 countries out of 138, omitting countries at two transition stages. Moreover, a canonical correlation analysis has been employed to investigate the interaction between the two pillars. Our findings show that there is a significant and positive relationship between the set of “Business Sophistication” and “Macroeconomic Environment”, consequently this link exists and varies depending on the stage of development that a country has achieved. |
RESUMEN: El concepto de Competitividad ha llamado tremendamente la atención tanto de académicos como de gobernadores con el objetivo de retratar un consenso que conduzca a la estabilidad financiera y económica de su país, así como a mantener sus mercados competitivos. El Foro Económico Mundial publica su informe anual que abarca el Índice de Competitividad Global (ICG) con el fin de medir la competitividad nacional en diferentes países. El propósito de este documento es proporcionar información para mejorar la competitividad nacional en diferentes países del mundo a través de la identificación de los índices más impactantes que afectan su nivel. La muestra analizada consta de 102 países de un total de 138, omitiendo países en dos etapas de transición. Además, se ha empleado un análisis de correlación canónica para investigar la interacción entre los dos pilares. Nuestros hallazgos muestran que existe una relación significativa y positiva entre el conjunto de "Sofisticación empresarial" y "Entorno macroeconómico", por lo que este vínculo existe y varía según la etapa de desarrollo que haya alcanzado un país. |

Competitiveness has become ubiquitous in public discourse. Territories, like businesses, must comply with this new injunction. A weak competitiveness of a country's economy will not encourage foreign companies to set up production or research centers in the country. Moreover, this low competitiveness will weaken domestic firms, making them lose market shares compared to foreign competitors. In the end, this will reduce output per worker and total employment within the country.
While geography has underlined the links between globalization and territories for several decades, the recurrent use of this term in the political debate implies that territories (cities, regions, nations, sets of nations, etc.) must henceforth to be competitive in the same way as companies: this notion, theorized by economists, has obvious geographical implications (Huggins 2011).
This approach became even more popular under the influence of Michael Porter (1990, 1995, 2003), that sparked the attention by regional clusters of related sectors with the aim to enhance productivity, innovativeness and competitiveness in general. Competitiveness implies high and rising living standard of a company with the lowest possible level of unemployment on a sustainable basis according to Porter and Ketels's definition (Ketels, Porter 2003). Meanwhile, regional competitiveness is defined by Cooke (2014) as the ability of the economy to attract and maintain firms with stable or rising market activities at the sub-national level, while maintaining or improving living standards of all those living in the region.
The purpose of WEF is issuing the annual Global competitive Index reports in order to provide benchmarking tools for business leaders and policymakers, to identify obstacles to improved competitiveness, thus stimulating discussion on the best strategies and policies to overcome them.
The GCI contains 12 pillars of competitiveness which are independent tending to reinforce each other (Porter, M.E., Schwab, K. et al.2005); this present research aims to investigate the interaction between two of the basic pillars of national competitiveness which are “Business Sophistication” and “Macroeconomic Environment”. To our knowledge, no existing research considers the interaction between these two pillars and their sub-indexes; as a result, there is a gap which should be investigated more closely.
The term competitiveness comes from the business world. It applies to an industrial process, a product or a firm (Porter, 2014). Applying the term to a territory developed in the 1980s. This transposition of the term "competitiveness" to qualify geographical entities has been widely criticized (in particular by the Nobel laureate Paul Krugman (1994). However, the theoretical work and debates surrounding the competitiveness of nations have led to the emergence, despite some controversies, of a consensual definition (Aiginger, 2006).
Contrary to a widely held idea, the competitiveness of a territory is not synonymous with export performance. The World Economic Forum says in the 2009-2010 report (Schwab K., 2009): "We define competitiveness as the set of institutions, policies and factors that determine the level of productivity of a country. The level of productivity, in turn, determines the sustainable level of prosperity that can benefit an economy".
In line with the work of the World Economic Forum, we will define competitiveness as the ability of a geographical entity to improve the standard of living of its inhabitants while being subject to a free trade regime. It is thus distinguished from the productivity for which the definition of Michael Porter (1998) can be used (it is measured by the remuneration of the factors of production: "The productivity of the human resources defines the wages, while that of the capital fixes its return for the shareholders". The design that measures the competitiveness of a nation through the development of its population and the opening of its trade borders, is widely disseminated by governments and international organizations (OECD 2009, 2011, 2016; The World Bank 2017). Competitiveness is therefore a prospective indicator focused on the future capacity of a territory to improve the material living conditions of its population.
A lot of international institutions estimate and present on an annual base the competitive records of countries. These annual reports (Global Competitiveness Index) constitute an important source of information for all foreigner investors and a motive force of the international economic activity. Such rankings help policy makers to design and evaluate national competitive performance in the way technical benchmarking helps enterprises to assess and improve their competence.
The methods applied in Global Competitiveness Report are inseparable from Michael Porter's ideas. To a large extent, the economic assumptions of the Global Competitiveness Report are a cover of Michael Porter's bestseller "Competitive Advantage of Nations". Note that one of the great qualities of this report is its concern for transparency as to its methods (data collection, calculation methods, very detailed appendices, etc).
The Global Competitiveness Index, a benchmark for measuring global competitiveness of nations, is a composite index resulting from a weighted average of 110 extremely diverse variables (macroeconomic indicators, infrastructure, quality of education system, social status, intensity of research and development and so on). This accumulation of data must take into account all the "factors that allow national economies to achieve sustained economic growth and long-term prosperity. To make possible the aggregation of heterogeneous data, all the results are converted on a scale of scores from 1 to 7. These 110 notes are then grouped into 12 categories called "pillars", which in turn are divided into three large "sub-indices " the reflection of which are shown on Figure 1.
Figure 1
The framework of Global Competitiveness Index (Schwab, 2016:5)
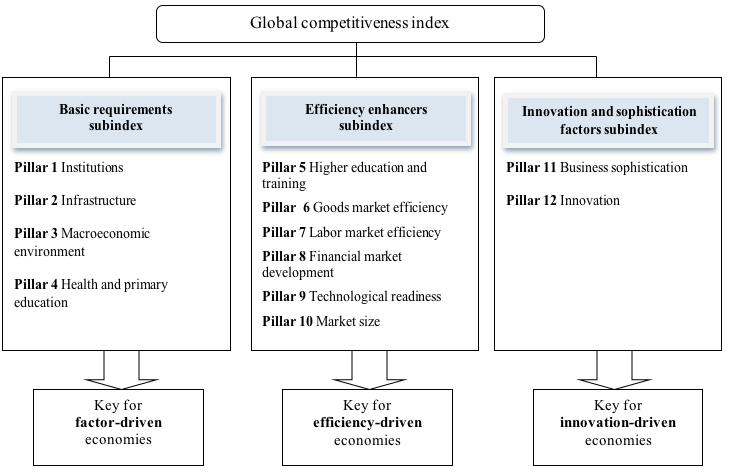
It is proven that high efficiency in producing goods and services is facilitated by sophisticated business practices. Business sophistication comprises two interrelated elements: level of a particular company’s quality operations and strategies held as well as the quality of overall business networks existing in a country. Named factors are of current importance for highly developed countries which have exhausted prominent sources of productivity improvements. Clusters being interconnected and geographically proximate groups play an important role due to the following reasons: strong business relationships within business networks facilitated the efficiency in performance of all subjects involved, also clusters are conductive to great opportunities for innovation while producing goods or services (Porter, 1998).
On the level of individual companies their cutting-edge strategies and tactics in terms of marketing, positioning, branding, creating a unique value proposition as well as topnotch production processes contribute to the economy of a country as a whole leading to establishing sophisticated and up-to-date business sector.
According to the brief description of pillars provided in GCI Report 2016-2017, each pillar consists of a set of sub-indexes. The “Business sophistication” pillar includes the following sub-indexes:
Table 1
Sub-indexes included in 'Business sophistication' pillar (Schwab, 2016)
N |
Name of sub-index |
Explanation |
Top ranked countries |
1 |
Local supplier quantity |
Identifies how numerous are local suppliers
|
Japan, Germany, Hong Kong SAR |
2 |
Local supplier quality |
Reflects the quality of local suppliers assessed in a particular country
|
Switzerland, Japan, Austria |
3 |
State of cluster development |
Determines the abundance of well-developed and deep clusters
|
United States, United Arab Emirates, Taiwan |
4 |
Nature of competitive advantage |
Defines the base of country’s companies competitive advantage in international markets
|
Switzerland, Japan, Denmark |
5 |
Value chain breadth |
Shows the broadness of companies’ presence in the value chain
|
Japan, Sweden, Switzerland |
6 |
Control of international distribution |
Displays the extent to which domestic companies control the international distribution of their products |
Germany, United States, Switzerland |
7 |
Production process sophistication |
Measures the level of production processes sophistication |
Switzerland, Japan, Sweden |
8 |
Extent of marketing |
Assesses the level of local companies successfulness in using marketing to differentiate their products and services |
United States, United Kingdom, Switzerland |
9 |
Willingness to delegate authority |
Evaluates the willingness to delegate authority to subordinates
|
Denmark, Netherlands, Sweden |
World Economic Forum Executive Opinion Survey is the primary source for the ranking of countries according to Business sophistication sub-indexes. All sub-indexes were measured by 2015–16 weighted average, except for the last sub-index (Willingness to delegate authority) which was identified according to 2013–14 weighted average. (Schwab, 2016).
The stability of the macroeconomic environment is crucial for doing business and for country's overall competitiveness. Undoubtedly, macroeconomic stability alone cannot improve the national productivity, but its instability can damage the economy of a country. If the government has to pay a high interest on past debts it will not be able to provide its services effectively. Starting a financial deficit limits the government's ability to respond to business cycles. The condition when the rate of inflation is out of control makes it not feasible for organizations to function efficiently. As an example, if the macroeconomic environment is unstable, the economy cannot perform an ongoing growth. This issue has drawn public attention to the recent discussion of cost reduction decisions. It is important to note that this pillar evaluates only the stability of the macroeconomic environment, not assessing the qualitative aspect of the way governments manage its public accounts, which is being fully described in ‘Institutions’ pillar. Thus, macroeconomic environment is a factor of creating favorable conditions for thriving business sector of a country (Fischer, 1993).
The “Macroeconomic stability” sub-indexes, their explanation and top rated countries are shown in the following table:
Table 2
Sub-indexes included in 'Business sophistication' pillar (Schwab, 2016)
N |
Name of sub-index |
Explanation |
Top ranked countries |
1 |
Government budget balance |
It is expressed as general government revenue extracted total expenditure. Government budget balance is considered as an indicator measuring the financial impact of the overall governmental activity on the economy of a given country. |
Qatar, Norway, Congo, Democratic Rep. |
2 |
Gross national savings |
It is calculated as a ratio of gross national savings and GDP (both in current local currency). |
Qatar, China, Singapore |
3 |
Inflation |
This sub-index reflects the annual change in consumer price index (in percents) |
Canada, Austria, Japan |
4 |
Government debt |
Gross general government debt is measured as a percentage of GDP. |
Hong Kong SAR, Brunei Darussalam, Saudi Arabia |
5 |
Country credit rating |
Institutional Investor is the developer of Institutional Investor’s Country Credit Ratings™. The main source of information for it is provided by sovereign-debt analysts at leading global banks, as well as by security firms senior economists. |
Switzerland, Germany, United States |
Canonical correlation is a multivariate statistical technique which is used for conducting analysis of relationships between two sets of variables (Thorndike, 2000). It is particularly useful in cases when the researches are interested in the level of association between sets of variables or relationship within a single set (Hardoon, 2004). The essence of canonical analysis is the formation of pairs of linear combinations of the predictor and criterion variables in such a way as to maximize the correlation between each pair. In order to make the process of canonical correlation analysis clearer it is suggested to compare it with other, more familiar, statistical techniques.
First, Factor analysis serves to identify commonalities among the variables within a single set of variables. Canonical correlation analysis similarly to factor analysis uses of sets of weights to transform the variables into linear combinations. In both cases, it is possible to use the weights to interpret the meaning of the linear combinations.
Second, Multiple regression analysis is a statistical tool for relating several independent variables to a single dependent variable. Similarly, canonical analysis is dealing with identifying relationships between independent and dependent variables (Van de Geer JP, 1971).
However, canonical analysis overcomes many of the limitations performed by other statistical tools. Dissimilar to simple bi-variate correlation, canonical correlation analysis handles two sets of data instead of two variables. Contrary to uni-variate multiple regression, canonical analysis is not restricted to a single criterion variable Contrasting factor analysis, canonical correlation analyzes relationships between sets of data rather than within one set.
Figure 2
Proposed research model
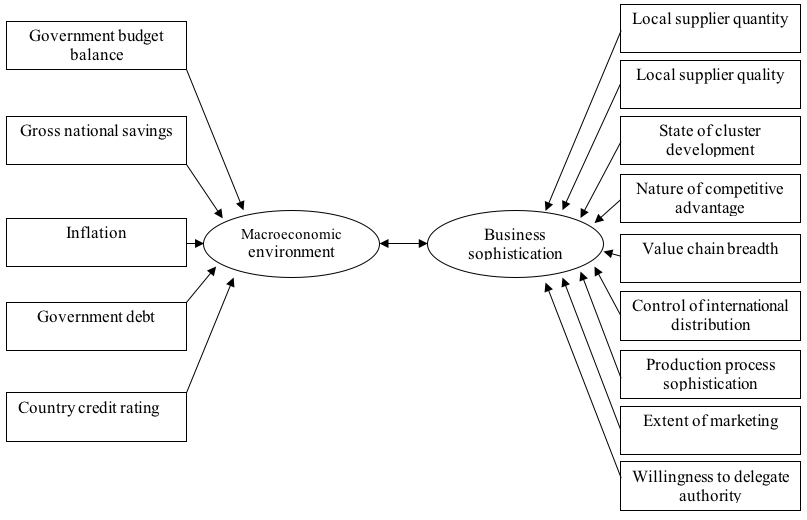
According to Figure 2, the research questions were identified as follows:
In the framework of the current study the descriptive- correlation study and the data provided by WEF GCI report 2016-2017 were utilized.
Canonical correlation analysis (CCA) employed as the main research method within the present study was introduced by Hotelling (1936) to measure relationships between sets of dependent variates. It is especially useful tool when the researches are interested in the level of association between sets of variables or relationship within a single set (Anderson, 2003).
After conducting an appropriate literature review the research questions were formulated. In order to answer the research questions set the sample was identified. According to the research questions the sample consists of the population of 102 countries covered by WEF GCI report 2016-2017, as well as a separate canonical correlation analysis was done for each stage of economical development, namely:
In total 3 canonical correlation analyses were fulfilled.
Data published by World Economic Forum in GCI report 2016-2017 is used as the secondary data resource for the current research.
In the framework of the current study the sub-index scores of "Business Sophistication" and " Macroeconomic environment" pillars were analyzed. The population of the study consists of 138 countries classified according to The Global Competitiveness Report 2016-2017 (Schwab, 2016:38) into five groups corresponding to the stage of their development.
The correlation between two sets of "Business Sophistication" and "Macroeconomic environment" was evaluated by means of XLSTAT software (version 19.5). In order to answer the sub-questions set in the study the Canonical Correlation analysis (CCA) was employed.
Thus, answering the first sub-question (Based on the Global Competitiveness Report’s Data, is there a pertinent relationship between macroeconomic environment and business sophistication?) a meaningful correlation between sub-indexes of considered pillars was found in the significance level of 0.05.
For the first category identified by WEF as Factor-driven economies consisting of 35 countries the correlation matrix of 'Macroeconomic environment' and 'Business sophistication' sub-indexes is reflected in the following table:
Table 3
Correlation matrix of 'Macroeconomic environment' and
'Business sophistication' sub-indexes (Factor-driven economies)
|
Macroeconomic environment |
||||
Business sophistication |
Government budget balance |
Gross national savings |
Inflation |
Government debt |
Country credit rating |
Local supplier quantity |
-0,250 |
0,137 |
-0,247 |
-0,069 |
0,476 |
Local supplier quality |
-0,133 |
0,261 |
0,065 |
0,007 |
0,548 |
State of cluster development |
-0,161 |
0,265 |
0,012 |
-0,088 |
0,529 |
Nature of competitive advantage |
-0,138 |
0,148 |
0,002 |
-0,167 |
0,384 |
Value chain breadth |
-0,263 |
0,259 |
0,015 |
-0,117 |
0,594 |
Control of international distribution |
-0,207 |
0,223 |
-0,197 |
-0,169 |
0,317 |
Production process sophistication |
-0,088 |
0,285 |
-0,108 |
-0,088 |
0,613 |
Extent of marketing |
-0,288 |
0,152 |
0,256 |
0,081 |
0,647 |
Willingness to delegate authority |
-0,244 |
-0,282 |
-0,251 |
-0,313 |
0,175 |
The most powerful overall effect has the 'Extent of marketing' among 'Business sophistication' sub-indexes and 'Country credit rating' among 'Macroeconomic environment' sub-indexes.
The strongest correlation is between 'Extent of marketing' and 'Country credit rating'. Whereas, the least correlation is found between 'Nature of competitive advantage' and 'Inflation'.
Interestingly, 'Government budget balance' sub-index has negative correlation with all 'Business sophistication' sub-indexes, while the strongest negative correlation is set with 'Extent of marketing'.
The 'Country credit rating' sub-index has the most correlation with all 'Business sophistication' sub-indexes.
The correlation among 'Macroeconomic environment' sub-indexes of Factor-driven economies is displayed in the following table:
Table 4
Correlation matrix of 'Macroeconomic environment'
sub-indexes (Factor-driven economies)
'Macroeconomic environment' sub-indexes |
Government budget balance |
Gross national savings |
Inflation |
Government debt |
Country credit rating |
Government budget balance |
1 |
0,241 |
0,129 |
0,337 |
-0,065 |
Gross national savings |
0,241 |
1 |
0,033 |
0,243 |
0,393 |
Inflation |
0,129 |
0,033 |
1 |
0,305 |
0,149 |
Government debt |
0,337 |
0,243 |
0,305 |
1 |
0,031 |
Country credit rating |
-0,065 |
0,393 |
0,149 |
0,031 |
1 |
The most prominent influence on other 'Macroeconomic environment' sub-indexes has the 'Government debt'. The maximum correlation coefficient among 'Macroeconomic environment' sub-indexes is set between 'Country credit rating' and 'Gross national savings' at the level of 0.393.
The minimum positive correlation (0.031) is between 'Country credit rating' and 'Government debt' and the negative one (-0.065) is in pair of 'Country credit rating' and 'Government budget balance'.
The correlation among 'Business sophistication' sub-indexes of Factor-driven economies is reflected in this table:
Table 5
Correlation matrix of 'Business sophistication' sub-indexes (Factor-driven economies)
'Business sophistication' sub-indexes |
Local supplier quantity |
Local supplier quality |
State of cluster development |
Nature of competitive advantage |
Value chain breadth |
Control of international distribution |
Production process sophistication |
Extent of marketing |
Willingness to delegate authority |
Local supplier quantity |
1 |
0,627 |
0,429 |
0,379 |
0,481 |
0,472 |
0,552 |
0,445 |
0,456 |
Local supplier quality |
0,627 |
1 |
0,523 |
0,675 |
0,745 |
0,506 |
0,741 |
0,636 |
0,429 |
State of cluster development |
0,429 |
0,523 |
1 |
0,685 |
0,713 |
0,539 |
0,602 |
0,617 |
0,483 |
Nature of competitive advantage |
0,379 |
0,675 |
0,685 |
1 |
0,814 |
0,767 |
0,731 |
0,396 |
0,455 |
Value chain breadth |
0,481 |
0,745 |
0,713 |
0,814 |
1 |
0,706 |
0,839 |
0,707 |
0,476 |
Control of international distribution |
0,472 |
0,506 |
0,539 |
0,767 |
0,706 |
1 |
0,782 |
0,231 |
0,465 |
Production process sophistication |
0,552 |
0,741 |
0,602 |
0,731 |
0,839 |
0,782 |
1 |
0,515 |
0,417 |
Extent of marketing |
0,445 |
0,636 |
0,617 |
0,396 |
0,707 |
0,231 |
0,515 |
1 |
0,473 |
Willingness to delegate authority |
0,456 |
0,429 |
0,483 |
0,455 |
0,476 |
0,465 |
0,417 |
0,473 |
1 |
As can be concluded from data provided in the Table 8, the strongest correlation is observed between 'Production process sophistication' and 'Value chain breadth' with the coefficient equaling 0.839. Meanwhile the least correlation (0.231) is in 'Control of international distribution' and 'Extent of marketing' pair.
Noticeably, all 'Business sophistication' sub-indexes have positive correlation only. And the most impactful towards all the rest sub-indexes is 'Value chain breadth'.
The second stage of economies development is qualified by WEF GCI report as Efficiency-driven economies. The correlation analysis between for 'Macroeconomic environment' and 'Business sophistication' sub-indexes for Efficiency-driven economies is demonstrated in the following table:
Table 6
Correlation matrix of 'Macroeconomic environment' and
'Business sophistication' sub-indexes (Efficiency-driven economies)
|
Macroeconomic environment |
||||
Business sophistication |
Government budget balance |
Gross national savings |
Inflation |
Government debt |
Country credit rating |
Local supplier quantity |
0,541 |
-0,085 |
0,166 |
0,310 |
0,370 |
Local supplier quality |
0,639 |
0,018 |
0,181 |
0,188 |
0,306 |
State of cluster development |
0,502 |
0,298 |
0,582 |
0,181 |
0,517 |
Nature of competitive advantage |
0,462 |
0,628 |
0,183 |
-0,0001 |
0,478 |
Value chain breadth |
0,571 |
0,144 |
0,264 |
0,157 |
0,374 |
Control of international distribution |
0,393 |
0,247 |
0,373 |
0,257 |
0,492 |
Production process sophistication |
0,476 |
0,212 |
0,170 |
0,157 |
0,427 |
Extent of marketing |
0,442 |
-0,255 |
0,247 |
0,237 |
0,216 |
Willingness to delegate authority |
0,504 |
0,074 |
0,328 |
0,357 |
0,577 |
As can be concluded, the most impactful among 'Business sophistication' sub-indexes is 'State of cluster development' and among 'Macroeconomic sub-indexes - 'Government budget balance'.
The correlation reaches its highest point (0.639) in 'Local supplier quality' and 'Government budget balance' pair, while the minimum is observed in ' Willingness to delegate authority' and "Gross national savings' pair (0.074).
All the correlation coefficients found are positive, except for 'Nature of competitive advantage' and 'Government debt' (-0.0001), and 'Extent of marketing and ' Gross national savings' (-0.255).
The same analysis was conducted for the rest two categories of economies.
The correlation coefficients identified among 'Macroeconomic environment' sub-indexes for Efficiency-driven economies are shown in Table 7.
The data provided suggests that all the 'Macroeconomic environment' sub-indexes have positive correlation only. The most correlation is set by 'Country credit rating' sub-index. The maximum and minimum correlation coefficients are found between 'Country credit rating' and 'Government debt', and 'Government debt' and 'Government budget balance', equaling to 0.725 and 0.004 respectively.
Table 7
Correlation matrix of 'Macroeconomic environment' sub-indexes (Efficiency-driven economies)
'Macroeconomic environment' sub-indexes |
Government budget balance |
Gross national savings |
Inflation |
Government debt |
Country credit rating |
Government budget balance |
1 |
0,211 |
0,354 |
0,004 |
0,245 |
Gross national savings |
0,211 |
1 |
0,526 |
0,292 |
0,656 |
Inflation |
0,354 |
0,526 |
1 |
0,089 |
0,509 |
Government debt |
0,004 |
0,292 |
0,089 |
1 |
0,725 |
Country credit rating |
0,245 |
0,656 |
0,509 |
0,725 |
1 |
Table 8 reflects the data on correlations among 'Business sophistication' sub-indexes for Efficiency-driven economies.
Table 8
Correlation matrix of 'Business sophistication'
sub-indexes (Efficiency-driven economies)
'Business sophistication' sub-indexes |
Local supplier quantity |
Local supplier quality |
State of cluster development |
Nature of competitive advantage |
Value chain breadth |
Control of international distribution |
Production process sophistication |
Extent of marketing |
Willingness to delegate authority |
Local supplier quantity |
1 |
0,680 |
0,679 |
0,188 |
0,631 |
0,543 |
0,568 |
0,665 |
0,541 |
Local supplier quality |
0,680 |
1 |
0,617 |
0,357 |
0,847 |
0,845 |
0,862 |
0,783 |
0,633 |
State of cluster development |
0,679 |
0,617 |
1 |
0,555 |
0,699 |
0,685 |
0,582 |
0,481 |
0,609 |
Nature of competitive advantage |
0,188 |
0,357 |
0,555 |
1 |
0,528 |
0,425 |
0,536 |
-0,069 |
0,419 |
Value chain breadth |
0,631 |
0,847 |
0,699 |
0,528 |
1 |
0,814 |
0,815 |
0,687 |
0,670 |
Control of international distribution |
0,543 |
0,845 |
0,685 |
0,425 |
0,814 |
1 |
0,917 |
0,633 |
0,634 |
Production process sophistication |
0,568 |
0,862 |
0,582 |
0,536 |
0,815 |
0,917 |
1 |
0,570 |
0,622 |
Extent of marketing |
0,665 |
0,783 |
0,481 |
-0,069 |
0,687 |
0,633 |
0,570 |
1 |
0,638 |
Willingness to delegate authority |
0,541 |
0,633 |
0,609 |
0,419 |
0,670 |
0,634 |
0,622 |
0,638 |
1 |
All correlations set among 'Business sophistication' sub-indexes are positive, except for 'Nature of competitive advantage' and 'Extent of marketing' where the correlation coefficient is negative (-0.069).
The most impact on all sub-indexes had 'Local supplier quality' and 'Value chain breadth'.
The maximum and minimum correlation coefficients are discovered between 'Production process sophistication' and 'Control of international distribution' (0.917), and 'Nature of competitive advantage' and 'Local supplier quantity' (0.188).
The highest stage of economic development is acknowledged by WEF as Innovation-driven economies.
The data on correlations between and among 'Macroeconomic environment' and 'Business sophistication' sub-indexes is represented in Tables 9, 10, 11.
Table 9
Correlation matrix of 'Macroeconomic environment' and
'Business sophistication' sub-indexes (Innovation-driven economies)
|
Macroeconomic environment |
||||
Business sophistication |
Government budget balance |
Gross national savings |
Inflation |
Government debt |
Country credit rating |
Local supplier quantity |
-0,100 |
0,218 |
0,028 |
-0,141 |
0,312 |
Local supplier quality |
0,353 |
0,476 |
0,290 |
0,104 |
0,768 |
State of cluster development |
0,218 |
0,438 |
0,280 |
0,087 |
0,694 |
Nature of competitive advantage |
0,315 |
0,500 |
0,151 |
-0,055 |
0,577 |
Value chain breadth |
0,202 |
0,407 |
0,186 |
-0,163 |
0,539 |
Control of international distribution |
0,154 |
0,438 |
0,229 |
0,139 |
0,715 |
Production process sophistication |
0,234 |
0,527 |
0,304 |
-0,018 |
0,783 |
Extent of marketing |
0,307 |
0,488 |
0,266 |
0,210 |
0,695 |
Willingness to delegate authority |
0,443 |
0,436 |
0,242 |
0,349 |
0,621 |
The most influential among 'Macroeconomic environment' sub-indexes is 'Country credit rating', and among 'Business sophistication' sub-indexes (Innovation-driven economies) - 'Willingness to delegate authority'.
The maximum correlation (0.783) is found between 'Production process sophistication' and 'Country credit rating', while the least is between 'Local supplier quantity' and 'Inflation' (0.028).
The highest negative correlation is observed between 'Local supplier quantity' and 'Government debt' (-0.141).
Table 10
Correlation matrix of 'Macroeconomic environment' sub-indexes (Innovation-driven economies)
'Macroeconomic environment' sub-indexes |
Government budget balance |
Gross national savings |
Inflation |
Government debt |
Country credit rating |
Government budget balance |
1 |
0,619 |
0,202 |
0,436 |
0,429 |
Gross national savings |
0,619 |
1 |
0,260 |
0,399 |
0,604 |
Inflation |
0,202 |
0,260 |
1 |
0,069 |
0,252 |
Government debt |
0,436 |
0,399 |
0,069 |
1 |
0,342 |
Country credit rating |
0,429 |
0,604 |
0,252 |
0,342 |
1 |
The 'Gross national savings' sub-index is recognized to be as the most impactful.
All correlations among 'Macroeconomic environment' set are positive. The highest correlation coefficient is between 'Gross national savings' and 'Government budget balance' (0.619), whereas the least is between 'Government debt' and ' Inflation' (0.069).
Table 11
Correlation matrix of 'Business sophistication' sub-indexes (Innovation-driven economies)
'Business sophistication' sub-indexes |
Local supplier quantity |
Local supplier quality |
State of cluster development |
Nature of competitive advantage |
Value chain breadth |
Control of international distribution |
Production process sophistication |
Extent of marketing |
Willingness to delegate authority |
Local supplier quantity |
1 |
0,324 |
0,474 |
0,303 |
0,478 |
0,337 |
0,278 |
0,404 |
-0,017 |
Local supplier quality |
0,324 |
1 |
0,644 |
0,753 |
0,670 |
0,770 |
0,814 |
0,723 |
0,597 |
State of cluster development |
0,474 |
0,644 |
1 |
0,713 |
0,857 |
0,681 |
0,756 |
0,752 |
0,474 |
Nature of competitive advantage |
0,303 |
0,753 |
0,713 |
1 |
0,869 |
0,684 |
0,827 |
0,683 |
0,512 |
Value chain breadth |
0,478 |
0,670 |
0,857 |
0,869 |
1 |
0,715 |
0,806 |
0,723 |
0,409 |
Control of international distribution |
0,337 |
0,770 |
0,681 |
0,684 |
0,715 |
1 |
0,882 |
0,810 |
0,535 |
Production process sophistication |
0,278 |
0,814 |
0,756 |
0,827 |
0,806 |
0,882 |
1 |
0,750 |
0,587 |
Extent of marketing |
0,404 |
0,723 |
0,752 |
0,683 |
0,723 |
0,810 |
0,750 |
1 |
0,622 |
Willingness to delegate authority |
-0,017 |
0,597 |
0,474 |
0,512 |
0,409 |
0,535 |
0,587 |
0,622 |
1 |
'Production process sophistication' has the most correlation with all other sub-indexes in the 'Business sophistication' set. The extremums are identified in pairs of 'Production process sophistication' and 'Control of international distribution' (0.882), and 'Production process sophistication' and 'Local supplier quantity' (0.278).
The only negative correlation coefficient is found between 'Willingness to delegate authority' and 'Local supplier quantity' (-0.017).
Economic growth represents a resultant of productive and economically efficient factor endowments. During the past decade, characterized by the globalization era, the economic competition among countries has considerably increased. Firstly highlighted by Michael Porter, the concept of Competitiveness has drawn tremendous attention of both scholars and governors aiming to portray a consensus leading to financial and economical stability of their country as well as to keeping their markets competitive. In order to enable national economies achieving sustainable economic growth and long-term prosperity, the World Economic Forum started publishing its annual Global Competitiveness Index Reports since 1979.
This paper aimed to investigate the interaction between the two sets of “Business Sophistication” and “Macroeconomic Environment” as the two basic pillars of national competitiveness; none of which have been profoundly investigated before.
The conducted research suggests that there is a pertinent relationship between “Macroeconomic environment” and “Business sophistication” pillars.
According to the set of “Macroeconomic environment” and “Business sophistication” sub-indexes some of them have the most while others have the least influence on creating a correlation between considered pillars.
The stage of economic development of the countries classified by WEF into 3 main categories (Factor-driven, Efficiency-driven, Innovation-driven) makes a pertinent influence on the correlation between “Macroeconomic environment” and “Business sophistication” sub-indexes.
Even though our research findings attest that there is meaningful relationship between Business Sophistication and Macroeconomic environment, the study itself faces some limitations. Considering the fact that the fundamental outcome is to improve competitiveness of the countries mentioned in this study; leading ultimately to flourish economic growth and seek long-term prosperity; Business Sophistication and Macroeconomic Environment embody various intangible aspects and inter-temporal phenomenon which are not necessarily taken into account in the sub-indexes of the Global Competitiveness Report.
The study lacks the analysis of the economies at two transition stages. Also, the research is based on the statistical analysis of secondary data, provided by WEF GCI report for 2016-2017, but ever changing economic conjuncture supposes conducting of new researches as the data becomes available. Despite the use of a tremendous amount of criteria in this study, incorporating heterogeneous statistical data, the Canonical Correlation Analysis suffers from several analytical and structural deficiencies failing to discover the possible non-linear relationships hidden in the data, prejudicing consequently the accuracy and the reliability of the results.
Aiginger, K. (2006). Competitiveness: From a Dangerous Obsession to a Welfare Creating Ability with Positive Externalities. Journal of Industry, Competition and Trade, 6(2), 161-177. doi:10.1007/s10842-006-9475-6
Anderson, T. W. (2003). An introduction to multivariate statistical analysis. Hoboken, NJ: Wiley-Interscience.
Cooke, P. (2014). Re-framing regional development: Evolution, innovation and transition. London: Routledge.
Fischer, S. (1993). The Role of Macroeconomic Factors in Growth. doi:10.3386/w4565
Hardoon, D. R., Szedmak, S., & Shawe-Taylor, J. (2004). Canonical Correlation Analysis: An Overview with Application to Learning Methods. Neural Computation, 16(12), 2639-2664. doi:10.1162/0899766042321814
Hotelling, H. (1936). Relations between Two Sets of Variates. Biometrica, 28, 312-377.
Huggins, R., & Izushi, H. (2011). Competition, Competitive Advantage, and Clusters. doi:10.1093/acprof:oso/9780199578030.001.0001
Ketels, C. H., Porter, M. E., & Großbritannien. (2003). UK competitiveness: Moving to the next stage. London: DTI.
Krugman, P. (1994). Competitiveness: A Dangerous Obsession. Foreign Affairs, 73(2), 28. doi:10.2307/20045917
Martin, R., Kitson, M., & Tyler, P. (2011). Regional competitiveness. London: Routledge.
Organisation for Economic Co-operation and Development. (2009). Sector Specific Sources of Competitiveness in the Western Balkans: Recommendation for a Regional Investment Strategy. Paris: OECD Publishing.
Organisation for Economic Co-operation and Development. (2016). Competitiveness in South East Europe: A Policy Outlook. Paris: OECD Publishing.
Porter, M. E. (1998). The competitive advantage of nations: With a new introduction. Hampshire: Palgrave.
Porter, M. E. (1998). Clusters and the New Economics of Competition. Harvard Business Review, 76(6), 77-90.
Porter, M. E. (2003). The economic performance of regions. Regional Studies, 37(6/7), 549-578.
Porter, M. E. (2014). On competition. Boston (MA: Harvard Business School Publishing.
Porter, M. E., & Linde, C. V. (1995). Toward a New Conception of the Environment-Competitiveness Relationship. Journal of Economic Perspectives, 9(4), 97-118. doi:10.1257/jep.9.4.97
Porter, M. E., Schwab, K., & Lopez-Claros, A. (2005). The Global Competitiveness Report 2005-06: Policies Underpinning Rising Prosperity. New York: Palgrave Macmillan.
Schwab, K. (2009). The global competitiveness report 2009–2010. Geneva: World Economic Forum.
Schwab, K. (2016). The global competitiveness report 2016–2017. Geneva: World Economic Forum.
Sykes, M., & Organització de Cooperació i Desenvolupament Econòmic. (2004). Understanding economic growth: Macro-level, industry-level, firm-level. Basingstoke: Palgrave Macmillan.
Thorndike, R. M. (2000). Canonical Correlation Analysis. Handbook of Applied Multivariate Statistics and Mathematical Modeling. Retrieved from http://max2.ese.u-psud.fr/epc/conservation/livres/Handbook%20of%20Applied%20Multivariate%20Statistics%20and%20Mathematical%20Modeling.pdf
Van de Geer JP. (1971). Introduction to Multivariate Analysis for the Social Sciences. San Francisco: W. W. Freeman.
The World Bank. (2017). Doing Business. Retrieved from http://www.doingbusiness.org
World Economic Forum, & Organisation for Economic Co-operation and Development. (2011). Competitiveness and private sector development: Eastern Europe and South Caucasus 2011 : competitiveness outlook
1. Eurasian National University, Astana, Kazakhstan, PhD, Associate professor. Email: kamshatmussina@mail.ru
2. University Rabat-Agdal, Morocco, PhD candidate. Email: bachisse.mohamed@gmail.com