![]() ISSN 0798 1015
ISSN 0798 1015

![]() ISSN 0798 1015
ISSN 0798 1015
 Vol. 39 (Nº22) Year 2018. Page 5
Valentina N. IVANOVA 1; Alexander L. TATOCHENKO 2; Gregory V. JAZEV 3; Natalia A. ZAITSEVA 4; Anna A. LARIONOVA 5; Natalia O. VIKHROVA 6
Received: 02/03/2018 • Approved: 02/04/2018
ABSTRACT: The aim of the study is to estimate the current state and perspectives for the development of a food industry sectors - the meat industry of the Russian Federation. In the process of studying the raised problem, methods of economic-statistical and regression analysis, the state regulation experience generalization of the meat industry development, and the method of expert assessments were applied. The article considers and summarizes statistical data on the state and perspectives of the Russian meat industry development. According to calculations based on resource balances, it is justified that in the last decade and a half the production in the meat industry has grown significantly, so that the country's food security in meat has been ensured, and its consumption by the population has reached the level corresponding to rational norms. The use of regression analysis to estimate the perspectives for the food industry development in the Russian Federation made it possible to conclude that by 2020 Russia will have an excess of pork and poultry production, but that there will still be a deficit of beef. The article suggests ways of solving this problem by improving import and export policy, with special attention paid to expanding production and export of biologically active substances based on deep processing of poultry meat. |
RESUMEN: El objetivo del estudio es evaluar el estado actual y las perspectivas para el desarrollo de uno de los sectores de la industria alimentaria: la industria cárnica de la Federación de Rusia. El estudio del problema, los métodos de análisis económico y estadístico y de regresión, que resume la experiencia de la regulación estatal del desarrollo de la industria de la carne, el método de evaluaciones de expertos. El artículo considera y resume datos estadísticos sobre el estado y las perspectivas del desarrollo de la industria cárnica rusa. Como resultado de la liquidación de estas saldos de recursos se justifica que en la última década y media de los volúmenes de producción en la industria de la carne han aumentado significativamente, lo que contribuyó a garantizar la seguridad alimentaria del país sobre la carne y llevarla al nivel de consumo de la población de acuerdo a las normas racionales. El uso de análisis de regresión para estimar las perspectivas de desarrollo de la industria de la alimentación de la Federación de Rusia llevó a la conclusión de que en 2020 Rusia será un exceso de producción de carne de cerdo y aves de corral, pero mantener la escasez de carne. El documento sugiere maneras de resolver este problema mediante la mejora de las políticas de importación y exportación, con especial atención a la expansión de la producción y exportación de sustancias biológicamente activas sobre la base de la transformación profunda de los procesos de aves de corral. |

Meat and meat products play an important role in human nutrition, so it is natural that the growth of their production and consumption in the last decade has become a stable world trend. Thus, according to the World Food and Agriculture Organization of the United Nations (FAO), world meat production in 2005-2016 increased from 244.4 million tons to 301.1 million tons, in 1,23 times. As a result, in 2015 the world average per capita consumption of meat approached 34 kg, and according to the forecast FAO will reach the level of 35.5 kg by 2025 (FAO, 2017).
For the noted phenomenon, two features are characteristic:
• the most pronounced growth trend was manifested in the countries of South-East Asia with developing economies - China, India, etc.,
The highest growth rates were recorded in the production of poultry meat. (FAO, 2015). The problem of providing the population of the Russian Federation (RF) with meat was decided at the state policy level, - incl.by providing state support to the development of livestock and poultry (State program for the development of agriculture and regulation, 2012; Tikhonov & Tatochenko, 2015).
At the same time, it is obvious that the development of the meat industry should be based on the use of scientifically grounded calculations of the forecast for the development of this industry. Therefore, the relevance of this area of research is obvious. In addition to receiving forecasts of meat industry development in the Russian Federation it is also important to determine the direction to eliminate disparities in order to provide food security of the country, as well as improving quality of life
The methodological basis of this study was the work in the field of food security and forecasting the development of the food industry. To analyze the development of innovatively active organizations in Russia, the authors of the article used methods of economic-statistical and regression analysis, the method of expert assessments. Original information for the analysis were the official statistics (Rosstat, 2016).
The use of these methods made it possible to identify the main development tendencies and the main difficulties that impede the effective meat industry development in the Russian Federation, to justify the need for systematic integrated state support for the meat industry development.
Based on the use of materials from the official website of the Federal State Statistics Service (Rosstat), the authors of the article implemented a main results study of the policy implementation dynamics, in particular: indicators of meat production, output and consumption, dependence of the field on import, export perspectives, etc. Rosstat on its website annually and quarterly updates the balance sheet food resources, incl. meat and meat products. Based on this information, the authors made an analysis of the raw materials supply of the food industry meat sector.
Table 1
Availability and expenditure of resources in the meat sector of the food industry
№ п/п |
Indicators |
2001 |
2002 |
2003 |
2004 |
2005 |
2006 |
2007 |
2008 |
2009 |
2010 |
2011 |
2012 |
2013 |
2014 |
2015 |
2016 |
1 |
Available resources, kt |
7 462 |
7 980 |
8 284 |
8 394 |
8 658 |
9 084 |
9 643 |
10 249 |
10 383 |
10 826 |
11 029 |
11 591 |
11 863 |
11 892 |
11 732 |
11 957 |
2 |
Stocks at the beginning of the year, kt |
431 |
550 |
623 |
643 |
592 |
650 |
676 |
733 |
744 |
804 |
802 |
791 |
838 |
870 |
807 |
812 |
3 |
The share in the structure of disposable resources, % |
5,8 |
6,9 |
7,5 |
7,7 |
6,8 |
7,2 |
7,0 |
7,2 |
7,2 |
7,4 |
7,3 |
6,8 |
7,1 |
7,3 |
6,9 |
6,8 |
4 |
Production, kt |
4 477 |
4 733 |
4 993 |
5 046 |
4 972 |
5 259 |
5 790 |
6 268 |
6 720 |
7 167 |
7 520 |
8 090 |
8 545 |
9 070 |
9 565 |
9 899 |
5 |
Percentage of available resources, % |
60,0 |
59,3 |
60,3 |
60,1 |
57,5 |
57,9 |
60,1 |
61,2 |
64,7 |
66,2 |
68,2 |
69,8 |
72,0 |
76,3 |
81,5 |
82,8 |
6 |
Import, kt |
2 554 |
2 697 |
2 668 |
2 705 |
3 094 |
3 175 |
3 177 |
3 248 |
2 919 |
2 855 |
2 707 |
2 710 |
2 480 |
1 952 |
1 360 |
1 246 |
7 |
The share in the structure of disposable resources, % |
34,2 |
33,8 |
32,2 |
32,2 |
35,7 |
34,9 |
32,9 |
31,6 |
28,1 |
26,4 |
24,5 |
23,4 |
20,9 |
16,4 |
11,6 |
10,4 |
8 |
Use of resources, kt |
6 912 |
7 357 |
7 641 |
7 802 |
8 008 |
8 409 |
8 910 |
9 505 |
9 579 |
10 024 |
10 238 |
10 753 |
10 999 |
11 085 |
10 920 |
11 153 |
9 |
Production, consumption, kt |
56 |
65 |
67 |
61 |
54 |
52 |
55 |
45 |
41 |
37 |
36 |
56 |
51 |
56 |
47 |
49 |
10 |
Share in the structure of the resources used, % |
0,8 |
0,9 |
0,9 |
0,8 |
0,7 |
0,6 |
0,6 |
0,5 |
0,4 |
0,4 |
0,4 |
0,5 |
0,5 |
0,5 |
0,4 |
0,4 |
11 |
Losses, kt |
16 |
17 |
17 |
15 |
16 |
13 |
16 |
17 |
18 |
19 |
17 |
23 |
19 |
18 |
18 |
17 |
12 |
Share in the structure of the resources used, % |
0,2 |
0,2 |
0,2 |
0,2 |
0,2 |
0,2 |
0,2 |
0,2 |
0,2 |
0,2 |
0,2 |
0,2 |
0,2 |
0,2 |
0,2 |
0,2 |
13 |
Export, thousand t |
38 |
34 |
36 |
43 |
67 |
57 |
65 |
90 |
65 |
97 |
76 |
128 |
117 |
135 |
143 |
236 |
14 |
Share in the structure of the resources used, % |
0,5 |
0,5 |
0,5 |
0,6 |
0,8 |
0,7 |
0,7 |
0,9 |
0,7 |
1,0 |
0,7 |
1,2 |
1,1 |
1,2 |
1,3 |
2,1 |
15 |
Personal consumption, kt |
6 802 |
7 241 |
7 521 |
7 683 |
7 871 |
8 287 |
8 774 |
9 353 |
9 455 |
9 871 |
10 109 |
10 546 |
10 812 |
10 876 |
10 712 |
10851 |
16 |
Share in the structure of the resources used, % |
98,5 |
98,4 |
98,4 |
98,4 |
98,3 |
98,5 |
98,5 |
98,4 |
98,7 |
98,5 |
98,7 |
98,1 |
98,3 |
98,1 |
98,1 |
97,3 |
17 |
Stocks at the end of the year, kt |
550 |
623 |
643 |
592 |
650 |
675 |
733 |
744 |
804 |
802 |
791 |
838 |
864 |
807 |
812 |
804 |
18 |
Increment of reserves for the year, kt |
119 |
73 |
20 |
-51 |
58 |
25 |
57 |
11 |
60 |
-2 |
-11 |
47 |
26 |
-63 |
5 |
-8 |
19 |
The share of imports in the use of resources, % |
37,0 |
36,7 |
34,9 |
34,7 |
38,6 |
37,8 |
35,7 |
34,2 |
30,5 |
28,5 |
26,4 |
25,2 |
22,5 |
17,6 |
12,5 |
11,2 |
20 |
Population, million people. |
146,3 |
145,2 |
145,0 |
144,3 |
143,8 |
143,2 |
142,8 |
142,8 |
142,7 |
142,9 |
142,9 |
143,0 |
143,3 |
143,7 |
146,3 |
146,5 |
21 |
Average per capita consumption, kg |
46,5 |
49,9 |
51,9 |
53,2 |
54,7 |
57,9 |
61,4 |
65,5 |
66,3 |
69,1 |
70,7 |
73,7 |
75,4 |
75,7 |
73,2 |
74,1 |
22 |
The proportion of rational consumption, % |
63,7 |
68,4 |
71,1 |
72,9 |
74,9 |
79,3 |
84,1 |
89,7 |
90,8 |
94,7 |
96,8 |
101,0 |
103,3 |
103,7 |
100,3 |
101,5 |
(compiled by the authors based on Rosstat data).
Analysis of the statistical data of Table 1 allows us to draw the following preliminary conclusions:
1. Meat production in the period under review was characterized by a stable positive dynamic, which provided an increase of 2.21 times in relation to the base year 2001, which corresponds to an average annual growth rate of 105% (line 4). The production growth allowed to increase (by 1.60 times) the volume of available resources (line 1). The volumes of import supplies decreased more than 2 times (line 6).The share of production in the structure of available resources increased by 21.6 percentage points ( pp ), reaching 82.8%, while the share of imports decreased to 10.4% (decrease by 22 pp ) - line 5 and 7. The share of reserves (line 3) fluctuated insignificantly - within 5.8% -7.4%, the calculated mathematical expectation of the indicator was 7.05%, the standard deviation was 0.41%, and the coefficient of variation was 0.050. Considering, we can take, in the first approximation, that in the balance of meat resources reserves constitute a conditionally constant share of 7%.
2. The increase in the availability of resources was accompanied by an increase in their use by 1.61 times (line 8). At the same time, the largest share in the structure of resource use was characterized by personal consumption - 98.5% -97.3% (line 16). The absolute value of the indicator (line 15) thus increased from 6802 to 10851 thousand tons, i.е. in 1,59 times, that corresponds to an average annual growth rate of 103%. The share of production consumption was within the range of 0.9% -0.4% with a downward trend (line 10). The share of losses remained constant - at the level of 0.2%. The share of exports increased 4.2 times and reached the level of 2.1%.
3. Throughout the time interval under consideration, there has been a steady increase in per capita consumption of meat products (line 21), which, by 2012, achieved the rational consumption rate recommended by the Ministry of Health of the Russian Federation (MoH) - 73 kg (Recommendations on rational norms for the consumption of food that meet modern requirements for healthy eating, 2016). At the same time the population in the period of 2001-2009 declined, and starting from 2010 - increased, leveling in 2016 with the value of the base year 2001 (line 20). Thus, the achievement of a rational consumption rate for meat was ensured by an increase in its production, and not by a decrease in the population.
4. The share of imports in the use structure of domestic market resources decreased to 11.2% by 2016 (line 19), which practically corresponds to the fulfillment of food security criterion (the share of own resources is at least 90%). In total in the reporting period, the share of imports decreased by 25.8 points (on average - by 1.8 percentage points per year), especially the rate decreased in 2014 and 2015 - by 5 points annually, which is obviously connected with the launch of the import substitution policy in 2014.
The absolute priority of any social state (and Russia incl.) is to ensure a balanced diet full of all segments of the population, incl. socially unprotected (Ivanova, Tikhonov & Tatochenko, 2016a). The Ministry of Health in the Russian Federation has established rational consumption norms not only for meat products in general, but also for individual components of the diet. Therefore per capita consumption of beef should be 20 kg, pork - 18 kg, poultry - 31 kg, lamb -31 kg.
It is of interest to assess the possibilities of fulfilling these norms through production alone, i.e. without attracting imports and using reserves. It should be borne in mind that analysis is possible only in the first three components, as since 2011 Rosstat does not include lamb in the balance of commodity resources (Balance of commodity resources of individual goods 2001-2016). The corresponding materials are presented in Table 2.
Table 2
Meat consumption, provided exclusively by production
№ |
Indicators |
2001 |
2002 |
2003 |
2004 |
2005 |
2006 |
2007 |
2008 |
2009 |
2010 |
2011 |
2012 |
2013 |
2014 |
2015 |
2016 |
1 |
Population, million people. |
146,3 |
145,2 |
145,0 |
144,3 |
143,8 |
143,2 |
142,8 |
142,8 |
142,7 |
142,9 |
142,9 |
143,0 |
143,3 |
143,7 |
146,3 |
146,5 |
2 |
Meat production in carcass weight, thousand tons |
4477 |
4733 |
4993 |
5046 |
4990 |
5278 |
5790 |
6268 |
6789 |
7167 |
7519 |
8090 |
8544 |
9070 |
9565 |
9899 |
3 |
Average per capita consumption by production, kg |
30,6 |
32,6 |
34,4 |
35,0 |
34,7 |
36,9 |
40,5 |
43,9 |
47,6 |
50,1 |
52,6 |
56,6 |
59,6 |
63,1 |
65,4 |
67,6 |
4 |
Share from rational norm of consumption of meat, % |
41,9 |
44,7 |
47,1 |
47,9 |
47,5 |
50,5 |
55,5 |
60,1 |
65,2 |
68,6 |
72,1 |
77,5 |
81,6 |
86,4 |
89,6 |
92,6 |
5 |
Pork-production, kt |
1515 |
1608 |
1743 |
1686 |
1569 |
1699 |
1930 |
2042 |
2169 |
2331 |
2428 |
2560 |
2816 |
2974 |
3099 |
3368 |
6 |
The share in the structure of total meat production, % |
33,8 |
34,0 |
34,9 |
33,4 |
31,4 |
32,2 |
33,3 |
32,6 |
31,9 |
32,5 |
32,3 |
31,6 |
33,0 |
32,8 |
32,4 |
34,0 |
7 |
Average per capita consumption by production, kg |
10,3 |
11,1 |
12,0 |
11,7 |
10,9 |
11,9 |
13,5 |
14,3 |
15,2 |
16,3 |
17,0 |
17,9 |
19,6 |
20,7 |
21,2 |
23,0 |
8 |
Share from rational norms of consumption of pork, % |
57,5 |
61,5 |
66,8 |
64,9 |
60,6 |
65,9 |
75,1 |
79,4 |
84,4 |
90,6 |
94,4 |
99,5 |
109,2 |
115,0 |
117,7 |
127,7 |
9 |
Beef-production, thousand tons |
1879 |
1967 |
2002 |
1954 |
1809 |
1722 |
1699 |
1769 |
1741 |
1727 |
1625 |
1642 |
1633 |
1654 |
1649 |
1619 |
10 |
The share in the structure of total meat production, % |
42,0 |
41,6 |
40,1 |
38,7 |
36,3 |
32,6 |
29,3 |
28,2 |
25,6 |
24,1 |
21,6 |
20,3 |
19,1 |
18,2 |
17,2 |
16,4 |
11 |
Average per capita consumption by production, kg |
12,8 |
13,5 |
13,8 |
13,5 |
12,6 |
12,0 |
11,9 |
12,4 |
12,2 |
12,1 |
11,4 |
11,5 |
11,4 |
11,5 |
11,3 |
11,0 |
12 |
Share from rational norm of consumption of beef, % |
64,2 |
67,7 |
69,0 |
67,7 |
62,8 |
60,1 |
59,5 |
61,9 |
61,0 |
60,4 |
56,8 |
57,4 |
57,0 |
57,5 |
56,4 |
55,2 |
13 |
Poultry meat-production, kt |
886 |
956 |
1048 |
1192 |
1388 |
1632 |
1925 |
2217 |
2555 |
2847 |
3204 |
3625 |
3831 |
4161 |
4536 |
4621 |
14 |
The share in the structure of total meat production, % |
19,8 |
20,2 |
21,0 |
23,6 |
27,8 |
30,9 |
33,2 |
35,4 |
37,6 |
39,7 |
42,6 |
44,8 |
44,8 |
45,9 |
47,4 |
46,7 |
15 |
Average per capita consumption by production, kg |
6,1 |
6,6 |
7,2 |
8,3 |
9,6 |
11,4 |
13,5 |
15,5 |
17,9 |
19,9 |
22,4 |
25,3 |
26,7 |
29,0 |
31,0 |
31,5 |
16 |
Share of rational consumption rate of poultry meat, % |
19,5 |
21,2 |
23,3 |
26,6 |
31,1 |
36,8 |
43,5 |
50,0 |
57,8 |
64,3 |
72,3 |
81,8 |
86,2 |
93,4 |
100,0 |
101,7 |
17 |
The production of pork, beef and poultry meat, thousand tons |
4280 |
4531 |
4793 |
4832 |
4766 |
5053 |
5554 |
6028 |
6465 |
6905 |
7257 |
7827 |
8280 |
8789 |
9284 |
9608 |
18 |
The share in the structure of total meat production, % |
95,6 |
95,7 |
96,0 |
95,8 |
95,5 |
95,7 |
95,9 |
96,2 |
95,2 |
96,3 |
96,5 |
96,7 |
96,9 |
96,9 |
97,1 |
97,1 |
(compiled by the authors based on Rosstat data).
According to Table 2, the following conclusions can be drawn:
1. The total share of pork, beef and poultry in the structure of total meat production throughout the time interval under review has changed only slightly - within 95.2% -97.1% (line 18). The calculated mathematical expectation of the indicator is 96.2%, the standard deviation is 0.59%, and the coefficient of variation is 0.006. Porcine share also remained relatively constant - 31.4% -34.0%, mathematical expectation - 32.9%, standard deviation - 0.93%, coefficient of variation - 0.028 (line 6). In the first approximation, both parameters can be characterized by conventionally constant values of 96% and 33% respectively.
2. Ratio of beef reduced stably from 42, 0% to 16.4% (a decrease of 25.6 points or 2.5 6 times.) - line 10. On the other hand, the proportion of poultry steadily grew from 19.8% to 46.7% (an increase of 26.9 percentage points, or 2.36 times) - line 18.
3. Production in absolute terms demonstrated positive dynamics in pork and poultry meat (lines 5 and 13), and for beef - negative (line 9). In detail, this aspect will be considered in the future, for the time being it can be stated that by 2016 domestic production can provide per capita consumption of pork at the level of 127.7% of the rational rate, poultry - 101.7%, and beef - 55.2% (lines 8, 12, 16). The latter indicator indicates a serious systemic problem in the meat industry associated with the livestock of cattle, the consequences of which are also manifested in dairy subcomplex.
Materials in Table 2 allow us to estimate the dynamics of production in 2001-2016 by calculating growth rates for individual years, as well as average annual growth rates over the entire time interval. The calculated values of the average annual indicator are the same for meat as a whole - 1.054, for pork - 1.055, for beef - 0.990 and for poultry - 1.116 (in relative units). Growth rate data and their deviations from the average values are presented in table 3. The tabulated data indicate that the highest rate of growth in the total production of meat were 2007-2008, pork - in 2007 and 2013, beef - in 2002-2003 and poultry - in 2005-2007 (lines 2,4,6 and 8). Initiated in 2014 the import substitution policy was designed to increase the output of domestic agricultural products, respectively, one would expect the rate of growth of production in the period 2014-2016. However, according to the tabular data, the most successful in this indicator was 2007.
Table 3
ndicators of the dynamics of production of basic types of meat
№ |
Indicators |
2001 |
2002 |
2003 |
2004 |
2005 |
2006 |
2007 |
2008 |
2009 |
2010 |
2011 |
2012 |
2013 |
2014 |
2015 |
2016 |
1 |
Meat production-growth rates. |
--- |
1,057 |
1,055 |
1,011 |
0,985 |
1,058 |
1,101 |
1,082 |
1,072 |
1,066 |
1,049 |
1,076 |
1,056 |
1,061 |
1,055 |
1,035 |
2 |
The deviation from the annual average growth rate 2001-2016 |
--- |
0,003 |
0,001 |
-0,043 |
-0,069 |
0,004 |
0,047 |
0,028 |
0,018 |
0,012 |
-0,005 |
0,022 |
0,002 |
0,007 |
0,001 |
-0,019 |
3 |
Pork production-growth rate, |
--- |
1,061 |
1,084 |
0,967 |
0,931 |
1,083 |
1,136 |
1,058 |
1,062 |
1,075 |
1,042 |
1,054 |
1,100 |
1,056 |
1,042 |
1,087 |
4 |
The deviation from the annual average growth rate 2001-2016 |
--- |
0,006 |
0,029 |
-0,088 |
-0,124 |
0,028 |
0,081 |
0,003 |
0,007 |
0,020 |
-0,013 |
-0,001 |
0,045 |
0,001 |
-0,013 |
0,032 |
5 |
Beef production-growth rate |
--- |
1,047 |
1,018 |
0,976 |
0,926 |
0,952 |
0,987 |
1,041 |
0,984 |
0,992 |
0,941 |
1,010 |
0,994 |
1,013 |
0,997 |
0,982 |
6 |
The deviation from the annual average growth rate 2001-2016 |
--- |
0,057 |
0,028 |
-0,014 |
-0,064 |
-0,038 |
-0,003 |
0,051 |
-0,006 |
0,002 |
-0,049 |
0,020 |
0,004 |
0,023 |
0,007 |
-0,008 |
7 |
Production of poultry meat-growth rates, |
--- |
1,079 |
1,096 |
1,137 |
1,164 |
1,176 |
1,179 |
1,152 |
1,152 |
1,114 |
1,125 |
1,131 |
1,057 |
1,086 |
1,090 |
1,019 |
8 |
The deviation from the annual average growth rate 2001-2016 |
--- |
-0,037 |
-0,02 |
0,021 |
0,048 |
0,060 |
0,063 |
0,036 |
0,036 |
-0,002 |
0,009 |
0,015 |
-0,059 |
-0,03 |
-0,026 |
-0,097 |
More detailed information on the meat production dynamics can be obtained on the basis of regression equations, in which the output variable is the annual output in kind (thousand tons), and the input variable is the corresponding years ( 2001-1, 2002-2, 2003-3 and .). The results of the corresponding calculations are presented in Table 4 and in Fig 1.
Table 4
Regression equations production, thousand tons (Y) - year (X)
№ |
Product range regression |
regression Equation |
determination Coefficient the |
Pearson correlation Coefficient |
1 |
Meat in General |
У1(Х) = 379, 46*Х + 3538,2 |
0,967 |
0,983 |
2 |
Poultry meat |
У2(Х) = 275,27*Х + 199,23 |
0,982 |
0,991 |
3 |
Pork |
У3(Х) = 121,77*Х +1186,10 |
0,936 |
0,967 |
4 |
Beef |
У4(Х) = -24,04*Х +1960,10 |
0,775 |
0,880 |
-----
Figure 1
Calculation of regression equations for meat production by years, thousand tons
(row 1 - meat in general, row 2 - poultry meat, row 3 - pork, beef, row 4 - beef)
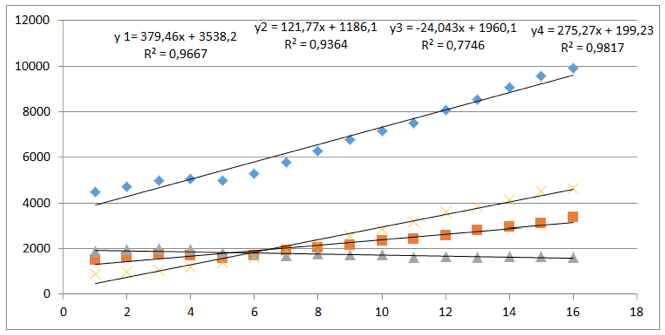
It can be seen that the Simple Linear Regression equation are characterized by high values of the coefficients of determination (all - above 0.75), i.e. they describe the behavior of output variables with a sufficient degree of determination (Valentinov, 2009). The Pearson correlation coefficients are close to unity, which confirms the linearity of the equations. The temporary series were analyzed for 15 periods, therefore the forecast with acceptable accuracy from the regression equations can be obtained with anticipation for no more than 5 periods. We calculate the forecast values of the output variables for 2020, which corresponds to the anticipation for 4 periods (X = 20):
E 1 (20) = 379, 46 * 20 + 3538.2 = 11127.4
E 2 (20) = 275.27 * 20 + 199.23 = 5704.6
E 3 (20) = 121.77 * 20 + 1186.10 = 3621.5
E 4 (20) = -24.04 * 20 +1960.10 = 1479.3
Calculations show that with the total production of three main types of meat products will be 10805.4 thousand tons, or 97.1% of the total meat production. Shares of components in the production structure will be equal for pork - 32.5%, for beef - 13.3%, for poultry - 51.3%. This result is in good agreement with the data of Table 2 according to which the sum share of three major products, as well as pork, maintains relatively stable, the percentage of poultry is growing and beef is decreasing.
Assuming that the population will not change significantly by 2020 (in 2016 - 146.5 million people), we calculate the average per capita consumption provided by production (excluding reserves and imports) - Table 5.
Table 5
Forecasted consumption of meat in the Russian Federation in 2020, provided by production (excluding exports and stocks)
№ п/п |
Significative |
Meat in General |
Pork |
Beef |
Poultry meat |
1 |
Production, kt |
11127,4 |
3621,5 |
1479,3 |
5704,6 |
2 |
Average per capita consumption, kg |
75,9 |
24,7 |
10,1 |
38,9 |
3 |
Relation to the rational norm of consumption, % |
104,0 |
137,2 |
50,5 |
125,5 |
4 |
The need for products within the rational norms of consumption, kt |
10694,5 |
2637,0 |
2930,0 |
4541,5 |
5 |
Surplus ( + ) /deficit ( - ) of products, kt |
+432,9 |
+984,5 |
-1450,7 |
1161,1 |
6 |
The price of meat products on the world markets in 2017, USD./t |
--- |
2920,8 |
3828,7 |
1613,6 |
7 |
Export/import revenues/costs in excess / deficit, mill. USD |
--- |
+2875,5 |
-5554,2 |
1873,5 |
From the calculations in Table 5, it can be seen that if the existing trends continue, by 2020, there will be a significant excess of poultry and pork meat and a deficit of beef (line 5). An operative solution to the problem of increasing the number of cattle is unlikely, the payback period of the respective projects is 10 years or more, therefore rational norms of beef consumption in the near and medium term will be achieved through imports. At the same time, in order to maintain the foreign trade balance, foreign exchange earnings from the export of pork and poultry meat must provide purchasing beef from imports. World prices for the corresponding types of products in 2017 (line 6) were significantly different. Given the occupation of export niches in the world food market, it is possible to obtain revenues from the sale of pork and poultry surplus of $ 2.875 billion and $ 1.874 billion, respectively, totaling $ 4.748 billion (line 7). However, this will not be enough to ensure the purchase of beef for imports, the deficit of financial resources will be $ 805 million.
Despite the fact that this rough estimation calculation is made in the prices of 2017, it quite correctly reflects the existing state. Beef is an expensive resource, and the compensation for its imports through the export of raw materials is inappropriate. The most acceptable approach seems to be the deep processing products export of meat raw materials. In the world practice, three main directions of meat products deep processing are distinguished: fodder, food and production of biologically active preparations, incl. for medical purposes. The latter direction is especially relevant in the Russian context of poultry products excess. Thus, from the hearts of pen and chicken, it is possible to produce cytochrome C , a medical preparation that prevents the development of oxygen starvation in the body tissues. From the bile of geese and chickens, chenodeoxycholic acid is used to dissolve stones in the bile duct and human liver etc. The need for these drugs on the world market is practically unlimited, and their cost is several levels higher than that of the raw materials. (Agroarchive, 2014). Currently, many leading Russian scientific centers are engaged in the problems of deep processing of agricultural raw materials, incl. - Moscow State University of Technology and Management of KG Razumovsky (Ivanova, Tikhonov & Tatochenko, 2016b).
In conclusion, we should pay attention to the dynamics of imports coverage by exports in the meat industry. According to the data of Table 1, in 2001 the value of the indicator was 0.022 (import - 2919 thousand tons, export - 65 thousand tons). By 2016, the coverage increased 8.6 times - to 0.189 (imports - 1246 thousand tons, exports - 236 thousand tons). According to the forecast, by 2020 the indicator could increase to 0.85 (import - 5554.2 thousand tons, exports - 4749.0 thousand tons - table 5, line 7). The data given above testify about the undoubted improvements in the economic performance of this industry. Traditionally, the positions of the Russian Federation are quite strong in the export of grain crops (especially wheat), as well as vegetable oils (Rosstat, 2017), but taking into account the trends identified, the prospect of occupying a worthy place among meat exporters seems quite real.
Issues of food security have been repeatedly examined by a number of authors, both in our country and abroad (Ivanov & Mayorova, 2014).
The authors of this article also repeatedly published articles on certain aspects of the problems on import substitution and food security G.V. Yazev, 2016; V.N. Ivanova, D.A. Tikhonov & A.L. Tatochenko, 2016; G.L. Rudenko et al., 2017; N.O. Vikhrova, 2012; K.G. Erdyneeva et al. (2016), A.A. Lubnina et al. (2016), D.A. Tikhonov & A.L. Tatochenko (2015), G.M. Kvon et al. (2017).
The results of this study represent a continuation and further development in studying the current problems of the Russian food industry in general and the meat industry in particular, in the changed external political and economic conditions.
The main contribution of this article to the development of research in the field of ensuring national economy food security is to assess the current state of the meat industry development in the Russian Federation. It is built with reference to the most relevant official data provided by Rosstat (at the end of 2017, Rosstat had official data only for 2016). In addition, based on the application of regression analysis, the authors provided a forecast for the development prospects of the meat industry of the Russian Federation with recommendations for eliminating the identified disproportions.
Based on the results of the study, the following conclusions can be drawn:
1. The meat industry of the Russian Federation in the last decade and a half has been dynamically developing. Production volumes grew by an average of 5% annually, therefore by 2016 the country's food security for meat was met (meeting the domestic market's own production needs by 90%), and a rational average per capita consumption rate (73 kg) was achieved.
2. In the balance structure of meat and meat products in the Russian Federation, there are several indicators that preserve stability over long periods of time. These include: the share of reserves (about 7%), the share of pork in total meat production (about 33%), and the total share of pork, beef and poultry meat in total meat production (about 96%). In addition, the share of losses when using resources is 0.2%. Other components of the balance sheet are subject to significant changes in time.
3. The production of the most important three types of meat products in the Russian Federation is characterized by multidirectional trends: if there is sustained growth in pork and poultry meat, there is a long-term decline in beef for beef, although not very intensively grown (average annual growth rate is 0.990). At the same time, the production of poultry meat grew at an especially high rate (the average annual growth rate was 1,116), which is in good agreement with the global trend.
4. The forecast on the regression equations obtained because the resource balance data shows that by 2020 the Russian Federation will have an excess of pork and poultry production, while consumption levels can reach 137% and 125% of rational norms. For beef, on the contrary, there will be a shortage of resources, while the level of consumption provided by own resources will amount to 50% of the rational norm. As a result, in the medium term, Russia will remain the importer of beef. It is advisable to compensate for the currency costs of imports by exporting surplus meat from pigs and poultry. On this indicator, Russia achieved significant progress, exporting in 2016 236 thousand tons of meat products (coverage of imports by exports - 0.189). A significant additional economic effect can be brought about by the start-up of processes of deep processing of meat products with the subsequent export of the biologically active substances obtained, incl. for medical purpose.
Balance of commodity resources of individual goods (types of products). (2018). URL: http://www.gks.ru/wps/wcm/connect/rosstat_main/rosstat/ru/statistics/publications/catalog/doc_1264687799516 (date of access: 12.01.2018).
Balance of resources and use of meat and meat products by the Russian Federation. (2017). URL: http://gks.ru/free_doc/new_site/import-zam/2- 3.xls (date of access: 22.11.2017).
Erdyneeva, K. G., Vasilyeva, K. K., Krysova, E. V., Zaitseva, N. A. & Marfina, L. V. (2016). The mechanism of state regulation of regional services markets as an Imperial to reduce territorial social-economic disorders. International Review of Management and Marketing, 6(2), 274-280.
Ivanov, G. & Mayorova, E. (2014). Business reputation and trade efficiency. Economic Annals-XXI, 1(2), 54-57.
Ivanova, V. N., Tikhonov, D. A. & Tatochenko, A. L. (2016a). MGUTU of K.G. Razumovsky - an effective link between the cluster "Social Nutrition - Moscow" and the technological platform "Storage and processing - 2030". Economic sciences, 9(142), 44-48.
Ivanova, V. N., Tikhonov, D. A. & Tatochenko, A. L. (2016b). On the clarification of the cost estimate of domestic food aid in the Moscow region, or "food map" - the price of the issue. Economic science, 5(138). 44-48.
Kvon, G.M., Lushchik, I.V., Karpenko, M.A., Zaitseva, N.A., Kulkov, A.A., Galushkin, A.A. & Yakupova, N.M. (2017). Regional investment policy: Analysis and assessment of the investment environment state. Eurasian Journal of Analytical Chemistry, 12(5), 835-853.
Lubnina, A. A., Shinkevich, M. V., Ashmarina, S. I., Zaitseva, N. A., Sayfutdinova, G. B. & Ishmuradova, I. I. (2016). Resource saving innovative forms of the industrial enterprises. International Journal of Economics and Financial Issues, 6(2), 479-483.
Processing of poultry products. Agroarchive (2014). URL: http:// agro-archive.ru/tehnologicheskie-osnovy/694-pererabotka-produkcii-pticevodstva.html (date of access: 12.11.2017).
Recommendations on rational norms for the consumption of food that meet modern requirements for healthy eating. (2016). Approved by Order of the Ministry of Health of the Russian Federation of August 19, 2016. URL: https://webcache.googleusercontent.com/search?q=cache:SK8ueUnkzhAJ:https://cyberleninka.ru/article/n/tipologiya-regionov-tsentralnoy-rossii-po-pokazatelyam-proizvodstva-kurinyh-yaits-na-dushu-naseleniya.pdf+&cd=2&hl=ru&ct=clnk&gl=r-u&client=opera
Rosstat. (2017). Official site of the Federal State Statistics Service. URL: http:// www.gks.ru (date of access: 12.11.2017).
Rudenko, L. G., Karaulov, V. M., Zaitseva, N. A., Larionova, A. A. & Chizhik, A. S. (2017). Methodology development for rating the infrastructure support of small business in the regions. Man in India, 97(14), 11-20.
State program for the development of agriculture and regulation of markets for agricultural products, raw materials and food for 2013-2020. (2012). Approved by the Decree of the Government of the Russian Federation of 14.07.2012 717. URL: https://gain.fas.usda.gov/Recent%20GAIN%20Publications/Agriculture%20Development%20Program%202013-2020_Moscow_Russian%20Federation_11-6-2012.pdf
The official website of the Food and Agriculture Organization of the United Nations (FAO) (2017). URL: http://www.fao.org/home/en / (date of access: 12.01.2018).
The state of agricultural markets: 2015-2016. FAO. (2015). The State of Agricultural. Commodity Markets. Trade and food security: achieving a better balance between national priorities and the collective good. Rome. URL: http://www.fao.org/3/a-i5090e.pdf
Tikhonov, D. A. & Tatochenko., A. L. (2015). Formation of clusters of social nutrition as a form of support for domestic agricultural producers in the context of Russia's membership in the WTO. Economic sciences, 4(125), 69-74.
Valentinov, V. A. (2009). Econometrics. Textbook. M .: "Dashkov and K". 9. Pork: prices, analytics, trading - URL: http:// https://www.pigprice.ru/news/tag/2/5407-mirovye-ceny-na-svininu (date of access: 22.11.2017).
Vikhrova, N. O. (2012). Forecasting the development of small businesses based on the process approach. The economy in the industry, 1, 2-29.
Yazev, G. V. (2016). Problems of ensuring the export of oil-bearing crops in the modern Russian agribusiness. Economic sciences, 10(143), 43-45.
1. Department of the Economy of Small and Medium Business, Moscow State University of Technologies and Management named after K. G. Razumovsky (First Cossack University), Moscow, Russia. Contact e-mail: rektorat@mgutm.ru
2. Department of the Economy of Small and Medium Business, Moscow State University of Technologies and Management named after K. G. Razumovsky (First Cossack University), Moscow, Russia
3. Department of the Economy of Small and Medium Business, Moscow State University of Technologies and Management named after K. G. Razumovsky (First Cossack University), Moscow, Russia.
4. Department of Hospitality, Tourism and Sports Industry, Plekhanov Russian University of Economics, Moscow, Russia.
5. Department of Economic Security, Audit and Controlling, The Kosygin State University of Russia (Technology. Design. Art), Moscow, Russia
6. Department of Economics, National University of Science and Technology «MISiS», Moscow, Russia.