![]() ISSN 0798 1015
ISSN 0798 1015

![]() ISSN 0798 1015
ISSN 0798 1015
Vol. 39 (Number 24) Year 2018 • Page 35
F.I. MIRZABALAEVA 1; V.G. KVACHEV 2; O.D. KUKSOVA 3
Received: 03/02/2018 • Approved: 28/02/2018
ABSTRACT: The relevance of this study is determined by the need to group the Russian regions according to the level of labor market depressiveness. The purpose of this article is to test the methodology for determining the depressiveness of the labor market (as a case study of Russian regions using statistical data for 2010-2016), followed by clusterization on the basis of Kohonen maps. The leading method of the research is the clusterization of regional labor markets based on self-organizing Kohonen maps applying the methods of modeling socio-economic indicators, as well as methods for statistical processing and analysis of quantitative results. The research results: Clusterization of Russian regions was carried out for 2010-2016 on the basis of the revealed interrelations of seven indicators (employment rate; overall unemployment rate (according to the ILO methodology); average job search duration; percentage of job seekers searching for a job for 12 months; average nominal monthly wages; labor market tension index, the region’s socio-economic development rating). The specifics of the methodology for determining clusters using Kohonen maps is based on the identification of internal interrelationships of a large array of statistical information determining the depressiveness of regional labor markets. The significance of the study: The research showed the adequacy of the methodology for clustering regional labor markets proposed by the authors in terms of the level of depressiveness. The findings can be used to formulate and implement a regional employment policy. This method allows for constant monitoring of the situation in the labor markets; and shaping the state employment policy in the regions promptly and flexibly. |
RESUMEN: La relevancia de este estudio está determinada por la necesidad de agrupar las regiones rusas de acuerdo con el nivel de depresión del mercado de trabajo. El propósito de este artículo es probar la metodología para determinar la depresión del mercado de trabajo (como un estudio de caso de las regiones rusas que utilizan datos estadísticos para 2010-2016), seguido de la agrupación en función de los mapas de Kohonen. El método principal de la investigación es la agrupación de los mercados laborales regionales basada en mapas Kohonen autoorganizados que aplican los métodos de modelado de indicadores socioeconómicos, así como métodos para el procesamiento estadístico y el análisis de resultados cuantitativos. Los resultados de la investigación: Clusterización de las regiones rusas se llevó a cabo para 2010-2016 sobre la base de las interrelaciones reveladas de siete indicadores (tasa de empleo, tasa de desempleo general (según la metodología de la OIT), duración media de búsqueda de empleo, porcentaje de solicitantes de empleo buscando para un trabajo por 12 meses, salario nominal mensual promedio, índice de tensión del mercado laboral, calificación de desarrollo socioeconómico de la región). Los detalles de la metodología para determinar clusters utilizando mapas de Kohonen se basan en la identificación de interrelaciones internas de una gran variedad de información estadística que determina la depresión de los mercados laborales regionales. La importancia del estudio: La investigación mostró la idoneidad de la metodología para agrupar los mercados laborales regionales propuesta por los autores en términos del nivel de depresión. Los hallazgos pueden usarse para formular e implementar una política regional de empleo. Este método permite un monitoreo constante de la situación en los mercados laborales; y dar forma rápida y flexible a la política estatal de empleo en las regiones. |

The classification of labor markets in terms of their socio-economic state should inevitably form the basis of the state employment policy. It is precisely this classification that is the most convenient instrument of managerial influence. The employment policy is diversified according to the parameters of the labor markets, and certain instruments of state regulation can be applied in the context of the social and economic situation. Such collection of information should be institutionalized in the form of a monitoring system for information in the labor market (for example European economic scientists use Labor Monitoring Information System, LMIS) (Larsen et al., 2009).
The foreign practice of managing certain territories, whose labor markets are in a state of depressiveness, is especially relevant in this context. These regional labor markets need the greatest degree of external stimulation and government intervention.
The authors have systematized the data of seven above-mentioned indicators of the regional labor markets for 2010-2016, detailing the results for 2016, based on Kohonen maps. Clusters for 2016 were characterized by significant indicators (which were decisive in the cluster formation). The authors also revealed the relationship between clusters by a generalizing indicator, which makes it possible to determine the closeness of clusters to the situation in labor markets.
Hypothesis: the authors assumed that there is an objective methodology for clusterization of regional labor markets in terms of the depressiveness level, enabling to periodically explore regional labor markets and determine the significant changes in its development. In the future, it is expected to reveal the relationship between the depressiveness of regions and of its labor markets.
The objective and tasks include the statistical base systematization on the basis of indicators chosen for the regions’ clusterization, practical approval of the methodology for determining the labor market depressiveness on the basis of Kohonen maps, identification of non-obvious patterns, and determination of relationships within and between the clusters. This objective implies the solution of the following particular tasks: determination of the indicators used as a basis for determining the labor market depressiveness, clusterization of regional labor markets by the depressiveness level based on Kohonen maps on the Deductor analytical platform, identification of the relationship between and within the clusters, determination of the directions for reducing depressiveness in the regional labor markets.
High indicators of labor market tension, in our view, are one of the main criteria for the region’s depressiveness. However, to characterize the crisis situations in the labor market, the term ‘territories with a tense situation in the labor market’ is most often used. The category of the ‘depressed region’ got the most widespread use, high unemployment, low employment, low living standards of the population of the region, etc. being its mandatory characteristics.
One of the first publications in the field of depressed territories belongs to V. Leksin and A. Shvetsov (2001), they noted the debatable and undeveloped nature of the criteria for referring to depressed territories (a significant economic slowdown and a decrease in the standard of living of the population in Russia became an all-territorial but internally heterogeneous phenomenon) and distinguished two of their types: regions temporarily experiencing the stage of socio-economic decline, which will naturally be replaced by a stage of revitalization due to the mobilization of internal reserves of the territory and regions that are in a stagnant state, the prospects for an exit from which are exclusively related to external impacts. The depressed territories of the second type, according to the researchers, need extraordinary state support, because here the rates, scale and duration of the economic slowdown, a decline in living standards, rising unemployment, deteriorated demographic situation and other parameters are higher all over Russia.
However, the methods for identifying the regions with depressed labor markets are strongly depend on the national employment policy and state instruments of statistical analysis of the labor market. Moreover, at the global level, there are no conventional instruments for measuring these indicators. Different countries use different indicators for assigning regional labor markets to different categories; there are various methods of ranking and classification; various measures are proposed to manage territories with depressed labor markets.
In the foreign science depressed labor markets and their classification are investigated in great detail. Among the existing studies that are interesting for us in terms of their scientific development, only a few should be mentioned. First of all, this is a qualitative study of T.F. Bewley, (1995) devoted to the sociological analysis of the experience of participants in the depressed market (employees and employers). Furlong and coauthors (2017) devoted their monograph to the study of the situation of young people in the depressed labor markets. One cannot ignore the studies conducted for many years by the European Network of Regional Labor Market Monitoring (EN RLMM), for example, a monograph dealing with the problem of obtaining information on the regional labor markets in the context of state regulation (Larsen et al., 2017).
The lack of homogeneity of the countries and regional labor markets actively stimulates research on their heterogeneity, clusterization, segmentation and classification (Huber, 2008). Some foreign studies reveal also the topic of geographical segmentation of situations in the labor markets of the regions (Martin & Morrison, 2003).
A number of researchers abroad develop a so-called ‘cluster theory’ in the context of the classification of labor markets. The following related studies can be distinguished, concerning the peculiarities of the classification of regional labor markets: a cluster analysis of country situations with the level of economic development and regulation of labor markets (Muntaner et al., 2012); a mathematical cluster analysis of regional labor markets (Blien & Hirschenauer, 2017); a cluster analysis of the Slovenian researcher M. Ignjatovic (2000), who divided the European labor markets into four groups, depending on the nature of the state employment policy and the labor market situation; a comprehensive analysis of the peculiarities of clusters of regional labor markets conducted by a group of specialists based on microdata (Álvarez de Toledo et al., 2017); the criticism of the cluster approach to the classification of labor markets should also be emphasized (Asheim et al., 2006).
First of all, let us consider the availability of information resources that are necessary for the analysis. In Germany, the Federal Employment Agency has been classifying regional labor markets since 2004 to assess the performance of its employment offices (Blien et al., 2006). Regression analysis is used to evaluate regional labor markets. The so-called ‘integration level’ is introduced as a resultant variable, which is calculated as follows. At the first step, the integration rate (IR) is calculated as a quotient of the sum of the quality factors of the regional labor markets and the potential of the sum of all participants in the labor market. Then regression analysis is carried out, within the framework of which the following variables are taken: the average annual unemployment rate, the influence of seasonal factors on the labor market, the share of unskilled labor market workers, the share of tertiary employment, the share of employment in small enterprises, etc. The choice of these variables is dictated by the state priorities in the development of regional labor markets.
The second stage includes the cluster analysis, which results in the breakdown of all regions into 12 types (see Figure 1):
The analysis results are visualized and can be presented as follows (Dauth, 2016):
Figure 1
Classification of regional labor markets by the ‘integration rate’
(Statistical data of the Federal Employment Agency of Germany, 2013)
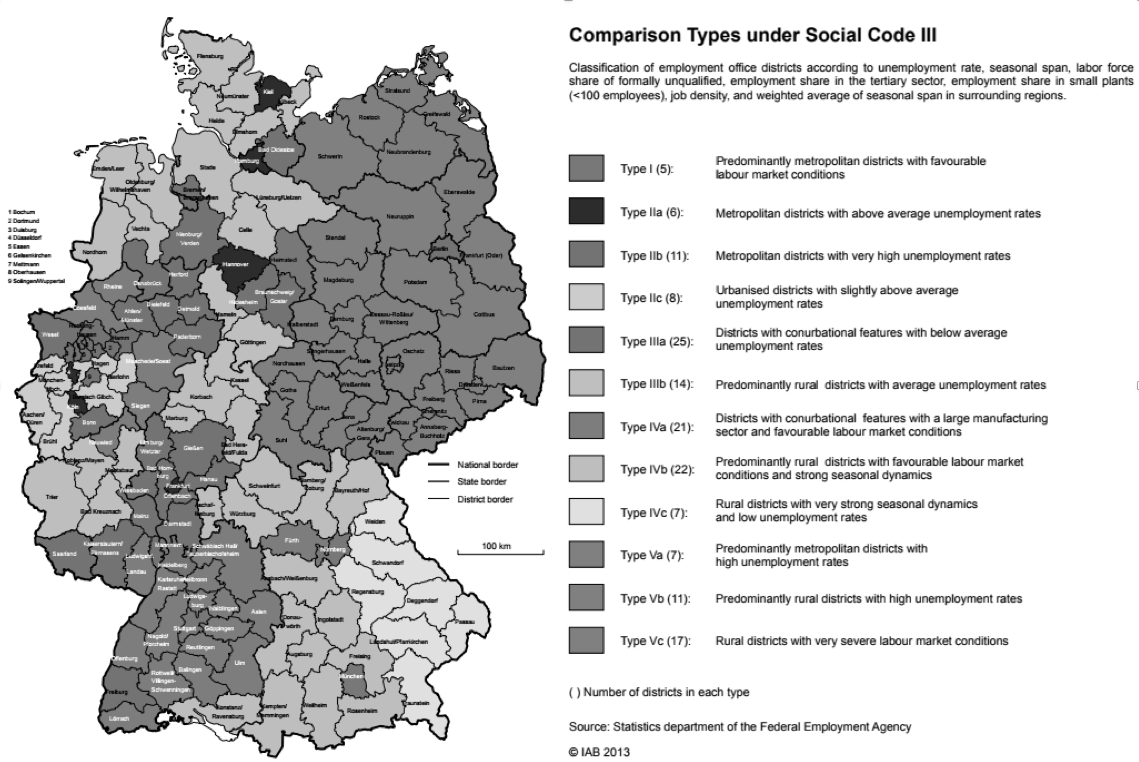
Apparently, such an analysis allows breaking down regional labor markets rather accurately according to the similarity of the market situation and unite them into some clusters on the basis of the proposed classification. Although the analysis does not directly address the problem of depressed labor markets, it is obvious that this category overlaps with those regions that refer to types V in the presented classification – the districts with a high share of unemployment and a tense situation in the labor market.
In Sweden, the system for classification of regional labor markets was proposed by the Center for Regional Science at Umeå University (Carlsson et al., 1993). The essence of the approach is that it proposes to single out zones of labor markets (labor market areas) rather on the basis of their actual local economic parameters than proceeding from the administrative division. The size of the territory; number of the employees; number of employees within 50 km of the administrative center of the territory; the proportion of the population with more than 12 years of education; the proportion of the population with technical education; the proportion of the population employed in the public services sector; the proportion of the population employed in industry; the proportion of the population employed in the private tertiary sector; the total share of employees in the three largest companies within the territory; the proportion of employees in the largest industrial company within the territory are taken as variables of the initial analysis.
Using these parameters, the specialists of the Center for Regional Science conducted a cluster analysis and identified ten employment zones (E-zones) – types of regional labor markets. They divided 284 municipalities in 24 regions into 10 E-zones. According to the authors of the study, these zones reflected the level of stability of the supply-demand ratio in the labor market. The singled out zones became the basis for monitoring the degree of the labor market development. The regional labor markets with a tense situation were identified within this classification.
The experience in the classification of regional labor markets, conducted in Serbia by a group of researchers from the University of Belgrade is of particular interest (Arandarenko & Jovicic, 2007). The researchers used a comprehensive approach, having analyzed 21 parameters in the aggregate, and used parameters not directly related to the labor market, such as per capita GDP, the share of foreign investment, the proportion of young people (under 18 years old), the level of illiteracy, etc., in addition to the traditional parameters of the labor market state, such as the unemployment rate. Based on this, the scholars conducted segmentation of the regional labor markets in two ways: the current situation in the labor market and potential for a positive change in the situation.
Thus, four clusters of regional labor markets were identified: a positive current state and a high probability of positive development dynamics (I); negative current state and high probability of positive development dynamics (I); negative current status and low probability of positive dynamics of development (III); positive current status and low probability of positive dynamics of development (IV).
Eurostat collects information on subregional labor markets in the countries of the European Union (Eurostat, 2017). The four main groups of parameters are analyzed: the composition of the workforce; employment level; employment parameters; unemployment rate.
However, these parameters are not summarized in the form of a generalized classification of types of labor markets, although they are of great interest for the study of regional labor markets. In general, the information provided by the Eurostat monitoring would be sufficient to draw up such a classification.
At the EU level, the project of the CRISP research center of the University of Milan-Bicocca for monitoring labor markets using Big Data is another notable practice. The developed WoLMIS system automatically collects data from the job portals and aggregates them by type of occupations, skills and territories (Boselli et al., 2017). The information is aggregated in real time and allows monitoring the situation in the regional labor markets, and also enables to refine the information up to the level of individual settlements in the presence of information on the employer’s territorial position. The system reflects the actual dynamics of the labor markets, as it records demand for labor in real time. At the moment, the system is used to develop recommendations on public employment policies. It should also be noted that access to the system is limited to the employees of the CRISP research center, therefore, it is currently not possible to use such information for the segmentation of labor markets. However, the potential parameters of this information, combined with the analysis of official statistical information could be useful for the further researches.
As can be seen from the presented information, the labor market classification systems differ substantially enough depending on the national approaches to the accounting for the parameters of the state of the labor markets. Accordingly, approaches to the collection of information in the depressed labor markets are differentiated, as well. Despite this, there is a potential in this area for integrating scientifically substantiated approaches aimed at developing a unified labor market classification system, especially involving depressed labor markets.
Let us dwell on various approaches to the category of ‘depressed regions’, which, in our view, should clarify the system of indicators characterizing depression in the region as a whole and in the labor market in particular. The Russian regions are significantly differentiated in terms of development, the reasons for which are different, including structural shifts in the economy, a decrease in the competitiveness of the region’s main products, the disintegration of the existing division and cooperation of labor, etc. It is interesting, in our opinion, that the methodological basis that determines the depressiveness of the region is very limited.
The authors believe that the situation in the labor market should be assessed more adequately through the category ‘the regional labor market depressiveness’, which takes into account the impact of the state of the region’s economy. Paul Krugman points out that a depression economics is a state of affairs in which the usual tools of economic policy have lost all traction (Krugman P., 2008). With regard to the analysis of foreign experience of studying depressed economies (Melman, 1976; Krugman, 1999; Aiginger, 2010), the authors of this study propose to understand this category as a state of the regional labor market caused by structural imbalances in the economics and determined through such indicators as: employment rate, overall unemployment rate (ILO), average job search duration, percentage of job seekers search for a job for 12 months, average nominal monthly wages, labor market tension index, rating of social and economic development of the region. Five of the above indicators are often used in various methods of assessing the situation in the labor market, but for the first time they are used in combination with the indicators of the average monthly wages and the rating of the region’s socio-economic development. Failure to assess labor leads to lots of negative consequences: the duration of job search, the increase in the costs of retraining, demotivation and de-qualification in the labor market, the difficulty of filling low-wage job vacancies, reduced prestige of a number of occupations, etc., therefore, this indicator has a significant impact on the situation in the labor market.
While determining the depressed regions, various indicators of the regional socio-economic development are used as determined by different methods. In our opinion, the rating of the socio-economic status of the constituent entities of the Russian Federation (RIARATING, 2016) is one of the most popular and comprehensive indicators of the state of the region’s economy, this rating is based on the analysis of a significant array of indicators – the size of the economy (overall production of goods and services; consolidated budget revenues; the number of people employed in the economy); the economic performance (gross output of goods and services per capita, fixed investment per capita, foreign investment per capita; the share of profitable enterprises, the tax collection rate); the indicators of the budgetary sphere (consolidated budget revenues per capita; the share of own revenues in the total cumulative revenues of the consolidated budget; the ratio of state debt to own consolidated budget revenues, the deficit to own consolidated budget revenues); indicators of the social sphere (the ratio of the population incomes to the cost of a fixed market basket of goods and services; unemployment rate; life expectancy at birth; infant mortality rate). Since the indicators of this rating characterize various aspects of the socio-economic development of regions, they have a close relationship with a comprehensive assessment of the situation in the region.
M.K. An assessment of the depressiveness of regional labor markets was carried out on a large statistical array of regional labor markets in order to identify the specifics of depressiveness formation in labor markets, which determined the subject of the study, that is, federal subjects of the Russian Federation (the period under investigation is 2010–2016). The arrayed data characterizing the regions contains 4004 variables grouped together upon the above indicators. The data source is the information portal of the Federal State Statistics Service (FSSS, 2017).
Kohonen maps allow one to effectively visualize the acquired information because they consist of segments rectangular or hexagonal in shape called cells. Visualization of the data processing results on the map is carried out using certain coloring for one feature, so for each variable under analysis it is necessary to plot a separate map. This method was originally proposed by Finnish scholar T. Kohonen (2001); later, researchers used Kohonen maps to analyze economic processes (Deichmann et al., 2003; etc.).
In international and Russian practice, self-organizing Kohonen maps are actively used in research of various problems. For example, Patrice Gaubert and Marie Cottrell (1999) in their studies segmented labor market using the Kohonen algorithm. By means of a panel study of income for the period of 1982–1992, some functioning mechanisms of the two US labor market segments – primary and secondary ones (by their characteristics, these segments are highly contrasting, opposed) were studied. With the use of neural network algorithm applied to quantitative variables, a classification was defined in four classes of situations. It shows a clear hierarchy of transition from a situation of very unstable operation or even a lack of operation to a situation of stable operation with higher wages. The problems of labor market segmentation have been also studied by a group of foreign specialists P. Letrémy, M. Cottrell, P. Gaubert, and J. Rynkiewicz (2007), who analyzed the labor market in order to determine its sustainability and possible development pathways. The main idea is that this theory is well suited for interpreting the observed pathways because of the heterogeneity of operating situations, and the Kohonen algorithm was used to determine the labor market segments. The development pathways were determined using the non-homogeneous Markov model and classified again using the Kohonen algorithm (Letrémy et al., 2007). Etienne Côme, Marie Cottrell and Patrice Gauber also used Kohonen self-organizing maps to determine professional occupation of employees. In the data collected during a panel study of income dynamics (PSID) for the period of 1984–2003, the employment specifics of American employees were studied (Côme et al., 2012). These scholars examined the application properties of the Kohonen algorithm, that is, the potential for predicting problems, explaining complex prediction models, the topology retention property (Côme et al., 2012). Clusterization of the regions by a number of indicators is one of the approaches to the study of regional labor markets. Russian sociologists A. V. Maltseva, O. V. Makhnytkina, N. E. Shilkina make good use of mathematical methods in their practice when studying labor market segmentation. Their work describes the methodology of labor market clustering in detail based on the use of Kohonen maps (Maltseva et al., 2016).
At The results of regional labor markets clustering for 2010–2015 are given in Table 1 in the Appendix. Due to the limited research scope of the article, the authors analyze in detail the results of the labor markets clustering for 2016. Calculation of descriptive statistics for all 83 regions analyzed in 2016 (see Table 2 in the appendix) allows one to assess the labor market depressiveness as a whole/at an average, to reveal the scale of differences in different subjects of the Russian Federation. The minimum employment rate value among the 83 regions studied was 50.8% (the Republic of Ingushetia), the maximum value was 79.6% (Chukotka Autonomous Okrug), while in all the regions studied this indicator was 64.4% on average; the minimum general unemployment rate was 1.6% (St. Petersburg), the maximum rate was 30.2% (the Republic of Ingushetia), the average was 6.8%; the minimum average job search time was 4.6 months, (St. Petersburg and the Nizhny Novgorod Region), the maximum was 13.1 months (the Republic of Ingushetia), 7.8 months on average; the minimum ratio of those unemployed who are in job search for 12 months was 7.7% (St. Petersburg), the maximum was 73.1% (the Republic of Ingushetia), 31.2% on average; the minimum index of average monthly accrued wages was 20,629 rubles (the Republic of Dagestan), the maximum was 86,647 rubles (Chukotka Autonomous Okrug), 33,194 rubles on average; the minimum labor market tension coefficient was 0.7 (Yamalo-Nenets Autonomous Okrug), the maximum was 342.4 (the Republic of Ingushetia), 11.2 on average; the minimum value of socio-economic regional development rating was 13.2 (the Jewish Autonomous Region), the maximum was 80.9 (Moscow), the national average was (43.2).
Figure 2 shows maps for all the indicators studied for 2016 and a general map of the clusters obtained. The situation in a particular region in the context of the indicators under study can be inferred by the intensity of color. The research using Kohonen maps also makes it possible to identify relationship between clusters.
Figure 2
Kohonen maps in the Deductor analytical platform
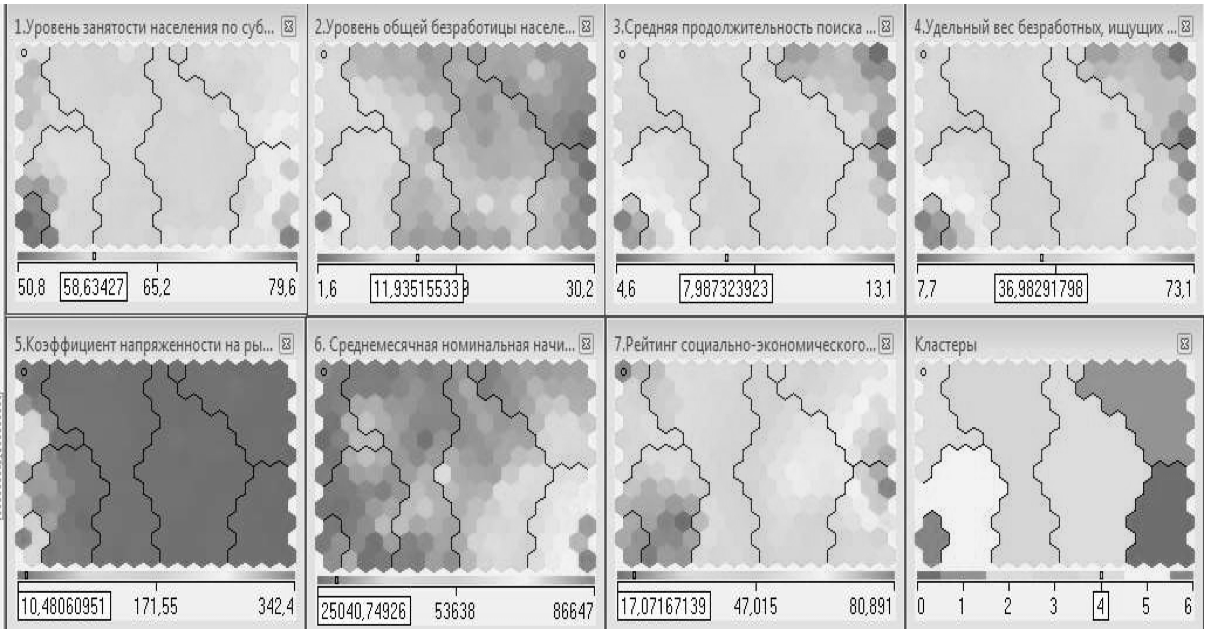
Thus, using Kohonen maps, it is possible to determine the relationship between clusters by a generalizing criterion that allows one to see the grounds for maximum similarity or difference in the characteristics of the objects or processes analyzed. Table 1 presents the quantitative characteristics of cluster relationships.
Table 1
Relationship of clusters by generalizing criterion, %
Cluster 1 |
Cluster 2 |
Cluster 3 |
Cluster 4 |
Cluster 5 |
Cluster 6 |
Cluster 7 |
|||||||
Cluster No. |
% |
Cluster No. |
% |
Cluster No. |
% |
Cluster No. |
% |
Cluster No. |
% |
Cluster No. |
% |
Cluster No. |
% |
2 |
70.73 |
1 |
70.73 |
1 |
70.78 |
1 |
63.18 |
1 |
52.70 |
1 |
47.12 |
1 |
4.54 |
3 |
70.78 |
3 |
86.22 |
2 |
86.22 |
2 |
77.82 |
2 |
65.8 |
2 |
53.71 |
2 |
7.82 |
4 |
63.18 |
4 |
77.82 |
4 |
88.22 |
3 |
88.22 |
3 |
75.28 |
3 |
66.20 |
3 |
18.21 |
5 |
52.70 |
5 |
65.8 |
5 |
75.28 |
5 |
82.64 |
4 |
82.64 |
4 |
75.24 |
4 |
23.21 |
6 |
47.12 |
6 |
53.71 |
6 |
66.20 |
6 |
75.24 |
6 |
79.95 |
5 |
79.96 |
5 |
36.36 |
7 |
4.54 |
7 |
7.82 |
7 |
18.21 |
7 |
23.21 |
7 |
36.36 |
7 |
39.59 |
6 |
39.59 |
The data in Table 1 indicate common features and relationships between clusters. Thus, for example, the regions that are part of cluster 1 have more common features to be merged into one. In clusters 2 and 3, the interrelation of common characteristics is 86.22%, while in clusters 2 and 4, it is 77.82%. The relation between clusters 3 and 4 is quite strong, as well as between 4 and 5, 5 and 6. However, cluster 7 consisting of 1 region has a tenuous relationship with all clusters, while with the nearest clusters 5 and 6, it is only 36.36% and 39.59%, respectively.
With the help of multivariate cluster analysis, homogeneous groups of regions have been identified in this paper. The analysis of the clusters obtained has made it possible to identify 7 homogeneous groups of regions:
1. A cluster of regions with a favorable situation in the labor market (cluster 1), which includes 9 regions: Moscow, the Kamchatka Territory, the Magadan Region, Nenets Autonomous Okrug, the Republic of Sakha (Yakutia), the Sakhalin Region, Khanty-Mansi Autonomous Okrug – Yugra, Chukotka Autonomous Okrug, Yamal-Nenets Autonomous Okrug.
2. Regions with a relatively favorable situation in the labor market (cluster 2)– 11 regions: the Belgorod Region, St. Petersburg, the Kirov Region, the Leningrad Region, the Lipetsk Region, the Moscow Region, the Nizhny Novgorod Region, the Republic of Tatarstan, the Udmurt Republic, the Chelyabinsk Region , the Chuvash Republic.
3. Regions with signs of depression in the labor market (cluster 3)– 23 regions: the Arkhangelsk Region without autonomous district, the Vladimir Region, the Vologda Region, the Voronezh Region, the Irkutsk Region, the Kaliningrad Region, the Kaluga Region, the Krasnodar Territory, the Krasnoyarsk Territory, the Murmansk Region, the Novosibirsk Region, the Orenburg Region, the Perm Territory, the Primorye Territory, the Republic of Bashkortostan, the Republic of Komi, the Rostov Region, the Samara Region, the Sverdlovsk Region, the Tomsk Region, the Tula Region, the Tyumen Region without autonomous districts, the Khabarovsk Territory.
4. Regions with a low level of depression in the labor market (cluster 4)– 26 regions:the Altai Territory, the Amur Region, the Astrakhan Region, the Bryansk Region, the Volgograd Region, the Ivanovo Region, the Kemerovo Region, the Kostroma Region, the Kursk Region, the Novgorod Region, the Omsk Region, the Oryol Region, the Penza Region, the Pskov Region, the Republic of Karelia, the Republic of Mari El, the Republic of Mordovia, the Republic of Khakassia, the Ryazan Region, the Saratov Region, the Smolensk Region, the Stavropol Territory, the Tambov Region, the Tver Region, the Ulyanovsk region, the Yaroslavl Region.
5. Regions with an average level of depression in the labor market (cluster 5)– 4 regions:the Republic of Adygea, the Republic of Altai, the Republic of Dagestan, the Chechen Republic.
6. Regions with a high level of depression in the labor market(cluster 6) – 9 regions:the Jewish Autonomous Region, the Zabaikalye Territory, the Kabardino-Balkarian Republic, the Karachaevo-Cherkessian Republic, the Kurgan Region, the Republic of Buryatia, the Republic of Kalmykia, the Republic of North Ossetia-Alania, the Republic of Tuva .
7. Regions with deeply depressed labor markets(cluster 7) – 1 region–the Republic of Ingushetia.
The Kohonen maps method allows to analyze the basic averages for each cluster in 2016 (see Table 2 in the appendix). In general, the first cluster (10.8% of all the territorial entities) is characterized by the fact that the regions are relatively balanced in terms of the indicators studied; what can be attributed to the distinctive features of this cluster is high average monthly accrued wages and employment level (the significance of these indicators is 100% – see Table 3). When analyzing the indicators, one can note a high level of employment (from 64.5% in the Republic of Sakha (Yakutia) to 79.6% in Chukotka Autonomous Okrug); a low level of general unemployment (from 1.8% in Moscow to 8.5% in Nenets Autonomous Okrug); a low tension coefficient in the labor market (from 0.7% in Yamalo-Nenets Autonomous Okrug to 4.2% in the Republic of Sakha (Yakutia)); similar values of the job search time (from 5.3 months in Moscow to 7.8 months in the Magadan Region); quite a large percentage of those unemployed who are in job search for 12 months or more (from 11.2% in Moscow to 30.0% in the Magadan region); the socio-economic development rating (from 37.2% in the Magadan Region to 80.9 in Moscow). Predominantly, the regions are the driving force, self-regulating and having a serious development outlook.
In the second cluster (13.3% of all the subjects under consideration), the average job search time indicator (the minimum value of this indicator in the cluster was 4.6 months in St. Petersburg and the Nizhny Novgorod Region up to 7.0 months in the Moscow Region) and the ratio of those unemployed who are in job search for 12 months or more (from 7.7 in St. Petersburg to 22.3% in the Lipetsk region) were the determining factors (their significance being 100%). Other indicators are similar in significance to the determining indicators, except for the tension coefficient (the significance of this indicator was 47.3%), its minimum value being 1.0 (St. Petersburg) and the maximum being 6.1 (the Chelyabinsk Region) and the average monthly accrued wages (33.6%), which varies from 22,908 rubles in the Chuvash Republic to 48,703 rubles in St. Petersburg. The employment level in this cluster ranges from 65.8% (the Kirov Region) to 73.5% (St. Petersburg), while the unemployment level varies from 1.6% (St. Petersburg) to 5.4% (the Kirov region); the rating indicators vary from 38.3 (the Kirov Region) to 74.5 (St. Petersburg).
In the third cluster (27.7%), the regional social and economic development rating indicator (99.3%) is the key indicator. The importance of the wage indicator (7.6%) is insignificant, and the employment level indicator (36.5%) is of little importance. The significance of the other indicators varies approximately in the close range (see Table 3). The socio-economic development rating indicators range from 41.655 in the Arkhangelsk Region without the autonomous district to 60.8 in the Republic of Bashkortostan; there are relatively small gaps in employment indices that vary from 61.7% in the Arkhangelsk Region without the autonomous district to 68.8% in the Murmansk Region; the unemployment rate in this cluster is the lowest in the Samara and Tula Regions (4.1%), while it is high in the Irkutsk Region (8.8%); the average job search time is the shortest in the Kaliningrad Region (6.5%) and high in the Kaluga Region, the Perm and Primorye Territories (8.3%); the ratio of those unemployed who are in job search for 12 months or more is low in the Krasnodar Territory – 22% and high in the Primorye Territory – 36.7%; the tension coefficient is distributed within the limits from 1.7 (the Voronezh Region, the Primorye Territory, the Tyumen Region without the autonomous districts) to 5.8 (the Orenburg Region). The lowest wage level is in the Vladimir region – 25,135 rubles, while the highest level is in the Murmansk region – 48,986 rubles.
In the fourth cluster (31.3%), two indicators are determining (wages with 98.7% significance, socio-economic status rating with 94.9% significance), while the importance of the ratio of those unemployed who are in job search for 12 and more months amounts to 43.3%, and the significance of the employment level is 50.1%. According to the authors, it is interesting that in this cluster, the dispersion of the determining wage index is less than, for example, in the previous cluster: from 21,202 rubles in the Altai Territory to 33,837 rubles in the Amur Region. The other indicators are distributed as follows: the social and economic development rating – from 24.9 (the Republic of Khakassia) to 46.5 (the Omsk Region); the employment level – from 59.5% (the Altai Territory) to 68.1% (the Republic of Mordovia); the unemployment rate – from 4.2% (the Republic of Mordovia) to 9.2% (the Republic of Karelia); the average job search time – from 6.5 months (the Penza region) to 9.6 months (the Republic of Khakassia); the share of the long-term unemployed – from 23.1% (the Oryol Region) to 40.7% (the Tambov region); the tension coefficient – from 2.4 (the Tambov Region) to 6.9 (the Republic of Karelia).
In the fifth cluster (4.8%), the indicators of the employment level (99.6%), overall unemployment (99.1%) and the regional rating (93.0%) are significant, while the importance of the unemployment rate and of those unemployed who are in job search for 12 months or more (19.4%) is low. The indicators range in the following limits: the employment level varies from 55.5% (the Republic of Adygea) to 58.8% the Chechen Republic; the level of overall unemployment varies from 9% (the Republic of Adygea) to 15.8% (the Chechen Republic); the average job search time – from 7.4 months (Republic of Adygea) to 9.6 months (the Chechen Republic); the ratio of those unemployed who are in job search for 12 months or more – from 27.0% (the Republic of Adygea) to 38.7% (the Chechen Republic); the tension coefficient – from 5.0 (the Republic of Adygea) to 181.2 (the Republic of Dagestan); the average monthly wages varies from 20,629 rubles (the Republic of Dagestan) to 25,083 rubles (the Republic of Altai); the social and economic development rating varies from 16.8 (the Altai Republic) to 42.6 (the Republic of Dagestan).
In the sixth cluster (10.8%) the employment figures, the proportion of those unemployed who are in job search for more than 12 months, the average job search time in the labor market of the Russian Federation subjects, as well as the socio-economic rating, have 100% significance, while significance of the tension coefficient in the labor market is 4.5%. The indicators have divided up as follows: the employment level varies from 52% (the Republic of Tuva) to 62.5% (the Republic of Kalmykia); the level of general unemployment varies from 8.2% (the Jewish Autonomous Region) to 16.6% (the Republic of Tuva); the average job search time varies from 9.1 months (the Republic of Buryatia) to 12 months (the Republic of Tuva); the share of those unemployed who are in job search for 12 months and more varies from 42.0% (the Republic of Buryatia) to 69.3% (the Republic of Tuva); the tension coefficient varies from 0.8 (the Jewish Autonomous Region) to 36.6 (the Republic of North Ossetia-Alania); the average monthly salary varies from 21,318 rubles (the Republic of Kalmykia) to 32,654 rubles (the Zabaikalye Territory); the social and economic development rating varies from 13.139 (the Jewish Autonomous Region) to 31.942 (the Republic of Buryatia).
In the seventh cluster (1.2%) (consisting of one region and making up 1.2% of the total set of regions), almost all the indicators have a high significance, except wages (53.2%): the employment level is 50.8 %, the general unemployment rate is 30.2%, the average job search time is 13.1%, the share of those long-term unemployed is 73.1%, the tension coefficient in the labor market is 342.4, the average monthly salary is 22,488 rubles, the socio-economic development rating is 22.173.
The results of clusterization carried out by the authors testify to a new approach to the typology of regions for assessing depressiveness in the labor market. On a periodic basis, regulatory documents approve a list of territories with a tense situation in the labor market. Most of the regions are territories with major depression in the labor market.
The Order No. 449n of the Ministry of Labor and Social Protection of the Russian Federation of 25 May 2017, approved the list of areas referred to as areas with a tense situation in the labor market; in 2016, the following 19 regions were referred to as such: the Republics of Karelia, Adygea, Kalmykia, Dagestan, Ingushetia, Kabardino-Balkaria, Karachay-Cherkessia, North Ossetia-Alania, Chechnya, Altai, Buryatia, Tuva, Khakassia; the following regions: Kurgan, Irkutsk , Kemerovo and Jewish Autonomous; the Altai and Zabaikalye Territories (RF MLSP Order No. 449n, 2017).
Many of these regions are agricultural and fall into the risk group, thereby forming depressed enclaves; hence, it is necessary to identify the competitive advantages of a territory selecting competitive industries, to create agroindustry of a new type, to develop social and industrial infrastructure, etc.
Another focus area of reducing the depression in the labor market is to increase mobility in a region. In 2017, within the framework of subprogram ‘Active employment policy’ by the Ministry of Labor and Social Protection, implementation of the core measure, ‘The population’s labor mobility development’ is provisioned, where to 962.2 million rubles have been allocated, while in 2018, the funding is going to be reduced by 3.2 times to reach 300 million rubles. In 2017 the Federal Labor and Employment Agency allocated 78.7 million rubles to undertake the core activities on the implementation of positive population employment policy, while in 2018 and 2019, it will be allocating 78.6 million rubles each year. 97.9% of budgetary allocations for the implementation of the sub-program ‘Active employment policy and social support to unemployed citizens’ are to be used as payments to unemployed citizens.
The following regions are included in the list of those selected to be co-financed from the federal budget for program implementation to increase labor mobility in 2017: the Kamchatka Territory, the Krasnoyarsk Territory, the Perm Territory, the Primorye Territory, the Khabarovsk Territory, the Amur Region, the Arkhangelsk Region, the Vologda Region, the Kaluga Region, the Lipetsk region, the Magadan Region, the Murmansk Region, the Novosibirsk Region, the Sakhalin Region, the Ulyanovsk Region, Chukotka Autonomous Okrug. Most of the regions listed (43.8%) belong to the Far Eastern Federal District, 18.7% belong to the Northwestern Federal District, and 12.5% fall to the share of the Volga, Siberian, and Central Federal Districts. The highest threshold co-financing ratio is allocated to the Kamchatka Territory and Chukotka Autonomous Okrug (95% and 90%, respectively), the lowest threshold co-financing ratio is allotted to the Kaluga and Sakhalin Regions (27% and 48%, respectively). The financial assurance for each specialist accepted for permanent employment amounts to 225 thousand rubles, whereof 150 thousand rubles fall to the federal budget and 75 thousand rubles fall to the regional budget. The employment policy shaping problems in the context of global and local challenges have been examined in detail by a group of authors whose frame of reference the authors are in agreement with (Mirzabalayeva et al., 2016).
Some factors affecting the labor market depressiveness are presence of inefficient, low-paid jobs leading to further stagnation of these territories; a lack of qualified workers caused by the collapsed secondary level of the vocational education system; well-marked, yet, not justifiable differentiation in remuneration of labor; the impact of migrants on the depressed labor markets functioning; a large segment of the informal sector and fluctuating employment; some others that have an impact on the depressed labor market and have not been considered in this article and that the authors expect to study in further research.
Thus, the research findings are as follows: formation of regional labor market clusters with different levels of depressiveness in 2010–2016; the main indicators whose importance prevails in a particular cluster and determines clusterization of certain regions have been identified; the federal budget expenditures on implementing regional employment policies has been analyzed; lines of further research in the analysis of regional labor market depressiveness have been grounded. The proposed approach in clustering regional labor markets allows one to properly assess the situation in regional labor markets, identify the most important factors in the formation of labor markets and justify relevant employment policies.
The studies of foreign specialists show that a wider range of indicators is used in labor market analysis. Unfortunately, the Russian Statistical Service does not provide some necessary information on the basis of which the study would be more profound and consistent, comparable to similar international studies (for example, it does not fully reflect the migration processes and behavior of migrants in the labor market, flows of migrants’ funds outside regions, it is difficult to investigate the processes in agricultural markets because of the lack of information (some information is not broken down on a local basis), etc.). The methodology for calculating particular indicators has serious dissimilarities from those adopted in international practice, which makes it impossible to carry out a comparative analysis upon a number of indicators (sectoral grouping, the GDP calculation methodology, etc. have changed).
In further research, the authors assume the following tasks:
- Identify the main trends in clusters obtained using Kohonen maps in the development of regional labor markets for the period of 2010–2016.
- Develop an integrated index of labor market depressiveness taking into account the indicators used in this study, and identify clusters by the labor market depression level for the period of 2010–2016;
- Carry out a comparative analysis of cluster composition according to both methods based on the clusterization results;
- Assess the effectiveness of the state fiscal region equalization policy on the basis of assessing the degree of clustered regions being subject to subsidy assistance;
- Analyze the specifics of the employment policies implementation in clustered regions in order to identify common and specific factors that determine clusterization;
- Substantiate public employment policies to reduce depression in regional labor markets.
It is essential to identify measures that could contribute to reducing depressive behavior in regional labor markets, and, consequently, to equalizing the social and economic situation throughout the country. The prolonged depressiveness of regions and labor markets leads to irreversible economic processes and increases tension in society. A balanced and consistent national policy should be aimed at reducing the unjustified differentiation and stagnation of regional labor markets.
Table 1
Clusterization of regional labor markets for 2010-2015
by the level of depressiveness using Kohonen maps
Indicators |
2010 |
2011 |
2012 |
2013 |
2014 |
2015 |
Number of clusters |
6 |
6 |
7 |
7 |
6 |
5 |
Number of statistical indicators |
553 |
560 |
567 |
581 |
581 |
581 |
Quantity of regions – in total |
79 |
80 |
81 |
83 |
83 |
83 |
1st cluster |
9 regions (11.4%) |
9 regions (11.3%) |
12 regions (14.8%) |
10 regions (12.0%) |
10 regions (12.0%) |
11 regions (13.3%) |
2nd cluster
|
26 regions (32.9%) |
24 regions (30.0%) |
25 regions (30.9%) |
31 regions (37.3%) |
28 regions (33.7%) |
26 regions (31.3%) |
3rd cluster
|
10 regions (12.7%) |
18 regions (22.5%) |
14 regions (17.3%) |
15 regions (18.1%) |
27 regions (32.5%) |
30 regions (36.1%) |
4th cluster
|
20 regions (25.3%) |
16 regions (20.0%) |
17 regions (21.0%) |
17 regions (20.5%) |
13 regions (15.7%) |
13 regions (15.7%) |
5th cluster
|
9 regions (11.4%) |
9 regions (11.3%) |
3 regions (3.7%) |
1 regions (1.2%) |
2 regions (2.4%) |
3 regions (3.6%) |
6th cluster
|
5 regions (6.3%) |
4 regions (5.0%) |
8 regions (9.9%) |
6 regions (7.2%) |
3 regions (3.6%) |
|
7th cluster
|
|
|
2 regions (2.5%) |
3 regions (3.6%) |
|
|
-----
Table 2
Statistical distribution of the basic ranking indicators of the regional
labor markets in the Russian Federation for 2016 (using Kohonen maps)
|
Indicators of the regions’ ranking |
Statistics: Quantity of regions=83 |
||||||
Minimum value of the indicator |
Maximum value of the indicator |
Average value of the indicator |
Standard deviation |
Sum |
Sum of squares |
Quantity of unique values |
||
|
Quantity of regions (in the cluster) |
9 |
40 |
19.689 |
5.284 |
1634 |
34458 |
83 |
1. |
Employment rate by the RF constituent entities, в % yearly average % |
50.8 |
79.6 |
64.37 |
4.7784 |
5342.7 |
3.4578 Е5 |
|
2. |
Overall unemployment rate by the RF constituent entities, в yearly average % |
1.6 |
30.2 |
6.7759 |
3.7743 |
562.4 |
4978.9 |
|
3. |
Average job search duration in the labor market of the RF constituent entities months |
4.6 |
13.1 |
7.7723 |
1.4904 |
645.1 |
5196.1 |
|
4. |
Percentage of job seekers searching for a job for 12 months and more, % |
7.7 |
73.1 |
31.18 |
11.821 |
2587.9 |
92148 |
|
5. |
Labor market tension index of the RF constituent entities, unit, yearly value |
0.7 |
342.4 |
11.151 |
42.064 |
925.5 |
1.5541Е5 |
|
6. |
Average nominal monthly wages of employees for a full range of organizations in the economy as a whole by the RF constituent entities, RUB |
20629 |
86647 |
33194 |
14582 |
2.7551Е6 |
1.0889Е11 |
|
7. |
Rating of socio-economic status of the RF constituent entities |
13.139 |
80.891 |
43.185 |
14.088 |
3584.3 |
1.7106Е5 |
|
8. |
Ranking |
1 |
85 |
42.458 |
24.69 |
3524 |
1.9961Е5 |
|
9. |
The cell number |
0 |
191 |
97.53 |
62.223 |
8095 |
1.107Е6 |
79 |
10. |
Distance to the cell’s center |
0.00032537 |
0.14765 |
0.0095129 |
0.023797 |
0.78957 |
0.053946 |
|
11. |
The cluster’s number |
0 |
6 |
2.4337 |
1.4415 |
202 |
662 |
7 |
12. |
Distance to the cluster’s center |
0.079288 |
0.54525 |
0.21264 |
0.096321 |
17.649 |
4.5137 |
|
-----
Table 3
Distribution of the regions’ clusterization indicators by significance
Indicators of the regions’ ranking |
Clusters |
||||||||||||||||
0 cluster |
1 cluster |
2 cluster |
3 cluster |
4 cluster |
5 cluster |
6 cluster |
Total |
||||||||||
9 (10.8%) |
11 (13.3%) |
23 (27.7%) |
26 (31.3%) |
4 (4.8%) |
9 (10.8) |
1 (1.2%) |
|
||||||||||
2. |
Overall unemployment rate by the RF constituent entities, yearly average % |
significance |
87.9% |
95.6% |
63.6% |
71.1% |
99.1% |
99.8% |
100.0% |
100.0% |
|||||||
3. |
Average job search duration in the labor market of the RF constituent entities, months |
significance |
93.3% |
100.0% |
71.0% |
66.3% |
55.4% |
100.0% |
99.9% |
100.0% |
|||||||
4. |
Percentage of job seekers searching for a job for 12 months and more, % |
significance |
94.3% |
100.0% |
63.3% |
43.3% |
19.4% |
100.0% |
99.9% |
100.0% |
|||||||
5. |
Labor market tension index of the RF constituent entities, unit, yearly value |
significance |
48.0% |
47.3% |
63.3% |
59.9% |
96.8% |
4.5% |
100.0% |
100.0% |
|||||||
6. |
Average nominal monthly wages of employees for a full range of organizations in the economy as a whole by the RF constituent entities, RUB |
significance |
100.0% |
33.6% |
7.6% |
98.7% |
83.4% |
84.6% |
53.2% |
100.0% |
|||||||
7. |
Rating of socio-economic status of the RF constituent entities |
significance |
93.7% |
99.2% |
99.3% |
94.9% |
93.0% |
100.0% |
85.8% |
100.0% |
|||||||
1. Plekhanov Russian University of Economics, Moscow, Russia, faridamir@yandex.ru
2. Plekhanov Russian University of Economics, Moscow, Russia, kvachevvg@mail.ru
3. Plekhanov Russian University of Economics, Moscow, Russia, kuksova_od@mail.ru