![]() ISSN 0798 1015
ISSN 0798 1015

![]() ISSN 0798 1015
ISSN 0798 1015
Vol. 39 (Number 26) Year 2018 • Page 3
Michael Z. EPSTEIN 1; Olga A. SHVETSOVA 2
Received: 05/02/2018 • Approved: 03/03/2018
2. Approaches to Industry Innovations: Theoretical Framework
ABSTRACT: This research paper refers to innovation management in transportation industry. Railway transport nowadays owns an innovative component for achieving high level of competitiveness through active innovative developments and implementations. This direction is influenced by external and internal factors, which should be taken into account while developing and implementing the company's innovative development strategy. This paper presents comparative analysis of different environmental factors, which affect innovative strategies of Russian and Chinese companies. |
RESUMEN: Este trabajo de investigación se refiere a la gestión de la innovación en la industria del transporte. Actualmente, el transporte ferroviario posee un componente innovador para lograr un alto nivel de competitividad mediante desarrollos e implementaciones innovadores activos. Esta dirección está influenciada por factores externos e internos, que deben tenerse en cuenta al desarrollar e implementar la estrategia de desarrollo innovador de la compañía. Este documento presenta un análisis comparativo de diferentes factores ambientales, que afectan las estrategias innovadoras de las empresas rusas y chinas. |

Innovative development of the company is the basis for increasing the efficiency of its activities. Tougher competition, business conditions, the impact of external and internal factors requires the formation and implementation of an innovative development strategy (Barnett H.G., 1953).
Railway transport is one of the most actively developing on the innovative base of industries. One of the vectors for the development of the Russian and Chinese railway industry is innovation, namely, the creation of new and improvement of existing goods and services.
The goal of this study is important to single out one of the aspects of the comparative analysis of the strategies for innovative development of the railway industry in Russia and China. Methodology is comparing the influence of internal and external factors on the formation of the company's innovative development strategy. Proceeding from this premise, the article presents a set of external and internal factors, their impact on the company's strategy is assessed, and conclusions on the research results are presented.
The object of the study is the railway companies of Russia and China: JSC "Russian Railways" and "China Railway Corporation".
Innovation is important at all stages of development; specifically, the creation and diffusion of technologies are important for economic growth and welfare across all economies. Different types of innovation play a role at various stages (e.g. in earlier stages, incremental innovation is often associated with the adoption of foreign technology) (Drucker P., 2006, 2007). Opportunities for successful innovation experiments and a potentially different framework for development are emerging. Notably, these opportunities result from the rise of information and communication technologies, the development of global value chains, the increased importance of some emerging countries in the global innovation system, the growth of service-based economies and a greater openness to trade and foreign direct investment (Fixsen D.L, Naoom S.F., et al., 2015). Today a key challenge for innovation policy in emerging countries is to encourage inclusive growth and support research addressing major social challenges (Gallivan M.J., 2011; Graham I.D., Logan J., 2014).
The relevance of innovation for these countries is sometimes questioned in spite of its demonstrated benefits for meeting the immediate and long-term developmental goals of emerging and developing countries. Such concept is often based on a fairly restricted understanding of innovation as “high technology.” It is true that an exclusive focus on high-tech industries (“high-tech myopia”) can be costly if the potential for innovation in other sectors is ignored (Marcus H., 2012). Countries can incur high costs without reaping any benefits if they choose sectors that require expertise they lack and are highly competitive internationally. Yet, innovation takes place in different sectors, including services, agriculture and mining (Hoffman K., Parejo M., et al., 1998). Many opportunities for innovation have arisen in low-technology sectors with high export opportunities, e.g. the production of palm oil and derivative products in Malaysia. Also, innovation in agriculture is particularly relevant for addressing socioeconomic challenges at the same time as fostering growth. There is evidence that agricultural R&D has a greater impact on poverty reduction than most other public investments (Mendel P., Meredith L., et al., 2014).
Depending on the support mechanisms used, the types of innovation and the main agents involved differ somewhat. With respect to the overview provided, a few observations as follows are worth pointing out:
• Innovation matters even in least developed countries with backward industrial conditions. Their adoption of foreign technologies can have high payoffs, because technology adoption requires adaptation to local economic, technological or environmental conditions. This can lead to the development and accumulation of innovation capabilities. There is evidence that domestic innovation played a bigger role than imports of knowledge for the take-off of emerging Asian economies (Panzano P.C., Roth D., 2016; The World Competitiveness Scoreboard, 2014; Propharma Group Approach to Technology Transfer, 2017).
• The value of starting from imported novelties in order to advance has long been known. The notion was popularized ( Gerschenkron, 1962); it was suggested that differences in nations’ ability to develop technology and adapt it to their particular circumstances were the primary cause of countries’ differences in per capita income and that the ability to appropriate the innovations of others was the essence of the latecomer’s advantage (Pawson R., Greenhalgh T., et al., 2015).
The concept of "innovative development of the company" is inextricably linked with the notion of "innovation". Many authors have proposed their own concept of "innovation". For example, Joseph Schumpeter wrote that "innovation is a new combination of factors of production, backed up by the entrepreneurial spirit" (Schumpeter J.A. , 1982). Robert D. Atkinson noted, analyzing this concept from the perception of the consumer, that "innovation can be considered a product, technology or idea, which the buyer sees as a completely new product with distinctive properties" (Robert D. Atkinson, 2012).
Innovative development of the company is impossible without such a factor as technology. Technology influences the formation and choice of the directions of the company's innovation activity. The company risks losing its existing market share if it does not adjust in time for technological changes in the industry.
The scarcity or availability of resources directly influences the formation of an innovation development strategy: the company either limits itself, given the lack of resources and maneuvering with existing reserves, or expands its horizons in the market.
The impact of the financial stability of the company, as well as a sufficient number of resources, allows us to discover new directions for the company's development. Financial instability also adversely affects the organizational climate.
Qualitative selection and training of personnel are competitive advantages in the market of innovative products.
To assess the impact of external and internal factors on the strategy of innovative development of the company, the main model was the model of multiple regressions, representing a set of factors (x) that affect the score (y). At the same time, it is necessary to take into account that factors can be dependent among themselves, therefore, an analysis is carried out for the presence of multicollinearity factors, which allows to determine the factors excluded from the model.
For the study, the resultant indicator was chosen as the percentage of passengers transported on innovative trains. The following factors were presented alternatively: the percentage of personnel engaged in research activities (the "personnel" factor), the turnover ratio of the advanced capital (the "assets" factor) the availability of innovative trains (the "technology" factor), the passenger turnover of railway transport in the country (the "competition" factor), the financial stability factor (the "financial stability" factor) the volume of public investment in innovation (the "economic conditions" factor).
Model building begins with data collection and further processing. Due to the fact that the factors have different units of measurement, it is necessary to bring them to a single scale - for each indicator, its growth rate was calculated (unit of measure is percent)
To build the model, the Microsoft Excel analysis package "Regression" and "Correlation" is applied. It is assumed that there is a linear relationship between the factors of the model and the resultant characteristic, and then the multiple linear regression models can be represented by formula (1).

Where x1, x2, …, xn are model factors, y is the resultant indicator; b1, b2, bn are model parameters, e is model error.
The model parameters show the average change in y as a result of a change in one of the factors in the model, provided that other factors are not subject to change. To analyze the parameters of the model, the least squares method is used, on the basis of which such estimates of the model parameters are, determined in which the sum of the squares of the deviation of the effective characteristic (y) from the calculated values of the variables (ŷxi) will be minimal. It should also be noted that the parameters of the model a, b1, b2, bn are random variables; therefore, to obtain more accurate results for the least squares, the Gauss-Markov conditions are taken into account. The first of them says that the mathematical expectation of a random deviation should be 0 for any observation, the second - that the variance of random deviations is constant (check for homo- and heteroscedasticity), the third - that in the model there should be no autocorrelation [12].
The next step is to analyze the regression statistics, which reflects the four indicators: R2 (reflects the quality of the model), multiple R2 (shows the degree of dependence of the effective indicator on the factors of the model), normalized R2 (R2, adjusted for the sample size), standard error (reflects the spread of data in the sample).
To test the equation for statistical significance, Fisher's F-criterion is used, which allows comparing the values of sample variances of two independent samples (the calculated and tabulated values are compared, after which the conclusion is made about the reliability of the constructed equation). The calculated value of the F-test of Fisher is found from the formula (2):
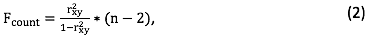
Where  is the determination coefficient; n is the number of observations in the study.
If the table value of Fisher's F-test is greater than the calculated one, then the model is considered insignificant, and the constructed equation is unreliable.
To further evaluate the model, the authors used analysis of the coefficients of determination and correlation. Previously, it was noted that the factors of the model can be dependent among themselves; therefore, it becomes necessary to analyze the pair correlation coefficients. Two factors of the model have a linear dependence if the coefficient of pair correlation exceeds the value 0.7. To assess the practical significance of the multiple regression equation, the coefficient of multiple correlation and determination is used. The coefficient of multiple correlations varies from 0 to 1: a less close relationship is reflected at a value close to 0. As for the multiple determination coefficients, the authors use it for regression quality analysis: if the coefficient value is close to 0, a conclusion is drawn about the low quality of the regression.
A deeper analysis of the interdependence of the factors in the model can be carried out by checking for the presence of multicollinearity factors (χ2 criterion). If there is multicollinearity between the factors, this negatively affects the quality of the model and makes it difficult to assess the influence of factors on the outcome. To determine the value of the χ2 criterion, a matrix consisting of paired coefficients of correlation of model factors suspected of having multicollinearity is used. The next step is the calculation of the determinant of the matrix and the value of the criterion, after which the obtained value is compared with the table value: if the tabulated value exceeds the calculated one, then a conclusion is made about the absence of a connection between the factors of the model.
If it is necessary to correct the model as a result of the analysis, variables that negatively affect its quality are excluded from it. After the adjustments are made, the partial coefficients of elasticity and correlation are calculated. Partial coefficients of elasticity show which growth of the effective characteristic can be expected with an increase in the individual factor of the model by 1%. As for the partial correlation coefficients, they are used to determine the influence of each individual factor without taking into account the influence of other factors of the model. The range of this coefficient is from -1 to 1: if the value of the coefficient modulo is close to 1, a stronger dependence of the effective characteristic on this factor is observed. If the coefficient takes a negative value, there is an inverse relationship between the indicators.
As a rule, in conclusion of the construction of the model, an economic interpretation of the results of its analysis is given. These results can be used to make managerial decisions in the process of forming the company's innovative development strategy.
The construction of correlation-regression models for the companies "Russian Railways" and "China Railway Corporation" was started with sampling according to annual, statistical and financial reports, as well as articles for 2015-2016. Variable models were coded as follows: the percentage of personnel engaged in research activities - x1, the volume of public investment - x2, the passenger turnover of railway transport in the country - x3, the financial stability factor - x4, the turnover ratio of the advanced capital - x5, the availability of innovative compounds - x6, the percentage of passengers transported on innovative trains - y.
The percentage of personnel engaged in research activities was defined as the ratio of the number of employees engaged in R & D in the company to the total number of employees of the company. The volumes of state investments in innovative activities of companies were presented in the amount in which they are defined in investment programs for 2015-2016. Passenger turnover of railway transport in the country (Dpass) (this indicator was taken into account the fact that Russian Railways and China Railway Corporation are monopoly companies in the railway transport sector in Russia and China, respectively was determined by the formula (3):
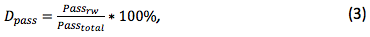
Where Passrw- passenger turnover on the railway transport, Passtotal - the passenger turnover in the country by all modes of transport.
The coefficient of financial stability (Kfs) was calculated by the formula (4):

Where C - the amount of the company's equity, D - the amount of the company's debt obligations, A - the amount of the company's assets.
The coefficient of resource productivity (Kres) of JSC "Russian Railways" and "China Railway Corporation" is calculated by the formula (5):
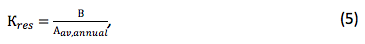
Where В is the revenue of the company, - the average annual value of the company's assets.
Table 1
Initial data for building a model for the company JSC Russian Railways
х1, % |
х2, % |
х3, % |
х4, % |
х5, % |
х6, % |
y, % |
145,16 |
116,67 |
105,04 |
123,16 |
96,28 |
133,33 |
158,93 |
138,89 |
125,86 |
104,25 |
123,16 |
99,61 |
133,33 |
154,74 |
158,82 |
116,13 |
108,53 |
102,55 |
94,09 |
200,00 |
174,92 |
161,76 |
120,34 |
113,41 |
102,55 |
97,02 |
150,00 |
169,60 |
163,64 |
129,63 |
105,02 |
102,55 |
96,28 |
150,00 |
162,72 |
161,76 |
114,29 |
105,43 |
100,45 |
97,45 |
150,00 |
149,76 |
160,61 |
118,33 |
105,86 |
100,45 |
94,79 |
180,00 |
158,92 |
158,82 |
120,34 |
104,62 |
123,16 |
90,09 |
200,00 |
162,37 |
158,82 |
118,64 |
104,63 |
100,45 |
96,28 |
220,00 |
164,01 |
154,29 |
120,00 |
105,43 |
100,45 |
99,68 |
137,50 |
144,83 |
158,82 |
112,90 |
105,02 |
100,45 |
97,34 |
137,50 |
164,93 |
158,82 |
120,63 |
105,02 |
88,07 |
97,40 |
122,22 |
141,41 |
The presence of innovative compositions is taken into account as the number of trains on the balance sheet of the enterprise at the end of each month in 2015-2016.
For JSC "Russian Railways" innovative trains are the trains "Sapsan", "Swallow", "Strizh", "Allegro", for the "China Railway Corporation" - trains of type Z (developing speed up to 250 km / h), C and D 250-300 km / h), G (more than 300 km / h).
Thus, the processed data for the construction of correlation-regression models of companies are presented in Tables 1 and 2.
Following the developed method, the authors checked the statistical significance of the model and the analysis of regression statistics. According to the results of the analysis, it was revealed that the models of both companies reflect a high dependence of the effective indicator on the factors of the model.
Table 2
The initial data for building the model for the company "China Railway Corporation"
х1, % |
х2, % |
х3, % |
х4, % |
х5, % |
х6, % |
y, % |
133,33 |
79,93 |
102,92 |
137,92 |
83,93 |
214,29 |
105,26 |
133,33 |
322,70 |
100,00 |
137,92 |
82,73 |
187,50 |
95,24 |
133,33 |
322,70 |
101,87 |
133,64 |
83,15 |
214,29 |
95,45 |
133,33 |
322,70 |
102,91 |
133,64 |
84,82 |
200,00 |
110,53 |
133,33 |
322,70 |
104,38 |
99,95 |
80,60 |
180,00 |
110,00 |
133,33 |
322,70 |
103,57 |
95,41 |
81,38 |
180,00 |
104,76 |
133,33 |
322,70 |
104,17 |
98,96 |
84,06 |
190,00 |
110,00 |
133,33 |
322,70 |
104,38 |
104,71 |
84,78 |
158,33 |
114,50 |
133,33 |
322,70 |
104,38 |
106,13 |
82,18 |
146,15 |
113,93 |
133,33 |
322,70 |
104,80 |
106,13 |
88,14 |
146,15 |
115,50 |
133,33 |
322,70 |
104,79 |
106,13 |
85,34 |
142,86 |
114,93 |
133,33 |
322,70 |
104,79 |
99,63 |
87,83 |
140,00 |
115,00 |
The coefficient of multiple correlation for the company "Russian Railways" is 0.79, for "China Railway Corporation" - 0.96, which, in this case, speaks of an almost linear dependence.
Regarding the coefficient of determination, in the case of Russian Railways, 63% of the variation is due to the selected factors of the model, in the case of China Railway Corporation, 91% of the variation is predetermined by the model variables. The standard error in the Russian Railways model is quite high (8.9), which indicate a low quality of the model. In contrast, China Railway Corporation has a relatively low standard error of 2.87, which indicates a higher quality of the model built.
Thus, based on the results of the regression analysis, multiple regression equations for both companies were constructed (formula (6) for JSC Russian Railways and formula (7) for China Railway Corporation).
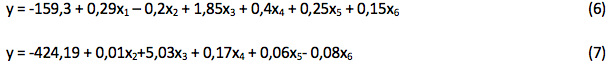
Based on the results of assessing the quality of the regression models using the Fisher F-test, it was found that for the Russian railway company the calculated value was 1.41 with a tabular value of 4.95. Since the tabular value exceeds the calculated value, the model is considered statistically insignificant. For the "China Railway Corporation", the tabular value is the same (4.95) because of an equal number of observations, and the calculated value of the criterion is 12.75, which is much higher than the tabulated value, therefore, the model is significant and reliable.
Since the model of the Russian company was found to be unreliable, it is necessary to make its adjustment. This result indicates that the model includes factors that have little effect on the company's innovative development. To determine the factors to be excluded from the model, it is necessary to analyze the correlation coefficients (Table 3).
Table 3
Correlation coefficients of the model of the Russian company
|
х1 |
х2 |
х3 |
х4 |
х5 |
х6 |
y |
х1 |
1 |
|
|
|
|
|
|
х2 |
-0,15181 |
1 |
|
|
|
|
|
х3 |
0,31946 |
-0,09440 |
1 |
|
|
|
|
х4 |
-0,67534 |
0,17756 |
-0,19920 |
1 |
|
|
|
х5 |
-0,37142 |
0,11928 |
-0,02638 |
-0,27355 |
1 |
|
|
х6 |
0,35192 |
-0,14191 |
0,05150 |
0,06001 |
-0,67927 |
1 |
|
y |
0,21398 |
-0,10595 |
0,48922 |
0,21665 |
-0,28447 |
0,57061 |
1 |
Table 3 shows that the most significant effect on the percentage of passengers transported on innovative trains is provided by the factor "availability of innovative compounds" (correlation coefficient is 0.57). From the Russian Railways model, factors x1, x2, x4 and x5 are excluded due to their least or negative impact on the result. Thus, the new equation has the following form (formula (8):

When the Fisher criterion value is recalculated for the new equation, the actual value is 5.23, which is higher than the table value and indicates the significance of the model.
To analyze the correlation coefficients of the model of the Chinese railway company, the data are presented in Table 4.
Table 4
Correlation coefficients of the model of the Chinese company
|
х1 |
х2 |
х3 |
х4 |
х5 |
х6 |
y |
х1 |
1 |
|
|
|
|
|
|
х2 |
-0,08704 |
1 |
|
|
|
|
|
х3 |
-0,25128 |
0,14331 |
1 |
|
|
|
|
х4 |
0,24415 |
-0,45670 |
-0,80464 |
1 |
|
|
|
х5 |
-0,48877 |
0,01991 |
0,36031 |
-0,06389 |
1 |
|
|
х6 |
0,38279 |
-0,44964 |
-0,66855 |
0,67729 |
-0,45325 |
1 |
|
y |
-0,25999 |
0,15206 |
0,91458 |
-0,65275 |
0,49744 |
-0,74605 |
1 |
Table 4 shows that the factor x3 (passenger turnover of railway transport in the country) has the greatest effect on the percentage of passengers transported by innovative compounds, the correlation coefficient is 0.91. It is necessary to focus attention on the paired coefficients between the factors x3, x4, x6, since multicollinearity is possible. To check for this phenomenon, the criterion χ2 is used. Based on the results of calculations, the value of this criterion was 12.4 with a tabular value equal to 9.48. Since the calculated value exceeds the tabulated value, a conclusion is made about the presence of multicollinearity factors in the model. The elimination of the factors x4, x6 allowed the transformation of the multiple regression equation (formula (9):

Verification of the model for Fisher's adequacy also showed that the model is statistically significant.
In order to determine to what extent the resultant is dependent on a particular model factor, the authors used the partial correlation coefficients calculated by formula (10):
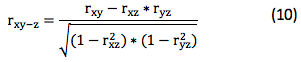
Based on the results of the calculations, it was revealed that the innovation development of JSC Russian Railways is more affected by the presence of innovative trains that represent the "technology" factor (the coefficient of the private correlation is 0.63). In the case of the Chinese railway company, the "share of passenger turnover of the railway transport", which represents the "competition" factor, has the greatest influence (the value of the coefficient of the private correlation is 0.92).
As conclusions and economic interpretation of the results of the modeling study for JSC "Russian Railways" it is necessary to note the possibility of additional purchase of innovative compounds for their direct commissioning, since the connection of this factor and innovation development is direct, therefore, the increase in the park will positively affect the development of the company. However, the company's expected profit should be taken into account: in 2017, the expected profit of the Russian company is 3 billion rubles; in 2018 the forecast values are 9 billion rubles. The average cost of innovative compounds is 60 million rubles (the price varies depending on the number of wagons in the composition). Consequently, the allocation of 15% of net profit for the purchase of innovative compounds will give an opportunity to purchase at least 7 trains in 2017. The purchase of innovative compounds will also reduce operating costs, increase the mileage between locomotive repairs, switch to cheaper fuel (use of gas), and increase capacity through the introduction of high-speed trains.
As for the Chinese railway company, when adjusting its strategy of innovative development, it is necessary to take into account such a highly influential factor as passenger turnover of railway transport. It enhances the mobility of the ever-growing population of China, thus increasing the volume of passenger traffic will positively influence the development of the whole company.
Authors thank Anna A. Klukina, PhD student of Saint-Petersburg State University of Economics, for help in preparing statistical material for this research.
Barnett H.G. (1953) Innovation: the Basis of Cultural Change, McGraw-Hill publishers, p. 45-69
Drucker P. (2007) Innovations and entrepreneurship, Alpina Books, p. 26-56.
Drucker P. (2006) The Executive in Action: Managing for Results, Innovation & Entrepreneurship, the Effective Executive/ New York: Harper Business, p. 26-56
Fixsen D.L, Naoom S.F., Blase K.A., Friedman R.M., Wallace F. (2015) Implementation research: A synthesis of the literature. Tampa: University of South Florida, Louis de la Parte Florida Mental Health Institute, The National Implementation Research Network; pp. 89-123
Gallivan M.J. (2011) Organizational adoption and assimilation of complex technological innovations: Development and application of a new framework. DATA BASE for Advances in Information Systems; 32(3):51–85. doi: 10.1145/506724.506729
Graham I.D., Logan J. (2014) Innovations in knowledge transfer and continuity of care. The Canadian Journal of Nursing Research; 36(2):89–103
Hayati B.T. BPTT 3133 Technology Transfer in Business [Website]. URL: http://www.slideshare.net/nabilahnajah/sem-5-tt-week-1?from_search=1. (Last access: 05.04.2017).
Hoffman K., Parejo M., Bessant and J., Perren L. (1998) Small firms, R&D technology and innovation in the UK: A literature review. Technova-tion, 18(1), pp. 39- 55
IMD, “The World Competitiveness Scoreboard 2014” (2014) http://www.imd.org/uupload/IMD.WebSite/wcc/WCYResults/1/scoreboard_2014.pdf.
Marcus H. (2012) Patent management in entrepreneurial SMEs: a literature review and an empirical study of innovation appropriation, patent propensity, and motive. R&D Management, 43(1), pp. 21-36
Mendel P., Meredith L., Schoenbaum M., Sherbourne C., Wells K. (2014) Interventions in organizational and community context: A framework for building evidence on dissemination and implementation in health services research. Administration and Policy in Mental Health and Mental Health Services Research; 35(1):21–37. doi: 10.1007/s10488-007-0144-9
Panzano P.C., Roth D. (2016) The decision to adopt evidence-based and other innovative mental health practices: Risky business? Psychiatric Services; 57(8):1153–1161. doi: 10.1176/appi.ps.57.8.1153
Pawson R., Greenhalgh T., Harvey G., Walshe K. (2015) Realist review: A new method of systematic review designed for complex policy interventions. Journal of Health Services Research and Policy;10(Suppl 1):21–34. doi: 10.1258/1355819054308530
Propharma Group Approach to Technology Transfer [Website]. URL: http://www.slideshare.net/ProPharmaGroup/approach-to-technology-transfer-bob-beall-19009502?from_search=3 (last access: 08.02.2017)
Robert D. Atkinson (2012) Innovation economics: The Race for Global Advantage. US, p. 45-48.
Schumpeter J.A. (1982) Theory of Economic Development. - Transaction Publishers, pp. 78-99
WIPO Statistics Database: Statistics on Patents [Websiate]. URL: http://www.wipo.int/ipstats/en/statistics/patents/ (last access: 08.03.2017).
1. Saint-Petersburg State University of economics, Department of international business, Russia. e-mail: m-epstein@yandex.ru
2. Corresponding author: Korea University of Technology and Education (KOREATECH), School of Industrial Management, phone +82-10-9996-9553, e-mail: shvetsova@koreatech.ac.kr