![]() ISSN 0798 1015
ISSN 0798 1015

![]() ISSN 0798 1015
ISSN 0798 1015
Vol. 39 (Number 26) Year 2018 • Page 21
Larisa Akramovna FILIMONOVA 1; Elena Gennadievna MATYS 2
Received: 12/02/2018 • Approved: 16/03/2018
ABSTRACT: The article presents the results of variational-scenario studies on the substantiation of the significance of modeling in the process of feasibility studies of the amount of financing for the maintenance, operation and reconstruction of a section of the highway, summarized and formulated the features and limitations in the use of the statistical apparatus in constructing long-term forecasts for the development of the region and studying the intensity traffic flow. |
RESUMEN: O artigo apresenta os resultados dos estudos de cenários variacionais sobre a fundamentação da significância da modelagem no processo de estudos de viabilidade da quantidade de financiamento para a manutenção, operação e reconstrução de uma seção da rodovia, resumiu e formulou as características e limitações no uso do aparelho estatístico na construção de previsões de longo prazo para o desenvolvimento da região e estudando a intensidade fluxo de tráfego. |

The basis of the road economy of the Russian Federation is a network of motor roads with a total length of more than 900 thousand km, according to [1,2], including federal and territorial public roads that are in federal ownership and property of the constituent entities of the Russian Federation, as well as departmental roads. Automobile roads are the most important link in the transport infrastructure, without which no branch of the economy can function efficiently in the market. The efficiency of the use of road transport and road safety depend on the complexity of the road network and its quality.
Automobile roads create the conditions for satisfying the ever growing needs of the entire economy in transportation by road. The intensity of traffic on the roads continuously and uncontrollably increases, which makes it necessary to build and reconstruct roads in a very remote perspective. However, the length of motorways of the corresponding technical level [4] is estimated only by the first tens of thousands of kilometers, so the problem of the state and creation of a modern network of highways remains one of the most urgent for Russia. For the stable development of the road industry in Russia, three components are needed: financing, innovation, quality control. The constant inflow of large investments is fundamental. In this connection, according to Gazprombank "... from March 16, 2016 the government intends to raise the tariff for the use of federal routes from today's 1.53 rubles. for 1 km to 3.06 rubles. "[5].
The road industry is also affected by the weakening of the national currency, which raises prices for machinery used in construction; there are problems with technical re-equipment, as a significant part of construction equipment is bought abroad. In the opinion of the authors of the article, the problem of choosing an adequate statistical apparatus in assessing the intensity of the functioning of the road economy remains very topical.
The purpose of this study was long-term forecasting of the investment attractiveness of the development of the road infrastructure of the Tyumen region. The object of the study was the methods of long-term forecasting of traffic intensity on highways. The subject of the study is a section of the road between Nefteyugansk and Surgut 39-49 km in the Tyumen Region located within the West Siberian Plain and belonging to the regions of the Urals Federal District.
Calculation of the existing and forecasting of the prospective intensity of traffic on the roads is "in determining the likely number of vehicles traveling between the pairs of corresponding populated areas of the territory in question, the correspondence between which are significant. At the same time, the forecasting of traffic intensity is reduced to the formation of flows of an existing or prospective fleet of vehicles on the corresponding network of highways of the territory under consideration "[5].
Currently, most of the available forecasting methods are adapted to the features of the forecast for traffic intensity on highways. There are methods designed to predict traffic intensity on individual, specific roads, and on the road network. In this case, the forecast methods are based on the account of various factors, which, according to the authors [8,10,11-13], have a significant effect on the traffic intensity.
Depending on the approach to predicting traffic intensity, the methods used can be divided into three groups: extrapolation methods; balance methods (Program-Target Planning Method, Financial-value method, etc.); Model (factor) methods (stochastic and deterministic models).
Extrapolation methods are the simplest and most accessible for economic entities that need objective predictions. They are based on the condition of maintaining the current trends in the intensity of movement in time. The most widespread among them was the method of direct extrapolation, in which the forecasting of the intensity of motion is carried out on the basis of the establishment of the existing intensity, which increases in accordance with the tendency of its change revealed over several previous years, which makes it possible to realize the possibilities of the scenario approach in the process of selecting the most adequate mathematical function by the analyzed information on the dynamics of a given evaluation object. In practice, the method of selection of functions is widely applicable in view of the availability of appropriate functionality of software products for business planning (Business-Pro, Project Expert, Business-analyst, etc.), Microsoft Office (EXCEL) and IBM SPSS Statistics 20.
The method consists in the sequential application of various mathematical functions for a number of quantitative data for a sufficiently long period of observation and an estimation of their adequacy-approximation by means of calculating and comparing statistical and mathematical parameters, for example, such as variance of approximation, variation (relative error of counting), consistency criteria and etc.
This method allows you to build trends for the medium and long-term prospects. The disadvantages of the method include its limited capabilities in anticipating seasonal and cyclical fluctuations, which are most typical for the finished products of road construction enterprises, and therefore the method was supplemented with the functionality of the Moving Average (EMA) method - the exponential moving average model and the index method for estimating seasonality and cyclicity:
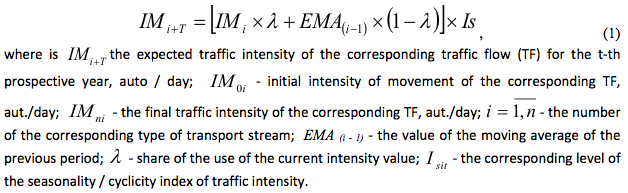
Extrapolation model based on exponential moving average with seasonality / cyclicality (SLMA) Intensity of movement (IM):
Also, the method of average values (The method of averages, MA) applies to the group of methods of extrapolation, the main essence of which is to establish and substantiate a period of history that is the most representative from the position of anticipation and foresight (the preservation of the revealed regularities "yesterday" for the future) using models of average absolute growth, a scheme of simple and compound interest.
The compound interest model is the most attractive for the credit and banking sector and forms the basis for calculating annuity payments under the loan agreement.
The method of extrapolation is advisable to use in the conditions of the existing network of highways, when in the future it is not supposed to carry out works to build new and improve the technical level of existing roads, which raises the level of feasibility of design solutions developed on the basis of forecasts constructed using this method.
Having identified the most significant indicator for predicting the intensity of pavement use, the forecasting of the development indicators of the research subject for 2016-2038 was carried out. based on the extrapolation method. For this purpose, the state of the research subject was initially assessed in terms of the following parameters: traffic intensity, population dynamics, motorization level of the population of Russia and the Urals Federal District, dynamics of vehicular traffic in the Nefteyugansk-Surgut area of 39-52 km.
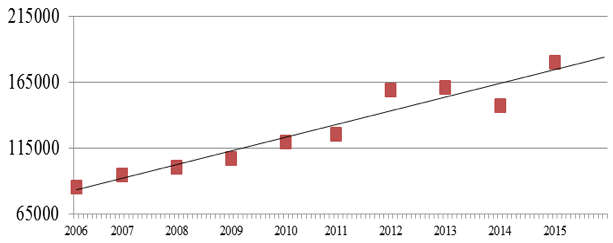
The intensity of traffic in the sector of the airport Nefteyugansk - Surgut 39-52 km. (Figure 1) shows a steady increase in the transit value of the region.
Figure 1
Dynamics of vehicular traffic in the Neftyugansk-Surgut port area,
Surgut 39-52 km (intensity of movement of cars, fiz.ed./day)
The main fisheries of the hydrocarbon raw materials of the Yamal-Nenets Autonomous District are provided by traffic flows through the territory of the Khanty-Mansiysk Autonomous Okrug.
Figure 2 shows the dynamics of the population living in the Tyumen region, which is the basis for research and iterations in calculating the prospective intensity of the traffic flow. In accordance with the data of the Russian Federal State Statistics Service and the regional statistics committee of the Tyumen region [6], from 1990 to 2014, according to the region with the districts, the annual population growth was 0.48% / year (0.93% for the KhMAА), if reduce the interval to 2010-14. the population growth for the year in the region showed an increase of 1.217% (for KhMAO at 1.227% / year), which indicates the acceleration of population reproduction processes in the region over the last five years, with the dynamics leveling over the territory.
Figure 2
Number of resident population KhMAO, pers.
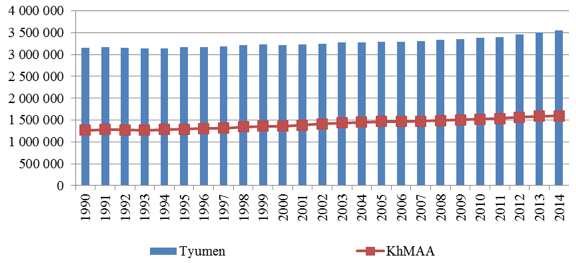
Table 1 presents the results of calculating the level of motorization of the population of the Urals Federal District in dynamics. From the data in Table 1 it can be seen that the level of motorization of the population in Russia for the analyzed period increased from 168.4 units / 1000 people. up to 289.6 units / 1000 people, which is an increase of 72%. As for the Urals Federal District, for the analyzed period the level of motorization of the population increased by 86%, which exceeds the indicator for the whole of the Russian Federation.
Table 1
Level of motorization of the population
Russia and the Ural Federal District units per 1,000 people.
Indicators |
Observation period, year |
|||||||||
2005 |
2006 |
2007 |
2008 |
2009 |
2010 |
2011 |
2012 |
2013 |
2014 |
|
Russia |
168,4 |
177,0 |
194,4 |
212,3 |
219,4 |
228,4 |
242,0 |
257,5 |
273,1 |
289,6 |
UFD |
174,9 |
192,5 |
213,1 |
232,1 |
239,7 |
254,1 |
265,8 |
283,6 |
304,1 |
326,1 |
Sverdlovsk region |
163,7 |
191,1 |
219,4 |
238,9 |
253,5 |
275,5 |
285,6 |
303,8 |
312,6 |
321,7 |
KhMAА |
226,7 |
239,2 |
256,8 |
272,5 |
271,4 |
266,1 |
275,8 |
282,1 |
302,4 |
324,2 |
YaNAА |
187,8 |
197,8 |
207,1 |
221,3 |
222,7 |
220,7 |
228,2 |
242,9 |
268,7 |
297,2 |
Tyumen region |
195,0 |
207,0 |
221,8 |
251,5 |
261,3 |
270,3 |
276,5 |
301,8 |
295,0 |
288,4 |
Челябинская обл. |
160,8 |
172,2 |
187,3 |
204,3 |
207,5 |
228,7 |
243,4 |
262,9 |
309,1 |
363,4 |
The level of motorization in the Tyumen region for the period under review has increased from 195 units / 1000 people. up to 288.4 units / 1000 people, which was an increase of 48%, in the KhMAO territory, the increase is estimated for the analyzed period by 43.01%. It should also be noted that the share of motorization of the population of the Tyumen region without autonomous districts decreased from 18% in 2005 to 15% in 2014.
Rapid growth in the level of motorization occurred in the 2000s, in subsequent years, growth will slow somewhat. This is evidenced by a gradual decrease in the volume of sales of new cars - an average of 4% per year, the exception is the period 2014-2015, which fell by -40% in January-June 2015 to APP ., which is more related to unregulated factors. According to the performed calculations, by 2030 the level of motorization in KhMAА will be about 400 cars / 1000 people. Thus, the average rate of growth in the level of motorization will amount to 1.5% per year, and the expected rate of growth in traffic on bridges in the region of Surgut is 3.4% per year, with the largest increase in the population in the KhMAO fell on the period of 2002 -2014 years - 1,23% per year.
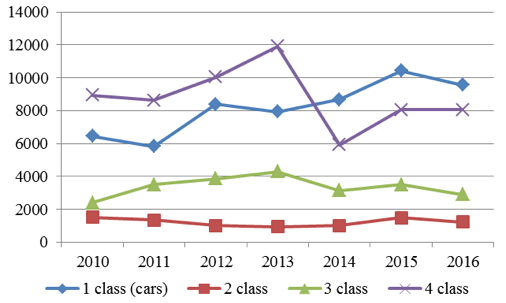
In many cases, when there is a decrease in the time of communication between the corresponding points, this affects the structure and location of the economy, the pace of economic development of roads served by the roads. The most important criterion for justifying investments in the construction of new or reconstruction of existing highways is the prospective traffic intensity. The guidelines and recommendations [7] emphasize: the introduction of new or upgrading the technical level of existing roads is accompanied by significant changes in the existing flows of vehicles in the directions. At the same time, in order to estimate the real load of the motor road section by transport, it is incorrect to use the absolute intensity value, since the composition of transport streams (TF) is not taken into account. The composition of the TF is characterized by the ratio of vehicles of different designs in it having different overall dimensions and dynamic characteristics. Therefore, the TF composition has a significant influence on all parameters characterizing the traffic. To take into account in the actual composition of the TF the influence of various types of vehicles on road loading, the coefficients of reduction of kpr to a conventional passenger car are applied (Figure 4).
To determine the reduced intensity, the coefficient of reduction was used in [7].
Figure 3
Dynamics of the intensity of traffic in the sector of the airport
Nefteyugansk - Surgut 39-52 km (individual units / day)
-----
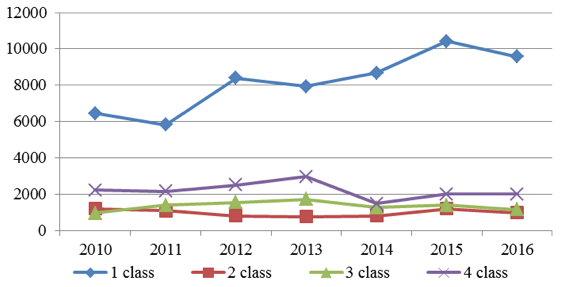
Figure 4
Dynamics of traffic intensity in the Nefteyugansk-Surgut
a / d section is 39-52 km (reduced units / day)
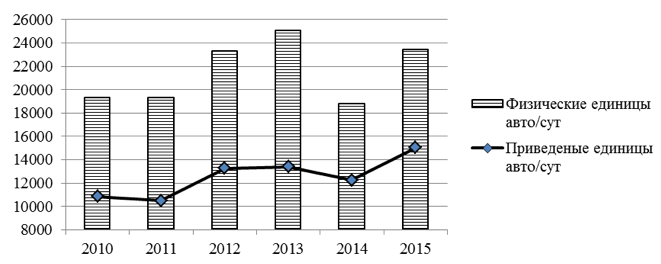
The intensity of traffic on the road segment of the Nefteyugansk-Surgut motorway is 39-52 km (traffic intensity, physical units / day and units / day) in Figures 3-5. In accordance with the dynamics of Figure 6, it can be argued about a decrease in business activity of households. subjects in the transport services market from 2013, and even before the introduction of a fee from the kilometer of the road (November 2015), the explanation can serve as the collapse of the national currency, as the "lion's" share of goods transported through Russia refers to the import.
Due to the limited resource of the article, further in the calculations it was decided to apply the weighted average value of the current and prospective traffic intensity for the transport stream without classifying it, which is admissible for analytical purposes and preserves the features of the evaluation object, since the weighted average allows preserving the established structures and proportions in transport flow (variations in the spread of individual and averaged values of less than 4%). In the future, the differentiation of the prospective intensity by the type of transport stream is required. Figure 5 shows the dynamics of the average annual traffic traffic intensity with weighted average car values mper day.
Figure 5
Dynamics of vehicular traffic intensity in the
Nefteyugansk-Surgut airport segment 39-52 km
In the process of researching the selection of the optimal segment of the retrospective observation period, multiple iterations were carried out at the level of technical and economic and social indicators of the development of the "Construction" branch and the region as a whole, with an assessment of cause-effect relationships that manifested itself to varying degrees depending on the period observations and the object of research, the results of which are described in the following sources [12, 13]. In accordance with what, an informed decision was made on the appropriateness of using such segments as: 2006-2015. and 2010-2015.
Forecasts are presented in two versions:
Project 1 (optimistic option) provides for a retrospective period from 2006-2015, the first time periods of which fell on the heyday of the construction industry in the region and the region as a whole.
Project 2 (pessimistic option) provides for a shorter period of retrospective from 2010-2015, which was followed by a post-crisis period that affected both the industry and the socio-economic characteristics of the region as a whole.
Project 1 for today loses its attractiveness (realism) in view of the deterioration of geopolitical relations, the fall in world prices on the international hydrocarbon market, which negatively affects the well-being of Russians and, first of all, on the incomes of the employed population in the extractive sectors of the economy, migration from the territory of KhMAO and YaNAA.
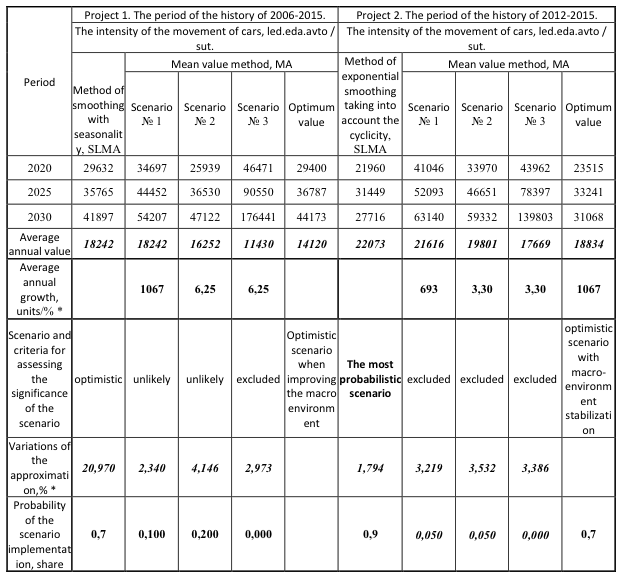
Note that scenario № 1 corresponds to the scheme of absolute growth, scenario № 2 corresponds to the simple interest scheme, scenario № 3 - the scheme of compound interest, developed on the basis of the retrospective data of the period 2006-2015; Scenario №1-1 corresponds to the scheme of absolute growth, scenario №. 2-1 corresponds to the simple interest scheme, scenario No. 3-1 - the scheme of compound interest, developed on the basis of historical data of the period 2010-2015.
Project 3 (optimal, most probabilistic option) is developed on the basis of a weighted average solution when choosing the significance of a scenario constructed using the appropriate extrapolation model (formula 2):
The results of calculations of the forecast of the prospective intensity of the TF traffic on the section of the public road with a hard surface by the mean values method are presented in physical (figure 6) and in the units given, auto / day.
From the point of view of growing prosperity and prospects for the development of the region, the indicator of the intensity of public roads with hard surface will tend to the maximum value (Optimistic variant of the forecast, Table 2, Boxes 4-7).
In accordance with the dynamics of forecast values, one should recognize the presence of a range of traffic intensity TP from 16678 to 20097 fiz.ed./dut. as of the year 2020. This fork of the forecast is primarily determined by the intensity of motorization of the population of the region, rather than production and economic relations of economic entities and market relations. The latter occupy the "lion's" share of cause-effect relationships, which determines the intensity of the TF movement in the reduced units.
Figure 6
The forecast of the traffic intensity of vehicles in the Nefteyugansk-Surgut a / d
section is 39-52 km, physical units per day for 2015-2020. seasonally adjusted
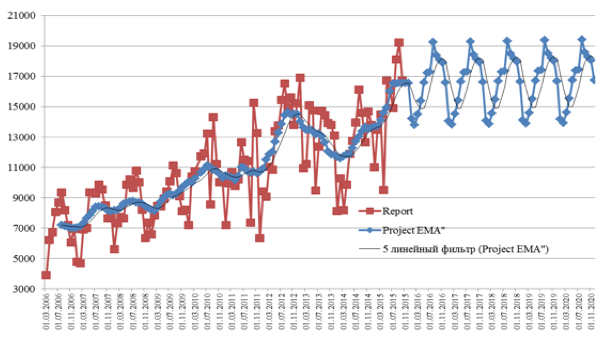
We believe that the forecasts based on SLMA are most likely to be achieved (Project 1 set 70% of the probability with Russia's GDP growth at 8% per year, Project 2 set 90% of the probability with Russia's GDP growth at 4% per year).
In the process of assessing the dynamics of the average monthly traffic flow intensity, clear trends have been identified:
- in the period from 2006 to 2009, seasonal fluctuations with peaks occurring for summer periods with an annual increase of about 6.25% per year (1,067 cars in the units given);
- in the period from 2010 to 2015 there are two-year cycles with an annual increase of 3.3% per year.
Therefore, when predicting traffic intensity, the exponential moving average method with seasonality / cyclicity (SLMA) was used, the forecasts are presented in Table 2 of columns 4 and 8.
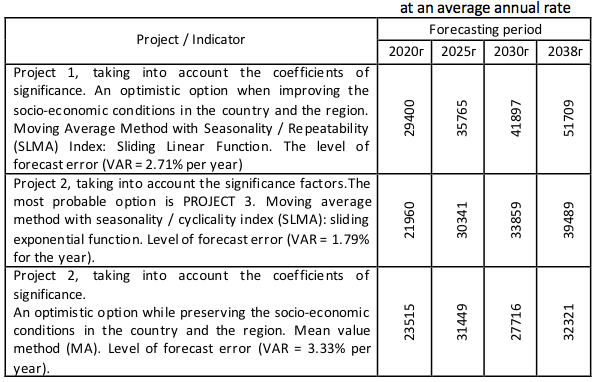
Summarizing the results of the iterations and modeling the prospective intensity of the traffic flow, and also examining the current state of investment activity in the region in the framework of the implementation of concepts and programs of federal and regional significance, we come to the conclusion that the most probable option should be the variant developed using the Moving Average Method by the exponential function with the cyclicality index (SLMA) taken into account (Project 3. Table 3).
According to the calculations, the demand for movement on a given site will grow less than one and a half times - from 23.5 thousand units. in 2015 to 32.3 thousand units. in 2038. Thus, the prospective traffic intensity of the 39-52 km section of the Nefteyugansk-Surgut airport in the units given per day will be - by 2020, 22 thousand units / day, by 2038 32.3 thousand units / day. The main share, namely from 60% to 68% (in the calculation physical units are applied) will fall on cars. The share of cargo vehicles is projected at the level of 23-32%. The main share among trucks will take motor vehicles of 4 classes with a carrying capacity of more than 5 tons (10-13%).
Table 2
Average annual values of the current and future traffic flow
along the road section on the section of the Nefteyugansk-Surgut
airport - Surgut 39-52 km, in the units given per day
The summary of the forecasts made in Table 3 allows us to distinguish the range of max / min values of the average annual calculated values of the prospective traffic traffic intensity or a given section:
- in the case of preservation of socio-economic indicators achieved in the period from 2010-2015 in the long-term perspective, the economy of the country and the region should be guided by the traffic intensity in the range from 32321 to 39489 priv.eda.avto / sut. as of 2038 (Project 2);
- in case of improvement of the geopolitical situation, with restoration of intensity of social and economic development of the region and its investment attractiveness, we come to the perspective intensity of the traffic flow in the range from 51709 to 55991 priv.ed.avto / sut. as of 2038 (Project 1).
Table 3
Perspective traffic intensity transport flow in the sector of the city of
Nefteyugansk - Surgut 39-52 km, in the units given per day for 2020-2038.
The combination of these methods and approaches allowed to take into account both objective and subjective factors of traffic flows on a given section of the highway, overcome the limitations associated with the delay in providing, the incompleteness and inaccuracy of certain quantitative data, and the subjectivity of qualitative assessments in setting the probabilities for the implementation of the scenario and option.
We should especially note the priority of the scenario scenario approach in forecasting, which made it possible to single out the field of possible variants of the development of events, which allows timely pre-emptive actions and minimizes the risks and negative consequences of external forces' influence on the investor, as well as create the conditions for extracting the maximum benefits from the realization of that or other scenario.
The developed variational-scenario approaches in assessing the prospective traffic intensity of the transport approach make it possible to determine the readiness of regional executive authorities to respond to identified environmental influences and to pool resources within the municipal formation to increase the capacity of the motorway, improve its quality and create safe conditions for traffic flows along the to such a significant section of the city of Nefteyugansk-Surgut is 39-52 km.
In addition, the forecasts indicate an inevitable increase in the traffic intensity in the whole region and in particular on this section of the road, which raises the need to assess the ability of the municipal formation to conduct systematic work and to attract external resources (Russian and foreign investments) for the implementation of reconstruction programs and / or the construction of parallel sections of roads in the framework of preventive works to create conditions for the safety of traffic and livelihoods in the Jelenia points. Of particular relevance, research data at the regional level was received due to the withdrawal of the main source of welfare and prosperity of the Tyumen region from the regional budget and the termination of compensation payments from the federal budget - the mineral extraction tax - at the turn of 2009-12.
The recommended range of traffic flow intensity (Table 3) at a particular section of the road has a high degree of realism and attainability in conditions of stability, certainty and prospects for the development of the region (an error in the account from 1.79% from 3.3%). And then the matter of technology, to calculate the investment attractiveness of the investment project for construction / reconstruction, or the maintenance / operation of that or a section of the highway.
The provision of reliable motor transport links contributes to the integration of industry not only within the same territory, but also with the adjacent territories of the Tyumen region and the districts, which becomes particularly relevant in the face of rising railway tariffs and within the concept of import substitution. The lack of reliable and functional transport links on the one hand reduces the possibility of importing Tyumen enterprises' products to remote areas of the autonomous regions - KhMAА and Yamal-Nenets Autonomous District, which is a deterrent to the development of these enterprises and the implementation of social programs by the executive authorities. On the other hand, it leads to a monopoly of producers because of the inability to import such products from other producers and, as a consequence, overstating the real cost of manufactured and sold products, both for industrial purposes and for public consumption. And also taking into account the practice of the last five years, in the conditions of the post-crisis period, we believe that the forecasts require further refinement and correction using correction factors calculated using the balance method for predicting the traffic flow intensity.
According to the balance method, the prospective annual average traffic intensity should be adjusted in accordance with the following list of factors:
- total reduced population in the i-th and j-th populated areas, people;
- federal and regional plans and programs for the development of the region, road maps and investment projects, implemented and planned for implementation in the region, mln. in the prices quoted;
- gross regional product and volumes of industrial production and extraction of minerals, million rbl. in the prices quoted;
- coefficient of connectivity of i-th and j-th settlements, determined depending on their administrative importance and subordination;
- the level of saturation of the territory with cars, buses and trucks, respectively, auto / 1000 people;
- exchange rates and their impact on the purchase price, maintenance and operation of vehicles;
- average speed of movement of cars, buses and trucks in reference conditions;
- average duration of work during the day of cars, buses and trucks, respectively, h / day.
1. Federal Road Agency. A source: http://rosavtodor.ru/
2. Unified transport system of the Russian Federation. A source:http://www.ets-rf.ru/
3. Analytical agency Autostat. A source: http://www.autostat.ru/.
4. Federal Law of November 08, 2007 No. 257-FZ "On Roads and Road Activities in the Russian Federation and on Amending Certain Legislative Acts of the Russian Federation" // Collection of Legislation of the Russian Federation. - 2007 - No. 46. - Art. 5553/
5. Gazprombank warned about the second wave of price increases due to the collection from trucks: A source: http://www.rbc.ru/finances/26/11/2015/ 5656e2669a79473b1996a7c2.
6. Territorial body of the Federal State Statistics Service for the Tyumen Region. A source: http://tumstat.gks.ru//
7. Decree of the Ministry of Transport of the Russian Federation of June 19, 2003 N OS-555-r "On putting into effect" of the Manual on traffic intensity forecasting on highways "(for pilot application)". A source: http://base.consultant.ru/cons/ cgi/online.cgi?req=doc;base=EXP;n=367643.
8. Eliseev, S.Yu. (2008) Public-private partnership in the transport sector. Foreign experience . Mocsow: VKSS Connect. №2. p.. 8-12.
9. Zvyagintsev, M.Yu. (2016) Report on the Russian economy // The World Bank in the Russian Federation. No. 958.-p. 14-18.
10. Zenkina, MV, & Gorodinskaya ,NV (2014) The current state of the road network in Russia. Omsk: Proceedings of the All-Russian Scientific and Practical Conference with International Participation p. 123-128.
11. Konovlyanke, V.I. (2011) Organization and traffic safety. oscow: Transport, p. 183.
12. Filimonova, LA, & Minnullin, RN, & Devyatkina, Ya.A.. (2014) Monograph: improving the methodological foundations for the development of a strategy for the development of a municipal formation on the basis of optimization and use of its internal reserves (on the example of the Ministry of Defense of Tobolsk). Tyumen: Publishing house of RIO TUMMASU 2014. p. 111.
1. Federal State Budget Educational Institution of Higher Education "Industrial University of Tyumen", 259 room, 2 Lunacharsky St., Tyumen, Russian Federation, 625000. E-mail: lorafil@ya.ru
2. Federal State Budget Educational Institution of Higher Education "Industrial University of Tyumen", 259 room, 2 Lunacharsky St., Tyumen, Russian Federation, 625000. E-mail: matys_e@mail.ru