![]() ISSN 0798 1015
ISSN 0798 1015

![]() ISSN 0798 1015
ISSN 0798 1015
Vol. 39 (Number 34) Year 2018 • Page 25
Jahangir Ahmad BHAT 1; Pushpender YADAV 2
Received: 31/12/2017 • Approved: 03/04/2018
ABSTRACT: The paper provides an overview of key performance measurement indicators used to measure the nonfinancial performance of the small-scale businesses. It discusses the importance of performance measurement and identifies the factors which cause disruption in operational activities. Further, the paper provides insight how disruptions in operational process affect the performance measurements. The study provides a theoretical viewpoint, supported by empirical evidence from the handicraft sector; on how prominent operational disruptions affect the business performance of handicraft sector. We conclude the paper by discussing results derived from the SPSS and SmartPLS software’s and how the results will be theoretically implemented in strategy formations that business development. |
RESUMEN: El documento proporciona una visión general de los indicadores clave de medición de Actividad utilizados para medir el desempeño no financiero de las pequeñas empresas. Discute la importancia de la medición del rendimiento e identifica los factores que causan interrupciones en las actividades operacionales. Además, el documento proporciona una idea de cómo las interrupciones en el proceso operativo afectan las mediciones de rendimiento. El estudio proporciona un punto de vista teórico, respaldado por evidencia empírica del sector de la artesanía; sobre cómo las interrupciones operacionales prominentes afectan el desempeño comercial del sector artesanal. Concluimos el trabajo discutiendo los resultados derivados del software SPSS y SmartPLS y cómo los resultados se implementarán teóricamente en formaciones estratégicas para el desarrollo de negocios. |

In developing countries generally and especially in India small-scale business has enormous potential to provide opportunities for employment, revenue generation, and foreign investment (Pizam, 1990). The Handicraft sector is an important and apt alliance of small-scale manufacturing sector which is much famous for its efficiency and proficiency. The aesthetic values of Indian manufacturing industry especially handicraft sector has devote world towards Indian crafts and attracted global attention towards Indian culture. The underpinned contribution of the handicraft sector has boosted national income, has become a key resource of export and significant source of employment (Keohane and Crabtree, 2016). Above and beyond economic advantage, the craftsmanship is a unique expression of a particular culture or community through local crafts and artistic materials. The sector is vastly scattered, a highly labour-intensive cottage based resource of the economy, where the mainstay of the set-ups/firms is to create a fortune, and value through renovating raw materials and information into products (Wang et al., 2013). Further, with the increased market and modern concept of globalization, the artistic products are becoming more diversified, personalized, and commoditized. Due to global market trends and competition the updated speed as well as consumption of goods is on a continuous growth, now it is no longer possible to keep traditional handicraft sector and the craft products in isolation from these changing trends of the global village. The artisans find their products competing with the world and the goods made up of machines, so the modern trends needed to be introduced in such art and craftsmanship otherwise this art is getting diminished and may come to an end in near future.
Though the era of industrialization is growing and is blooming in India but it is unidirectional and uni-facial (by unidirectional and uni-facial we mean only those of big firms are growing which have enjoyed sensation earlier), while small sector industries/firms (especially handicraft sector) are deteriorating day-by-day due to degradation of raw material supply, disruptions in operation process, negligence of artisans and delinquency of government towards the sector (Bikse & Rivza, 2013). Further, it is not easy for home-based handicraft industries to remain competitive in the market where giant industries are the competitors, it has become obligatory for the craft firms to expand their product offerings and offer high levels of customization to sustain in the competition. Growing global competition and advancement in machine technology in present time have engendered expulsion and ejection of the handicraft business due to the genre of deficient competition and negligence of liaison with modern technology. Though the problems in the handicraft business are an incomputable, but operational disruption in supply chain activities of the handicraft business are the acute and first immediate problems which needed to be addressed for the upliftment of the sector activities (Sultan & Saurabh, 2013). The paper analyzes the relationship between operational disruptions and performance indicators that are productivity, efficiency and flexibility in the handicraft business. Operational disruptions are conceptualized as working condition disruptions, social issues, insecurity in the sector and finally middlemen while performance is specified through efficiency, productivity and flexibility.
Due to unorganised and informal nature of the sector assessing the performance of handicraft has long been an important yet challenging issue for economic researchers and authorities. The least slapdash but much important sector of the economy has spurred and encouraged researchers to put efforts and develop quantitative measures to assess means through which the intended goals can be achieved. The measures which have been largely focused and evaluated in past literature for the flaws and weaknesses of the handicraft sector that have been found related to sickness of the sector are availability of raw material, transportation facilities, lack of tourism, mechanical tools, financial support, middlemen exploitations, government delinquencies, stiff competition, marketing & distribution, machine-made goods. Further, the sector is deteriorating due to neglecting artisans and delinquency towards the welfare of the artisans and many more (Goldman, Nagel, & Preiss, 1995, Fisher, 1997, Davenport & Prusak, 1998, Driese, 2000, Chatur, 2005).
“The death of Artisan is like a wood falling down tree after a tree: master after master makes no sound but the diminution in the performance of the sector, which is clearly showing the unheard roar and the desert of experiences” (Osto, et. al, 2009).
The existing literature clearly specifies and suggests that the firm’s especially small-scale industries need to recognize and differentiate themselves in their efficiency of operations (Greenwald and Stiglitz, 1993). Though complications in the sector are extensive, the study will be fanatic to the disruptions in the operational process or manufacturing process and how it has impacted the performance of the handicraft sector. The operational activity is one of the important links in the supply chain which binds inbound logistics and outbound logistics together. Operation activities demonstrate the relation between links of the chain, targets potential suppliers, negotiate between different stakeholders and finally facilitates the buyer with best and desirable products (Seungsup et. al, 2013). It is suggested, operation or manufacturing process is the pivot around which trustworthy relation between the all stakeholders and dependence on every links of the chain process is instigated (Abbate, 2008). The significance of operational activities in different industries is highlighted to comprehend the essence of operation in the whole life cycle of the product and product-related business (Forsman, 2011; Thomas, 1978).
Though the operational activity is a most important link in supply chain and for the life cycle of the product but many times these operational activities are disrupted by manifold intrusions, which leads to the adverse consequences on the performance of the businesses. The operational disruptions have been defined by the Basel Committee as “the risk of loss resulting from inadequate or failed internal processes, people and systems or from external events” (BCBS, 2001). Operational activities are most open to the elements of risk whether it is in the form of climate, finance, support, social, market demand or the risks related to manufacturing work itself these risks are termed as operational disruptions. Every firm related to all industries are exposed to operational disruptions as operation activities are real encounters between human ideas and the demand of the market. If the ideas are interrupted and not completed according to the market demand due to some triggered disruptions the reputational of the firm can damage (Tang, 2006). The life cycle of handicraft is not different from the other small-scale industries even it is more unprotected and insecure industry sector where disruptions are faced at every stage or the link of the supply chain. The disruptions faced at the operational level of handicrafts leads to the astringent consequence of the overall performance of the sector (Vaijayanti, 2010). Handicraft sector, in particular, is much relied on this stage as the real and physical attributes of the product are meant at this phase and failure in such activities is the failure of the totality of business (Ho & Huddle, 1976). Further, the operational process itself is the arrangement of different activities and disruptions raised from such activities negatively influence the firms operating and financial performance. The disruption includes the availability of funds, social status, and delay in delivery and reduced customer service levels (Hendricks & Singhal, 2005; Wagner & Bode, 2008).
The study will be fanatic to the disruptions in the operational process or manufacturing process and how it has impacted the performance of the handicraft sector.
After oversimplifying problems related to the sector we will keep our literature review confined to relevant aspects of developing a conceptual framework of the model by the definitions and delimitations of the concepts.
Fig. 1
Conceptual framework of the research
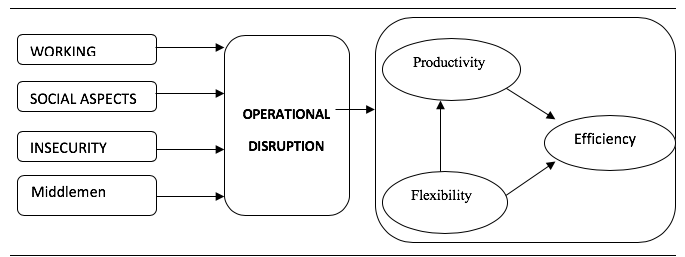
In our research, we refer operational stipulations disruptions as the risks which including both, internally-induced and externally encouraged risks for the firm's diminishing endeavours. Broadly accepted and unspoken aspect of operational process which is exposed to disruptions is operational stipulations. The operational process starts with the requirements for the operational activities that are the setting for mechanical tools, working place, raw material and the labour requirements for the work. The working stipulation is largely focused as an important link in the supply chain which inherent uncertainties such as the failure of tools and techniques, market demand, place of work, and application of modern methodology in the manufacturing process (Aziz, A. 1990., Tang and Tomlin, 2008).
The state and status of worker or labourer are described by how he is respected in the society and how much income he/she is earning from the work he does. Further the education level requirements and the training provided to conduct the job all these factors become the motivation for new entries in the sector (Chelliah & Sudarshan, 1999). The fluctuation found in handicraft sector due to social issues particularly in the country like India where organized and office work is much anticipated than unorganised work. Being an unorganised sector of work handicraft sector is facing a serious kind of social disruption where new entries are not motivated to work in the sector and existing labourers feel the disapprobation towards their work. Absentees, part-time work, clandestinely work and contempt is the common issues which are causing hindrances to the business cycles of handicrafts (Sarvamangala, 2012). Handicraft sector is the most concerned sector of informal business where recursions of social issues are negatively influential to the handicraft business.
Due to the fluctuations in business environment big industries too have witnessed ups and downs, in employment downsizing, salary cutbacks, financial shortage many more problems. Handicraft Industry is much smaller and most open to such risks, any fluctuation in market shows domino effect that is why the sector is proven to be risky place for jobs besides the job insecurity literature suggests the most common disruption or the risks in the handicraft sector is the insecurity of the products itself as they are not covered any insurance cover and widely open to the risk further artisans (Dreze & Sen, 1991). Further, the risk related to health in the sector are increasing ( Durvasula, 1992)
Since the sector of handicrafts is deprived and the artisans working in the sector mostly belong to the poor families, thus they are depended on middlemen for the assistance in multi requirements of production of crafts. The absence of middlemen may lead to multi-criteria decision-making problem. The middleman deals with selecting the best suppliers, provide financial support to the artisans and allocated order sizes & requirements. There are several approaches in the literature so believes middleman hinders the growth of artisan while some belief without middlemen craft business is impossible (Anderson and Anderson, 2002). The ability to take the firm to new heights and renovation of the sector is hurdled by interfering practices of middlemen in operational activities (Belavina and Girotra, 2012). For the long-term middlemen is a big hindrance for the wealth maximising of the sector while as for the short period profitable portion of artisans is made possible by middlemen only (Arya et al., 2017). Further, the studies state that middleman is an important stakeholder since a very long time and with the passage of time the influence has increased.
In the past and for the organised sectors financial indicators were largely considered in performance measurement systems (Yang et al, 2009). However, handicraft is an informal sector and there is a no authorized way to record financial transitions so financial indicators alone can’t measure the performance of the sector. Nonfinancial indicators of performance are equally important and most preferred dimension scales for the measurement of performance in small-sector businesses (Kloot and Martin, 2000). To identify the relationship between operational disruptions and the performance of the handicraft sector, the measures of nonfinancial performance like productivity, flexibility and efficiency must be reflected in the specific aspects of examination (Dhamija, 1975). To measure the operational perspectives of the firms or small scale business such nonfinancial measures have largely focused on evaluation. Performance is the manifestation of productivity, flexibility and efficiency of the sector at a specific point in time (Poveda et, al, 2012). These three primary dimensions of performance are considered to enhance overall performance level of the handicraft sector, which includes maximum utilization of capacity, creating quality and quick response to the market demands. However, operational disruptions affect the dimensions of performance to address this gap, this study investigates how different operational disruptions affect each performance indicators and affects the overall business performance of the sector. With this regard, this paper develops a novel framework to analyze the weather and what type of effect operational disruptions has on the performance of the sector. The contribution of our research is twofold. First, we identify the existence of a relationship between the operational disruptions and indicators of performance. Second, we identify the relation in-between performance indicators. Attempts have been made to describe links between operational disruptions on various performance indicators individually.
Proposition1a: There is a significant relationship between productivity and the efficiency of the handicraft sector.
Proposition1b: there is a significant relationship between flexibility and the efficiency of the handicraft sector.
Proposition1c. There is a significant relationship between flexibility and the productivity of the handicraft sector.
Proposition2. There is a significant relationship between operational disruptions and the productivity of handicraft sector.
Proposition3. There is a significant relationship between operational disruptions and the flexibility of handicraft sector.
Proposition4: The efficiency of the handicraft sector is negatively impacted by the operational disruptions.
The main data collection instrument was a formulated questionnaire comprising a reformulated written set of questions. The research used the self-administered survey method whereby the researcher or their representative travels to the respondent’s location and hand delivers the survey questionnaire to the respondents in the state of Jammu and Kashmir. Handicraft sector was selected as a relevant sector in case that (1) the sector is full of employment and profitable potentials, (2) the value in handicrafts is added by craftsmen through craftsmanship, (3) the growth of sales volume per year is dipping (3) the employees working in the sector feel dissatisfied and de-motivated. The above said criteria were employed to ensure that the impediments in manufacturing/ operational activities as well the performance measurement both are relevant for the sector. The resulting quantitative data was used to empirically test the research model and the associated hypotheses.
To determine the precise impact of chosen factors on the performance efficiency the steady has selected most influential factors of operational disruptions and the key factor for measuring the efficiency of handicraft sector. The overall approach that was developed to determine the steady flow is shown in fig.1. The variables ware measured using a Likert scale ranging 1=strongly disagree to 5=strongly agree. A questionnaire survey was employed and the sample was drawn from the different workers and artisans working as labourers and artisans in the sector of handicrafts. The questionnaire requested details relating to operational disruptions while manufacturing the crafts and most important questions related to the present performance efficiency of the handicraft sector. The replies to the initial questionnaire were received from 53 respondents. After two follow-ups the total replies gathered increased to 380. However, some respondents giving less response rate and were excluded from the study and finally 341 respondents were valuable respondents for the further studies. Data analysis was done in two parts: descriptive analysis was performed using SPSS statistical analysis tool for the purpose of obtaining principle component Factors, Reliability, skewness and kurtosis. (1) Mann–Whitney and chi-square Non-parametric tests were used to compare early and late responses and there was no evidence of non-response bias found. (2). Skewness and kurtosis; with the latter measures being used to test for distribution normality for each indicator’s data. (3). Proxies for the component Factors extracted are auxiliary detailed.
Further, to analyze the conceptual model and test the proposed hypotheses Structural Equation Modelling (SEM) and specifically Partial Least Square path modelling (PLS) is used. The method of SEM was chosen because it allows us to perform path-analytics modelling of complex relationships between multiple independent and dependent variables.
Table I
Reliability Statistics
Cronbach's Alpha |
Cronbach's Alpha Based on Standardized Items |
N of Items |
.845 |
.845 |
30 |
Above table shows the overall reliability of the questionnaire, taken for the purpose of analysis. The reliability is understood as the measure of internal consistency of responses between respondents (Kline, 2005). We have devised a 30 question questionnaire to measure the disruptions and performance efficiency in order to understand whether the questions in our questionnaire all reliable we measure the reliability of the items taken in the questionnaire. Each question was measured using a 5-point Likert item from "strongly disagree" to "strongly agree". A Cronbach's alpha was run on a sample size of 340 respondents with thirty questions and the value of Cronbach’s alpha was .845, which is above the normally accepted value of Alpha.
Table 2
KMO and Bartlett's Test
Kaiser-Meyer-Olkin Measure of Sampling Adequacy. |
.823 |
|
Bartlett's Test of Sphericity |
Approx. Chi-Square |
4.494E3 |
df |
435 |
|
Sig. |
.000 |
|
Table 4 Shows the KMO and Bartlett’s test while running the Factor analysis the KMO table is important for the interpretation. The KMO test is a used to measure of how suited and appropriate our data is for Factor Analysis. The test measures sampling adequacy for each variable in the model and measures the proportion of variance among the variables. For the KMO test, the rule of thumb is KMO values between 0.8 and 1 indicate the sampling is adequate. KMO values less than 0.6 indicate the sampling is not adequate and the value above 0.7 is middling and states data is adequate to factor analysis ((Hair et al., 2005). In the annexure 2 the value is .823 which is acceptable for extracting components in factor analysis. Further, using Principal Components Analysis the items are grouped into factors (Hair et al., 2005).
Table 3
Shows Component Factors extracted and the P
resupposition Property of the Constructs
Construct |
Item |
Mean |
STDEV |
Loading |
P-value |
CR |
Alpha |
AVE |
Operational Stipulation
|
WOC1 |
0.874 |
0.017 |
0.875 |
0.000 |
0.907 |
0.864 |
0.710 |
WOC2 |
0.800 |
0.029 |
0.803 |
0.000 |
||||
WOC3 |
0.837 |
0.023 |
0.840 |
0.000 |
||||
WOC4 |
0.849 |
0.021 |
0.851 |
0.000 |
||||
Social aspect |
SOC1 |
0.764 |
0.032 |
0.766 |
0.000 |
0.865 |
0.794 |
0.616 |
SOC2 |
0.817 |
0.021 |
0.815 |
0.000 |
||||
SOC3 |
0.766 |
0.033 |
0.768 |
0.000 |
||||
SOC4 |
0.791 |
0.025 |
0.790 |
0.000 |
||||
Insecurity |
Ins1 |
0.836 |
0.021 |
0.837 |
0.000 |
0.870 |
0.802 |
0.625 |
Ins 2 |
0.791 |
0.026 |
0.791 |
0.000 |
||||
Ins 3 |
0.759 |
0.040 |
0.766 |
0.000 |
||||
Ins 4 |
0.764 |
0.036 |
0.767 |
0.000 |
||||
Middlemen |
SUP1 |
0.874 |
0.020 |
0.876 |
0.000 |
0.915 |
0.876 |
0.729 |
SUP2 |
0.838 |
0.022 |
0.839 |
0.000 |
||||
SUP3 |
0.819 |
0.027 |
0.822 |
0.000 |
||||
SUP4 |
0.878 |
0.018 |
0.878 |
0.000 |
||||
Productivity |
PRO1 |
0.783 |
0.030 |
0.785 |
0.000 |
0.881 |
0.833 |
0.597 |
PRO2 |
0.793 |
0.034 |
0.793 |
0.000 |
||||
PRO3 |
0.734 |
0.040 |
0.734 |
0.000 |
||||
PRO4 |
0.793 |
0.024 |
0.793 |
0.000 |
||||
PRO5 |
0.756 |
0.034 |
0.755 |
0.000 |
||||
Flexibility |
FLEX1 |
0.762 |
0.047 |
0.762 |
0.000 |
0.857 |
0.781 |
0.599 |
FLEX2 |
0.794 |
0.035 |
0.794 |
0.000 |
||||
FLEX3 |
0.719 |
0.053 |
0.722 |
0.000 |
||||
FLEX4 |
0.811 |
0.037 |
0.815 |
0.000 |
||||
Efficiency |
EFFI1 |
0.705 |
0.048 |
0.705 |
0.000 |
0.870 |
0.814 |
0.573 |
EFFI2 |
0.725 |
0.043 |
0.724 |
0.000 |
||||
EFFI3 |
0.808 |
0.026 |
0.808 |
0.000 |
||||
EFFI4 |
0.808 |
0.025 |
0.808 |
0.000 |
||||
EFFI5 |
0.733 |
0.041 |
0.734 |
0.000 |
Notes: p < 0.05, t (0.05; 4999) ¼ 1.645 *; p < 0.01; p < 0.01 (One-tailed test).
The attention of Partial Least Squares (PLS) in modern research has gained increased attention socially the domains of management (e.g., Peng and Lai, 2012; Perols et al., 2013., Nell and Ambos, 2013). We applied the partial least squares (PLS) approach to structural equation modelling for the analysis of the relationships between operational disruptions, productivity, flexibility, and efficiency. While using SmartPLS 2.0 we used an Algorithm, bootstrapping and blindfolding procedures with the by default sample size (500 samples). The methods used are to analyze the estimated path coefficients (Chin, 2001), the significance of the parameter estimates and to determine the estimated standard errors (Chin, 1998; Nevitt and Hancock, 1998). Before testing estimated parameters of a reflective measurement model, there is a requirement of presumptions which are the Presupposition for the assessment of Structural Equation Modelling (Wong, 2013). Measurement model loadings and significance and Indicator reliability; Internal consistency, reliability; Convergent validity; and Discriminant validity;
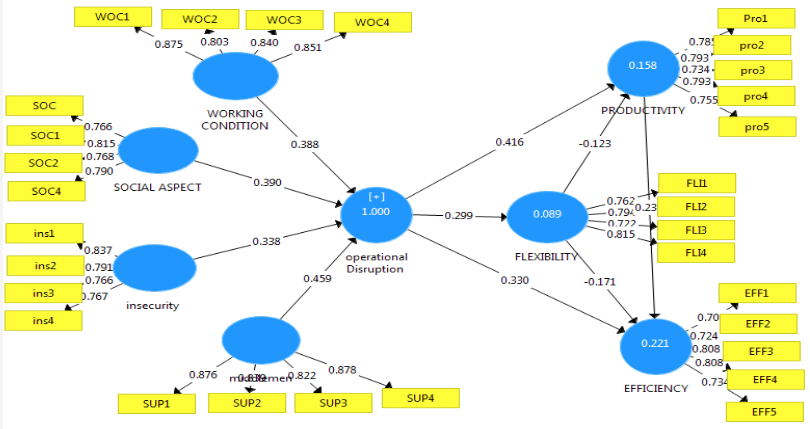
The substantive model and estimated modelling parameters produced by SmartPLS are displayed in Fig.2 and the results are posted in the table 3. To assess the quality of the proposed measurement model we will start with the measurement/ Item loading, it shows the reliability of the items associated in particular construct and to ensure the quality, the respective loading should exceed the suggested threshold value of 0.7. The value extracted in the table surpasses the threshold value, at the level 0.05 therefore high levels of internal consistency have been demonstrated among all reflective of 1st order constructs (Carmines and Zeller, 1979; Peng and Lai, 2012). Further factor loadings extracted realize that the factor reliability criterion and fulfils the conditions for formulating second-order constructs from the first-order construct (e.g., Doll et al., 1994).
In the next step convergent validity is examined, it is the extent to which the observable variables actually measure a conceptualized construct. To examine the convergent validity of measurement constructs we, used Cronbach’s alpha (CA) and composite reliability (CR). The results extracted for the constructs in Table 2, meet the proposed threshold of 0.7 which are appropriate and considerably adequate to demonstrate internal consistency (Churchill, 1979, González, 2005). Following the next, we examined convergent validity; The Average Variance Extracted (AVE) is used to evaluate the convergent validity, which is obtained when each measurement item correlates strongly with its assumed theoretical construct. Average Variance Extracted (AVE) is greater than 0.5 i.e. the items that are the indicators of a construct share a high proportion of variance in common or converge (Bagozzi, 1988, Foltz, 2008., Fornell and Larcker, 1981).
Discriminant validity assumed that each construct is distinct in terms of statistical correlation degree (Hair et al., 2016). To examine Discriminant validity Fornell and Larcker (1981) proposed the uses of the square root of AVE in which comparisons of the square roots of the AVE with inter construct correlations are seen. The values shown in the diagonal of the table are the square roots of AVE with its square root being greater than the correlation (Chin, 1998; Fornell and Larcker, 1981).
Table 4
Discriminant validity with the help of “Fornell-Larcker” criterion
|
EFFI |
FLEX |
PRO |
Insecurity |
SOC |
SUP |
WOC |
Efficiency |
0.757 |
|
|
|
|
|
|
Flexibility |
-0.072 |
0.774 |
|
|
|
|
|
Productivity |
0.364 |
0.001 |
0.773 |
|
|
|
|
INSCURITY |
0.246 |
0.093 |
0.316 |
0.791 |
|
|
|
Social Aspect |
0.344 |
0.121 |
0.284 |
0.319 |
0.785 |
|
|
Middlemen |
0.133 |
0.359 |
0.186 |
0.156 |
0.212 |
0.854 |
|
Operational Cond. |
0.233 |
0.143 |
0.193 |
0.084 |
0.175 |
0.249 |
0.843 |
-----
Fig. 2
Results of structural equation modelling analyses
Once the basic requisites are full filled (Wong, 2013, Hair, 2016) advocates for the further explanation of the proposed model through
▪ Explanation of target endogenous variable variance;
▪ Structural model path coefficient sizes and significance
Table 5
Results of structural equation modelling
Independent à Dependent variable
|
Path coefficient |
P value |
t-value |
f 2 |
R2 |
Q2 |
Decision |
Operational disruptions à efficiency |
-0.330 |
0.000 |
4.767 |
0.107 |
0.221 |
0.196 |
Accept |
Operational disruptions àFlexibility |
-0.299 |
0.000 |
5.0.97 |
0.098 |
Accept |
||
Operational disruptionsàProductivity |
-0.416 |
0.000 |
7.693 |
0.187 |
Accept |
||
Flexibility à Productivity |
-0.123 |
0.016 |
2.422 |
0.016 |
0.089 |
|
Accept |
Flexibilityà Efficiency |
-0.171 |
0.008 |
2.683 |
0.034 |
|
|
Accept |
Productivityà Efficiency |
0.239 |
0.001 |
3.216 |
0.062 |
0.158 |
Accept |
The coefficient of determination (R2) is common to indicate the percentage of variance in the dependent variable that can be predicted from the independent variable (s) (Ringle et al., 2014). The coefficient of determination (R2) is equal to 0.221 (22.1%) for efficiency, 0.089 (8.9%) for flexibility and .158 (15.8%) for productivity endogenous latent variables (i.e., variable total consumption). For the importance of the effect, statisticians suggest 0.75, 0.50 and 0.25 are considered substantial, moderate and weak respectively. The small percentages give an underestimated impression of the strength. However, for the area of social sciences and behavioural, R2= 2% is classified as a small effect, R2= 13% as the average effect and R2= 26% as a great effect (Cohen, 1988), (Ringle, et al., 2014). As noted in Table 2, all R2 values of the endogenous latent variable are above average, for efficiency, it is excellent 22%, productivity (15.9%) Good and for the flexibility variable (8.9) average this is a good indication for the model. Further t-value was evaluated; the values extracted met the condition that is t-value must be equal to or greater than 1.96 at 0.05 level of significance (Hair. et al., 2014). Finally, we analysed Q2 (predictive validity or Stone-Geisser indicator) using blindfolding method of calculation. The values above 0 have some significant predictive relevance and the values extracted in analysis for the endogenous variables are greater than zero that means they predict validity of the proposed model (Hair et al., 2014). The goodness of fit (GoF) is not calculated in the above table as (Henseler and Sarstedt, 2013) state that there is nothing like universal accepted model fit in SmartPLS. The tool does not have the power to distinguish valid and non-valid models; it has been reported as inefficient in its statistical power to differentiate the quality of a structural model (Hair et al., 2014; Henseler & Sarstedt, 2013)
The results of the structural model in SmartPLS with 500 iterations can be found in the Fig. 2 and Table 4. The structural model suggests that operational disruptions have the strongest direct effect on productivity (0.416), followed by efficiency (0.330), flexibility (0.299) and productivity to efficiency (0.239). Further flexibility has a strongest negative effect on efficiency (-0.171) fallowed by Productivity (-0.123). Therefore, we conclude that operational disruptions, productivity and flexibility are strong predictors of performance efficiency.
Fig. 3
Results of structural equation modelling analyses
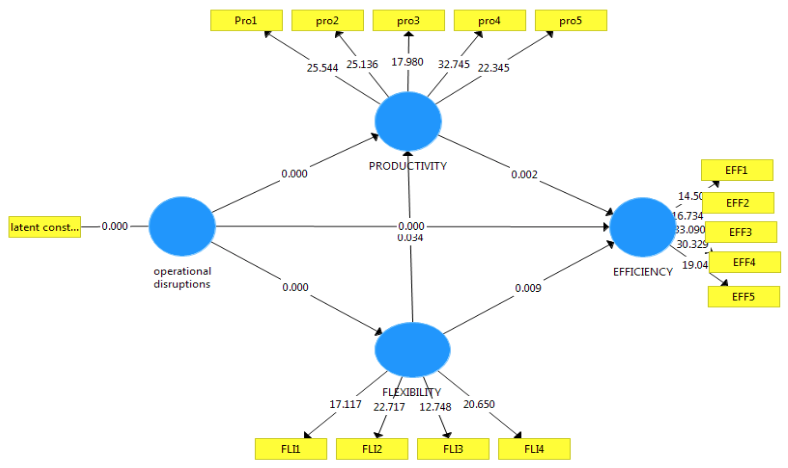
Following we tested whether implementing a direct path (full model) in addition to the indirect paths (a nested model) would significantly improve the explained variance of the dependent variable.
Small-scale industries especially handicraft sectors are not like others sectors where the inundated indicators to measure performances are available, different researchers and stakeholders use different methods to measure performance, no such a universal standard gauge is being established to measure the performance of the handicraft sector. Further, the interest paid by researchers towards the sector is not much, because of its informal and unorganised business nature. This has caused serious concern to the sector and to the stakeholders, who face the challenges of identifying, and then prioritizing those measures which are the most appropriate for their strategies. However, productivity, flexibility and efficiency are much-used modules to measure the nonfinancial performance of small-scale industries. We try to elaborate the causations of operational disruptions on the performance of the handicraft sector. To address and analyse different disruption causations and to ensure the impact of each of these disruptions on the performance efficiency, a comprehensive evaluation model for efficiency performance has been carried out by considering the interdependence and interrelation in the study.
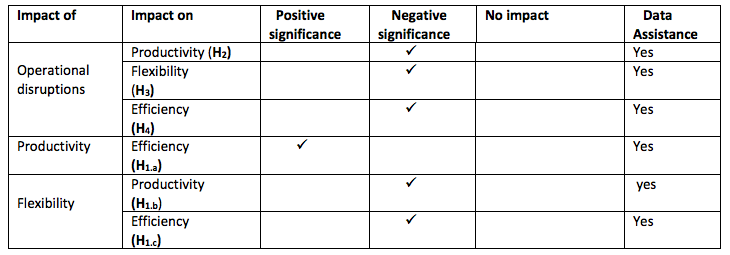
In order to achieve growth, handicraft sector needs to concentrate on its basic activities of productivity. Productivity is a set of internal activities which leads to the enhancement of efficiency. Though both are performance indicators and relevant to each other we tried to find out the relation between the two. It is found, productivity strongly affects the efficiency of the handicraft sector. Here we can infer that there is a positive and significant relation between productivity and efficiency. (β = 0.239, t-value = 3.133, p< 0.05). Hence the proposition (H1) productivity has positive and significant relation with the efficiency of the handicraft sector is accepted.
Though flexibility itself is a performance indicator and to improve performance, big organisations advocate for flexibility in work culture but small-scale industries especially handicraft sector already face the problems of productivity and cannot bear further heights of flexibility. The work, timing, place and diversity of employees in handicraft sector are highly flexible but the performance of the sector is flagging and is not matching the expectations. So in the model relation between flexibility is analysed with two of the performance indicators that are efficiency and productivity. It is analysed that flexibility has negative impact on productivity. That means high flexibility leads to decrease in productivity (β = -0.123, t-value = 2.422, p< 0.05) and flexibility has negative effect on efficiency (β = -0.171, t-value = 2.756, p< 0.05). Hence Hypothesis1.c states that there is a negative relation between flexibility and productivity and Hypothesis1.b states that there is a negative relation between flexibility and efficiency. Hence both the hypothesis H.1.b and H1.c are accepted.
Operational disruptions are expected consequence of informal/unorganised activities. Handicraft sector in particular is exposed to enormous disruptions these disruptions triggers incongruity and negative consequences for the firms, includes high costs, quality failure, delay in delivery and reduced customer service levels which has caused large operational losses, reputational damage and performance discredit to the sector (Hendricks & Singhal, 2005; Wagner & Bode, 2008). In the analysis we have focused on operational disruptions and conjecture that reducing disruption may improve operational efficiency through proper and strategic management of operational disruptions. In line with proposition
To analyze, productivity can be increased by reducing disruptions and the increased disruptions are the strong causes of diminish productivity. The data states that operational disruption has negative and significant relation with productivity of handicraft (β = -0.416, t-value = 7.955, p< 0.05). More specifically, operational disruptions in handicraft strongly affected the productivity and are negatively related to each other that in increase in disruptions leads to decrease in productivity and vice versa. Hence the proposed hypothesis (H2) disruptions have a negative impact on productivity is accepted.
Yet, in line with our predictions, the analysis confirmed that efficiency performance indicator is also affected by operational disruptions. It is stated in the analysis that efficiency of the sector has negative relation with operational disruptions (β = -0.330, t-value = 4.589, p< 0.05). While simplifying it we can infer that operational disruptions in operational activities affect the efficiency and are negatively related to each other that is an increase in disruptions leads to decrease in efficiency and vice versa. Hence the proposition (H3) efficiency can be increased by reducing disruptions or operational disruptions are negatively significant to performance efficiency of the handicraft is accepted.
The flexibility of the sector measured in the analysis states that operational disruptions have linear but negative relation with the flexibility. It is important to state here that the relation of operational disruptions is negative with flexibility of the sector that means disruptions in operational activities reduces flexibility in the sector there is a (β = -0.299, t-value = 4.953, p< 0.05). Hence the proposition (H4) operational disruptions have negative and significant relation high flexibility of the handicraft sector is accepted.
Table 6
Conclusion of the results drawn
This paper contributes to enriching knowledge of the disruptions in operational activities, which can be subsequently used to support decision making in analysing the performance of the handicraft sector. The main result found in our work was that performance efficiency seriously and considerably depend on factors taken into consideration in the study, altogether we can say performance efficiency of handicraft sector depend on the links of supply chain and any disruption in the supply chain especially in operational activities of the firm whether big or small the firm has to face serious performance problems.
There are several limitations of this study. First, the study was conducted mainly based on limited variables and the research was conducted with reference to handicraft sector only. Second, the financial performance of the sector is not taken into consideration as an indicator, though the indicators are much more important than the non-financial indicators, a higher number of indicators could have been incorporated into the survey with different points of view. Third, more people could be included, both in the survey phase and for the expert group phase.
Abbate, D., Gourier, E., & Farkas, W. (2008). Operational risk quantification using extreme value theory and copulas: From theory to practice. Journal of Operational Risk, 4(3), 1–24.
Anderson, P., & Anderson, E. (2002). The new e-commerce intermediaries. MIT Sloan Management Review, 43, 53–62.
Armstrong, J, S. (1968). Long range forecasting for international markets: The use of causal models, in Robert L. King (Ed.), Marketing and the New Science of Planning, American Marketing Association. Chicago.
Arya , A., Löffler, C., Mittendorf, B ., Pfeiffer, T., (2015), The middleman as a panacea for supply chain coordination problems, European Journal of Operational Research ,393–400.
Aziz, A. (1990). Rural Artisans; Development Strategies and Employment Generation. Institute of Social and Economic Change, India: Bangalore.
Bagozzi, R.P., Yi, Y. (1988). On the evaluation of structural equation models. J. Acad. Mark. Sci. 16 (1), 74–94.
BCBS (2006). International convergence of capital measurement and capital standards: A revised framework. Basel Committee on Banking Supervision. Available at http://www.bis.org/publ/bcbs128.pdf.
Belavina, E., & Girotra, K. (2012). The relational advantages of intermediation. Management Science, 58, 1614–1631.
Bergamasco, M. (2008). (Ed.), Beyond movement, The history and future of gesture analysis, Alinea Editors, Firenze.
Bhat, B, A. (2006). Impact of Turmoil on Tourist Industry of Jammu and Kashmir, International Journal of Marketing, Financial services and Management Research 1: 124-126.
Bikse, V. & Rivza, B., (2014). Labour market challenges for entrepreneurship education: problems and solutions. In: Latvijas ekonomikas un uzņēmējdarbības izaicinājumi. Ventspils augstskola.
Bohringer, C, & Jochem, P, E. (2007). Measuring the immeasurable—a survey of sustainability indices. Ecol Econ; 63(1):1–8.
Carmines, E.G., Zeller, R.A., 1979. Reliability and Validity Assessment. Sage Publications,
Beverly Hills, CA.
Carrozzino, M., Scucces, A., Leonardi, R., Evangelista, C., and Bergamasco M., (2011). Virtually preserving the intangible heritage of artistic handicraft, Retrieved from, http://www.sciencedirect.com/science/article/pii/S1296207410001032.
Chamikutty, P. (2013). Problems facing the Indian artefacts sector retrieved from https://yourstory.com/2013/06/crafting-a-livelihood-a-snapshot-of-the-indian- artifacts-sector-2/.
Chandra, P. & Jain, M., (2007). The Logistics Sector in India: Overview and Challenges. IIM-A-380 015 India, W.P.No.2007-03-07.
Chatur, A, A. (2005). Driving Costs out of the Supply Chain: Inbound Logistics. Infosys Technologies Limited.
Chelliah, R.J., and Sudarshan, R., (1999) “Income Poverty and Beyond: Human Development in India, Social Science Press, India: New Delhi.
Chin, W.W., 1998. The partial least squares approach to structural equation modeling. In: Marcoulides, G.A. (Ed.), Modern Methods for Business Research. Lawrence Erlbaum Associates Inc., Mahwah, NJ, pp. 295–336. Chin, W.W., 2001. PLS-graph user’s guide. In: C.T. Bauer College of Business. University of Houston, USA.
Churchill, G, A. (1979). A paradigm for developing better measures of marketing constructs, J. Market. Res. 16 (2), pp. 64–7.
Cohen, J. (1988). Statistical power and analysis for the behavioral sciences (2nd ed.). Hillsdale, NJ: Lawrence Erlbaum Associates.
Dangayach, G,S. & Deshmukh, S,G. (2007). Manufacturing flexibility: a multi sector study of Indian companies. Int. J. of Manufacturing Research, Vol. 2, No.2 pp.225-242.
Davenport, T. H., & Prusak, L. (1998). Working knowledge. Boston: Harvard Business School Press.
Desai, Vasant (1997): Institutional Frame Works for Industry, Himalaya Publishing House, Mumbai.
Dhamija, J, (1975). Handicrafts: a source of employment for women in developing rural Economies, International Labour Review.23(20).
Din, M. & Mir, B. (2012) Indian Handicrafts and its legal protection. IOSR Journal of Humanities and Social Science (IOSR-JHSS) Volume 21, Issue 3, Ver. II PP 38-46 e- ISSN: 2279-0837, p-ISSN: 2279-0845. www.iosrjournals.org.
Doll,W.J.,Xia,W., Torkzadeh, G., 1994. A confirmatory factor analysis ofthe end-user computing satisfaction instrument. MIS Q. 18 (4), 453–461.
Dreze, J., and Sen, A.K., (1991) “Public Action for Social Security Foundation and Strategy. Oxford University press, India: New Delhi .
Driese, W. F. (2000). Wie begleiten Banken die Expansion in der Logistik? (How Do Banks Support the Growth in Logistics), in: Handclsblatt Beilage Logistik, 18. 10.
Durvasula, R., (1992) Occupational Health Information Systems in India in M. R. Reich and Okubo, T. (eds.) Protecting Workers Health in the Third World , Auburn House, New York.
Ernst & Young. (2012). Competitive study on Handicrafts Sector in China. Retrieved from Website of Exports Council of India.
Fisher, M, L. (1997). What is the right supply chain for your product. Harvard Business Review. 75, 105–117.
Fornell, C., & Larcker, D. F. (1981). Structural equation models with unobservable variables and measurement error: Algebra and statistics. Journal of Marketing Research, 382–388.
Forsman, H. (2011). Innovation capacity and innovation development in small enterprises. A comparison between the manufacturing and service sectors. Res. Policy 40 (5), 739–750.
Gaur, S. (2014). The development of desert tourism and its influences on small scale industries and handicrafts: A case study of western Rajasthan. (Doctoral Dissertation) New Delhi, India: Jawaharlal Nehru University.
Ghouse, S. M. (2010). Indian Handicraft Industry: Problems and Strategies. International Journal of Management Research and Review (ISSN 2249-7196), 2 (7),4-7.
Giovannucci, A, Rodríguez-Aguilar., J, A, Reyes., A, Noria, F, X., Cerquides, J. (2008 Enacting agent based services for automated procurement. Eng. Appl. of AI; 21(2): 183-199.
Goldman, S, L., Nagel, R, N., & Preiss, K. (1995). Agile competitors and virtual organizations: Strategies for enriching the customer. New York: Van Nostrand Rein- hold.
González, B, J. (2005). A study of the effect of manufacturing proactively on business performance. International Journal of Operations & Production Management 25 (3), 222e241.
Greenwald, B.C., Stiglitz, J.E., 1993. Financial market imperfections and business cycles, Q. J. Econ, 108 (1), 77–114.
Hair, J. F., Hult, T. M., Ringle, C. M., & Sarstedt, M. (2014). A primer on partial least squares structural equation modeling (PLS-SEM). Los Angeles: SAGE.
Henseler, J., Ringle, C. M., & Sinkovics, R. R. (2009). The use of partial least squares path modeling in international marketing. Advances in International Marketing, 20 (1), 277–319.
Henseler, J., & Sarstedt, M. (2013). Goodness-of-fit indices for partial least squares path modeling. Computational Statistics, 28(2), 565–580.
Ho, Y, M. and Huddle D. (1976) Traditional and small scale cultural goods in international
trade and employment, Journal of development Studies.
Jarillo, C.J., (1989). Entrepreneurship and growth: the strategic use of external resources.
Journal of Business Venturing, 4 (2), 133–147.
Jawanda, V, S. (2016). Instead of higher potentialities, the sector is suffering from the acute decline in export business. Retrieved from https://retail.franchiseindia.com/article/sector -watch/fashion/5-factors-depleting-the-Indian-handicraftindustry.a5382/.
Keohane, D., Crabtree, J., 2016. Modi to Refresh Make in India Manufacturing Drive. Financial Times (FT). Retrieved from 〈https://www.ft.com/content/939d0b3a-d2e3-11e5-969e.
Khan, W, A. & Amir, Z. (2012). Study of Handicraft Marketing Strategies of Artisan in Uttar Pradesh and Its Implications, Research Journal of Management Sciences, ISSN 2319–1171 Vol. 2(2), 23-26.
Korhonen, S. Niemelä, J. (2005). A conceptual analysis of capabilities: Identifying and classifying sources of competitive advantage. University of Helsinki.
Lee, J. S., Lee, C. K., & Choi, Y. (2011). Examining the role of emotional and functional values in festival evaluation. Journal of Travel Research, 50 (6), 685e696.
Madan, C.R. (1983). India’s Developing Villages, Print House (India), Lucknow, p.no.289.
Mari s M (1980). Housewives Produce for the World Market: the Lace Makers of Harsapart ILO World Employment Programme Research.. 1980.
Nevitt, J., Hancock, G.R., 1998. Relative Performance of Rescaling and Resampling Approaches to Model Chi-square and Parameter Standard Error Estimation in Structural Equation Modeling. In: Paper Presented at the Annual Meeting of the American Educational Research Association, San Diego, CA.
Onukwuli, A, G., Akam, U, G, Onwuka E, U., (2013). Challenges of Small Scale Industries in Sustainable Development in Nigeria. IOSR Journal of Business and Management (IOSR-JBM) e-ISSN: 2278-487X, p-ISSN: 2319-7668. Volume 16, Issue. 5. Ver. I. www.iosrjournals.org.
Osto, G. D. (2009). Artigianato Artistico, Genius Loci. in NYCVE, Italian American Magazine, published–April/May, http://us.nycve.it.
Peng, D.X., Lai, F. (2012). Using partial least squares in operations management research: a practical guideline and summary of past research. J. Oper. Manage. 30, 467–480.
Perols, J., Zimmermann, C., Kortmann, S., 2013. On the relationship between supplier integration and time-to-market. J. Oper. Manage. 31 (3), 153–167.
Planning Board India, [PCI], [GOI] (2002) Planning Problems and Prospects of Weavers’ Co-operatives, Indian Co-operative Review, Bombay, Vol.IX V, No.3.
Poveda-Bautista, R., García-Mel_on, M., & Baptista, D. C. (2013). Competitiveness measurement system in the advertising sector. Springer Plus, 2(1), 438e451.
Pizam, A. (1990). Evaluating the effectiveness of travel trade shows and other tourism sales promotion techniques. Journal of Travel Research, 29(1), 3–8.
Ringle, C. M., Silva, D., & Bido, D. D. S. (2014). Modelagem de equac¸õesestruturais com utilizacão do SmartPLS. REMark, 13(2), 54.
Sadeh N, Hildum D, Kjenstad D. Agent-based e-supply chain decision support. Journal of Organizational Computing and Electronic Commerce 2003; 13(3-4), 225–241.
Sandesara, J. C. (1993) Small industry production: a quick comment. Economic and Political Weekly.
Sarvamangala, R. (2012) Challenges and Opportunities for Rural cottage, and Handicraft industries in India Paripex. Indian Journal of Research.
Seungsup, L., Choi, K., Lee, S. (2013). A personalized trustworthy seller recommendation in an open market. Expert Syst. 40 (4): 1352-1357.
Shah A, & Patel R., (2017) Problems and Challenges Faced By Handicraft Artisans, Voice of Research Volume 6, Issue 1 June 2017 ISSN 2277-7733.
Tang, C.S., Tomlin, B. ( 2008). The power of flexibility for mitigating supply chain risks. Int. J. Prod. Econ. 116 (1), 12–27.
Thomas, O., Hermes, B., Loos, P. (2008). Reference model-based event management. International Journal of Event Management Research. 1, Volume 4.
Thomas, D, R, E. (1978). Strategy is different in service businesses. Harv. Bus. Rev. 56 (4), 158–165.
Thompson, B. (1995). Stepwise regression and stepwise discriminate analysis need not apply here: A guidelines editorial. Educational and Psychological Measurement, 55, 525–534.
Vaijayanti, R. (2010).Problems faced by the small scale sector– An analysis. Abhinav National Monthly Referred Journal of Research in Commerce & Management, 2 (1), 97.
Watson, J. (2007). Modelling the relationship between networking and firm performance, Journal of Business Venturing, 22 (2007) 852–874.
Yeung, A.C.L., (2008). Strategic supply management, quality initiatives, and organizational Performance, Journal of Operational Management, 26 (4), 490–502.
Zhou, K.Z. and Wu, F. (2010) Technological Capability, Strategic Flexibility, and Product Innovation, Strategic Management Journal, 31, 547-561.
1. Research scholar. Department of Humanities and Social Sciences. Maulana Azad National institute of Technology Bhopal, Madhya Pradesh. Email: bhatjana@gmail.com. Correspondent author
2. Assistant Professor. Department of Humanities and Social Sciences. Maulana Azad National institute of Technology Bhopal, Madhya Pradesh. Email: pushpender1@gmail.com