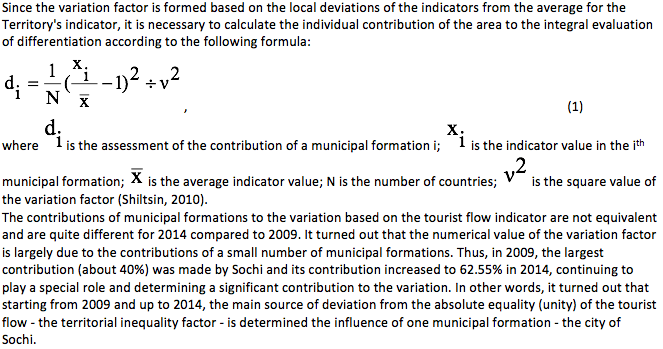
![]() ISSN 0798 1015
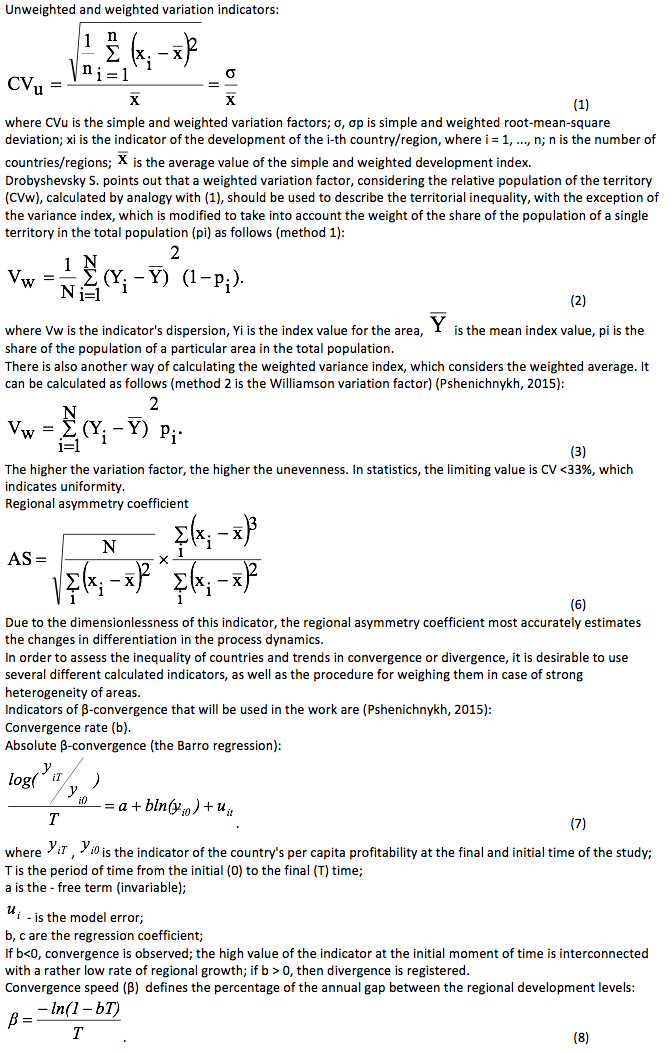
ISSN 0798 1015

![]() ISSN 0798 1015
ISSN 0798 1015
 Vol. 39 (Nº36) Year 2018. Page 27
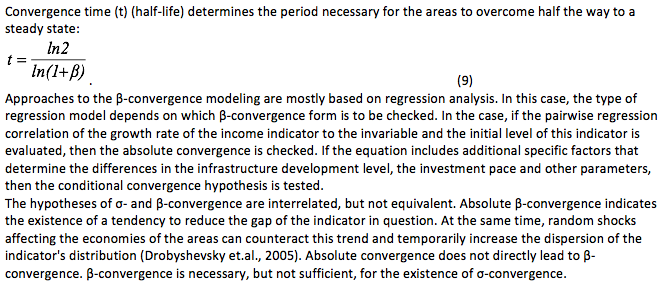
Yulia PSHENICHNYKH 1; Marianna YAKIMENKO 2; Elena ZHERTOVSKAJA 3; Svetlana GRINENKO 4
Received: 18/05/2018 • Approved: 23/06/2018
ABSTRACT: The obtained results confirmed σ–divergence concept in the municipal formations in the Krasnodar Territory. Their inequality in the tourist flow volume and “income” per 1 tourist increases. The differentiation in the Russian South clearly demonstrates the run-off between the main areas and separation of leaders (Sochi, Gelendzhik, Anapa, and Tuapse districts), which are the “tranquility disturbers”. The results of the analysis of the β-convergence indicators did not allow obtaining statistically significant estimates of the presence of the β-convergence concept. |
RESUMEN: Los resultados obtenidos confirmaron el concepto de divergencia σ en las formaciones municipales en el Territorio de Krasnodar. Su desigualdad en el volumen de flujo de turistas e "ingresos" por 1 turista aumenta. La diferenciación en el sur de Rusia demuestra claramente la segunda vuelta entre las áreas principales y la separación de los líderes (distritos de Sochi, Gelendzhik, Anapa y Tuapse), que son los "perturbadores de la tranquilidad". Los resultados del análisis de los indicadores de convergencia β no permitieron obtener estimaciones estadísticamente significativas de la presencia del concepto de convergencia β. |

Tourism generates a significant share of GDP and provides a significant part of employment. Indicators of employment in tourism is a very important indicator for the economy, as new jobs in the tourism industry stimulate the development of tourism-related industries - construction, infrastructure and the entire service sector. In addition, foreign exchange earnings from tourism constitute the main contribution to financing the foreign trade deficit. Tourism provides a redistribution of income from rich countries to the poor, from developed to less developed countries. This contributes to regional development and reduces economic differences between areas (Dudetsky, 2014a, 2014b).
The South of Russia has the richest recreational potential and unique natural curative resources, annually attracting a large number of tourists. The Black Sea coast from year to year is a favorite vacation spot not only for Russians, but also for guests from near and far abroad (Maksimov, 2016). The number of tourists in the organized sector of resorts in the Krasnodar Territory in 2015 increased by 1.4 million people, reaching 4.8 million people, the growth rate of the tourist flow in 2014 for 1 year exceeded the growth rate of the tourist flow over the previous 10-year period from 2003 to 2013 (127.8% against 126.3%). The number of tourists in the informal sector also increased, albeit less significantly, by 11.7% (9.3 million in 2015). The dynamics of revenues from the sale of services of the tourist and recreational system in comparison with the dynamics of tax revenues from the activities of the tourist and recreational system is characterized by steady growth. So, since the beginning of the 2000s, the revenue from the sale of the services of the tourist and recreational system has increased almost 6 times (5.8 times), and tax revenues - only 5 times. In 2015, the volume of the tourist and recreational complex amounted to 91.8 billion rubles, tax revenues - 5.8 billion rubles.
The area of the Krasnodar Territory is extremely diverse in terms of natural conditions and includes 4 recreational zones: The Black Sea zone (Sochi, Tuapse, Anapa districts, Gelendzhik, Novorossiysk); Priazov zone (Shcherbinovsky, Yeisk, Primorsko-Akhtarsky, Slavic, Temryuk districts); Mountain-submontane zone (Goryachy Klyuch, Apsheronsky, Mostovsky, Otradnensky, Labinsky, Seversky, Abinsky, Krymsky districts); Steppe zone (other flat areas of the region).
According to the level of tourism development, the first three zones are allocated: Black Sea, Priazovskaya, and Mountain-submontane. The study of seasonal fluctuations of the tourist flow shows that the number of tourists is more evenly distributed in the municipalities of the mountain foothill zone (in the “low” season of tourist flow it decreases only 2.6 times compared with the “peak” of the season, while in the coastal municipalities - an average of 10 times (Maksimov, 2016).
In virtue by that, one of the ways to improve the competitiveness of recreational areas and ensure their sustainable development is the improvement of management mechanisms aimed at overcoming the excessive gap between areas, activating growth points in less developed areas (Dudetskiy, 2014c; Vasiljeva and Dudetskiy, 2014).
In connection with this, the subject of this article is the parameters of the unevenness and asymmetry of the economic space of the tourist and recreational zones of the Krasnodar Territory. The theoretical basis for analyzing and assessing the unevenness of territorial development is the convergence theory that emerged at the end of the twentieth century, the purpose of which is to study the diverse processes of co-integration development of the countries of the world in the conditions of building a new global economy of a globalization type.
The patterns of regional socio-economic development have been discussed in the world literature for more than half a century. For the last few years, the unevenness of the socioeconomic development of countries (regions, territories) is characterized by increased interest of the authors in the problem of assessing and analyzing interregional differentiation and identifying disproportions in the development of socioeconomic entities. As the basic theories, the convergence models are singled out, the authors of which are R. Solow (1956); Barro (1992), Sala-i-Martin (1996); Mencyu-Romer-Whale (1992); D. Quah (1996) and others. This layer of research (interregional and intercountry differentiation) has received a special name - “convergence literature”. Meanwhile, there is no unambiguous answer about the relationship between economic growth and socio-economic differentiation of countries (regions). Both the decline and the growth of area differences are justified at the theoretical and empirical levels.
A single concept of convergence in world economic literature has not evolved. Russian and Ukrainian scientists define convergence as a tool for assessing the uneven development of regions in a single country. The following authors refer here: Granberg A.G. (2007), Lavrovsky B.L. (2009), Shiltsin E.A. (2010), Iodchin A.A. (2007), Drobyshevsky S. (2005) et.al.; such Ukrainian researchers as Kolomak E. (2013), Klebanova Т.S. (2012), Guryanova L.S.(2013), Kizim N.A. (2011), Raevneva E.V. (2012), Bobkova A.Yu. (2013) et.al.
In economic theory, convergence refers to the process of convergence in time of the levels of development of countries and regions, while the opposite process is called the divergence (Iodchin, 2007a).
There have been several convergence concepts, each of which has own analysis methodology. Iodchin A.A. in his work proposed a fairly complete classification of types of convergence (Iodchin, 2007b): global, club; regional, intercountry; in terms of growth rates, in terms of income level; absolute, conditional; deterministic stochastic; σ- and β -convergence.
Within the framework of this article the main attention is paid to such kinds of convergence, as σ- and β-convergence.
So, Barro and Sala-i-Martin consider in their research two basic concepts:
1) The concept of σ-convergence is determined if the dispersion of GDP per capita (or other indicator of income) is reduced, making it possible to fix at a particular moment in time the presence or absence of disproportions between the areas;
2) The β-convergence concept is observed in the presence of a negative relationship between the growth rate of GDP per capita and its initial value, while in poor countries or regions higher economic growth rates are recorded than in the rich countries (Barro and Sala-i-Martin, 1995).
At that, the following is allocated:
Thus, the economic literature has a number of directions for its application of the concept of “convergence”. It should also be noted that the presented types of σ- and β-convergence can equally be applicable, both for regional and cross-country convergence, i.e. allow us to study the patterns of interregional and cross-country differences. The choice of the initial research object (country or region) predetermines the determination of the initial indicator characterizing the level of development of the object under consideration.
Convergence in the context of research in the tourism industry is a fairly new area of empirical research. Convergence control is an important way to evaluate the effectiveness of existing tourism development strategies, the success of advertising strategies, and gives an advantage to planning future strategies for attracting tourists to a specific destination.
In the literature on international tourism, a very limited number of studies are presented, in which the convergence theory in the tourism industry is considered (Bahar et.al., 2013). Some of these studies focus on convergence indirectly by measuring the impact of tourism on economic growth (Katrakilidis C., Konteos G., Sariannidis N. and Manolidou Ch. (2017), Bahar and Bozkurt (2010); Balaguer and Jorda (2002); Durbarry (2004); Gökovalı and Bahar (2006), Nowak et al. (2004), Narayan (2006, 2007), Hooi and Smyth (2006), Lean and Smyth (2008), Soukiazis and Proença (2008), Lorde and Moore (2008)).
At the international level, at least with respect to Europe, according to Williams and Shaw (1991), tourism contributes to the distribution of wealth from north to south, from the richer to the poorer states, thereby facilitating the convergence process. At the regional level, tourism, naturally, tends to crowd out urban centers and stimulates growth potential in less developed regions. Thus, tourism is likely to promote regional development and reduce regional financial inequalities.
The growing global role of tourism has mobilized researchers who have tried to study its various aspects, focusing on the causal relationship between tourism (arrival or income) and economic development. Despite the importance of the tourism industry, most of the empirical research in the tourism industry was based on the functions of tourist demand.
Narayan (2006) was the first one to use the concept of convergence for the tourism industry, who argues that a tourism marketing policy aimed at a specific country of origin of tourists is effective if the tourist flow of visitors from the country of origin converges with the total number of international arrivals of visitors to the destination country. As a result, the increase in arrivals from these markets positively affects the increase in the total number of international arrivals of visitors to the host country. Consequently, strategies aimed at increasing the country's attendance from the convergent market improve the overall volume of international visitor arrivals. In particular, if the marketing campaign in a particular market that is a source of tourists is effective, then the growth rate of the tourist flow from this market in the total number of arrivals will increase. This is a criterion of policy effectiveness. If this is not the case, then either the marketing strategy needs to be adjusted or stopped altogether.
One can note the presence of only two studies conducted in Turkey, which deal with the analysis of the conjecture of convergence in the field of tourism. The first study was conducted by Samırkaş and Bahar (2011), by measuring the impact of the tourism sector on the elimination of interregional differences in the development of Turkey (Lorde and Moore, 2008). The data contains the volume of tourist flows and per capita income for the period from 1990 to 2000 in 39 cities and two main regions in Turkey. They use the method of least squares, the method of estimating conditional and unconditional -convergence and variation analysis for estimating the -convergence. The results show that there is an increase in income differences in interregional and inter-city levels over the period from 1990 to 2000. During this period, the accumulation of tourism activities in individual regions leads to a much greater increase in interregional differences in income. Consequently, they do not find any rapprochement in Turkey. Another work developed by Abbot, Vita, and Altınay (2011), convergence was tested for arriving tourists to Turkey from 20 countries, monthly from January 1996 to December 2009, and the results do not support any convergence (Samırkaş and Bahar, 2011).
Proceeding from the foregoing, it can be noted that there is great interest in studying the convergence in the tourism industry; there is a significant number of works on the convergence hypothesis in the tourism industry, which in most cases confirm the presence of these processes in the tourism sector. The question concerning the convergence of tourist markets, their influence on the elimination of interregional differences remains relatively unexplored.
Currently, several convergence concepts are singled out for different countries, regions or areas of one country, which implies several methodologies for convergence analysis. First, the easiest way to analyze the presence of convergence in the economic development pace is possible from the viewpoint of reducing inequality in the considered indicator level (i.e., the σ-convergence concept is considered). Secondly, regression analysis (cross-section) is used to test the concept of β-convergence, in which the dependence of the accumulated increment of the indicator on its initial value is estimated over a certain period of time (Drobyshevsky et.al., 2005).
Studies of the differentiation dynamics of development levels of areas (σ-convergence) are in the framework of traditional methods of mathematical statistics, using such characteristics as variance, standard deviation, coefficients of variation and concentration, entropy and asymmetry.
Analyzing the work of various authors devoted to the analysis of σ-convergence, several of the most frequently encountered characteristics of spatial differentiation have been identified, each of which has its own merits and demerits. The main indicators of σ-convergence
The analysis of convergence processes in the South of Russia will be based on two indicators: the tourist flow volume and the income level of collective and individual accommodation facilities per tourist. Empirical analysis employed official statistical data for 40 municipal formations of the Krasnodar Territory for the period from 2009 to 2014. Differentiation will be evaluated using the system of σ- and β-convergences indicators presented above.
Before embarking on an empirical test of the convergence concepts in relation to the municipal formations of the Krasnodar Territory, a comparative statistical analysis of municipal formations was carried out in terms of the tourist flow volume and the income level of collective and individual accommodation facilities per tourist.
The basic statistical characteristics for each year are summarized in Tables 1-2.
Table 1
The main statistical characteristics of the rows by the tourist flow
volume for the period from 2009 to 2014 (thousand people)
Year |
Polar points in municipal formations |
Variation range |
Average value |
Median |
Dispersion |
Standard deviation |
|
Rmin |
Rmax |
||||||
2009 |
0.206 |
2501.292 |
2501.086 |
198.533 |
5.241 |
289650.729 |
538.192 |
2010 |
0.113 |
2234.578 |
2234.465 |
174.332 |
5.191 |
214823.940 |
463.491 |
2011 |
0.051 |
2225.665 |
2225.614 |
181.485 |
6.972 |
220510.826 |
469.586 |
2012 |
0.075 |
2348.023 |
2347.948 |
267.360 |
10.704 |
310107.858 |
556.873 |
2013 |
0.130 |
2123.383 |
2123.253 |
267.399 |
10.874 |
300305.431 |
548.001 |
2014 |
0.213 |
4528.665 |
4528.452 |
342.933 |
14.046 |
700299.465 |
836.839 |
-----
Table 2
The main statistical characteristics of the rows in terms of income of collective and
individual accommodation facilities per tourist for the period from 2009 to 2014 (thousand roubles.)
Year |
Polar points in municipal formations |
Variation range |
Average value |
Median |
Dispersion |
Standard deviation |
|
Rmin |
Rmax |
||||||
2009 |
0.435 |
15.276 |
14.842 |
4.230 |
2.705 |
17.122 |
4.138 |
2010 |
0.781 |
16.425 |
15.643 |
4.870 |
2.825 |
20.104 |
4.484 |
2011 |
0.763 |
17.959 |
17.196 |
4.918 |
3.267 |
20.277 |
4.503 |
2012 |
0.213 |
9.788 |
9.575 |
2.816 |
2.080 |
6.530 |
2.555 |
2013 |
0.219 |
10.346 |
10.127 |
3.216 |
2.425 |
7.627 |
2.762 |
2014 |
0.168 |
11.186 |
11.018 |
3.108 |
2.495 |
6.724 |
2.593 |
In general, the average level of tourists number has steadily increased from 198,533 people in 2009, to 342,933 thousand people in 2014 throughout the entire reviewed period. At the same time 2010-2011 were marked with a significant decrease in this indicator - to the level of 174,332 thousand people, which was due to the consequences of the crisis.
At the same time, the growth of the number is accompanied by a fall in the “profitability” per one tourist. This fact can be explained by the fact that collective accommodation facilities reduce prices for their services to increase demand. Thus, the drop in income of accommodation facilities per 1 tourist is due to the following: the decrease in the accommodation services value, the reduction in the length of stay at the resorts, as well as the unwillingness of individual accommodation facilities owners to show real income from the services rendered. It is quite likely that due to the economic crisis, low-budget tourism develops in the South of Russia.
Municipal formations of the Krasnodar Territory are characteristic of a high degree of internal asymmetry. The minimum values of polar points are in the range from 0.168 to 0.435, and the maximum values are in the range from 9.788 to 15.276. The range of variation demonstrates a high differentiation degree by extreme values. Up to 2013, the tourist flow volume index was decreasing and only 2014 allows for noting a significant increase (almost twofold) associated with the Olympic Games in Sochi. The differentiation degree by income level of collective and individual accommodation facilities per tourist also tended to decrease, albeit with slight fluctuations. Since the variation range is limited to the minimum and maximum values, it cannot characterize the differentiation degree within the interval.
It is noteworthy that since 2009, the average value growth of the tourist flow volume was accompanied by a steady growth of the median value, as well as an increase in the scope of area differences. This is evidenced by a stable excess of the mean over the median, as well as an increase in the standard deviation index throughout the studied period. It is possible to single out a number of municipal formations for which the values of the tourist flow rate and the income of collective and individual accommodation facilities per tourist significantly exceeded the average level. Here one can trace a very peculiar trend: such municipal formations as Anapa, Gelendzhik, Krasnodar, Sochi, Yeisk District, Temryuk District, and the Tuapse District are the leaders by the tourist flow volume.
Analyzing the dispersion level value, its significant growth should be noted in the period from 2009-2010 - from 6,749 to 10,379 thousand rubles (more than 1,5 times) and in the period from 2011-2013 - from 7,111 to 21,649 thousand rubles (more than 3 times). This process should be seen as an increase in inequality between the municipal formations of the Krasnodar Territory, which demonstrated an increase in the distance in the areas development. But as was noted earlier, the dispersion index does not eliminate the scale effect and therefore cannot provide for an adequate assessment of the differentiation level of the area.
The statistical characteristics of the series in terms of “income” per tourist on the contrary indicate a reduction in the scope of territorial differences, the mean, median and standard deviation decreased throughout the analyzed period.
Table 3 shows the σ-convergence indicators in tourist flow volume and the income of collective and individual accommodation facilities per tourist. The change in the heterogeneity and variation in the tourist flow volume and the level of income of collective and individual accommodation facilities per tourist is estimated using the variation factor, including weighted variation factor, considering the relative population of the area, as well as the asymmetry coefficient. The proposed set of indicators complements each other, allowing for a multifaceted analysis of the differentiation nature.
Table 3
Uneven distribution indices for tourist flow and income of collective and individual
accommodation facilities per tourist among the municipal formations of the
Krasnodar Territory
Index name |
2009 |
2010 |
2011 |
2012 |
2013 |
2014 |
Characteristics of the sample areas |
σ–convergence indices for the tourist flow volume |
|||||||
СVu (%) |
274.93 |
269.65 |
262.46 |
211.49 |
204.94 |
244.02 |
Very large fluctuations in the index |
CVw (1st method) (%) |
0.19 |
0.22 |
0.21 |
0.18 |
0.18 |
0.12 |
Absolutely uniform |
CVw (2nd method) (%) |
0.26 |
0.31 |
0.30 |
0.24 |
0.23 |
0.19 |
Absolutely uniform |
As |
3.182 |
3.289 |
3.193 |
2.469 |
2.243 |
3.719 |
|
σ-convergence indicators on the income of collective and individual accommodation facilities per tourist |
|||||||
СVu (%) |
97.82 |
92.06 |
91.56 |
90.74 |
85.87 |
83.43 |
Very large fluctuations in the index |
CVw (1st method) (%) |
24.45 |
22.58 |
22.43 |
39.64 |
36.20 |
38.66 |
Insufficiently uniform |
CVw (2nd method) (%) |
25.50 |
22.73 |
24.56 |
39.48 |
37.01 |
34.97 |
Insufficiently uniform |
As |
1.442 |
1.314 |
1.616 |
1.516 |
1.308 |
1.469 |
|
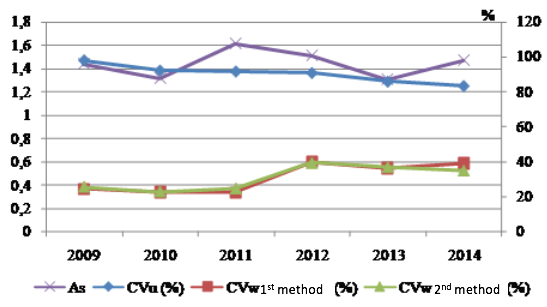
Based on the size of the σ-convergence indicators, it can be concluded that there are significant differences in the tourist flow and income per tourist levels by cities and districts of the Krasnodar Territory (Figure 1-2). The unweighted variation factor in the tourist flow volume averaged to 244.5% over the reviewed period, and averaged to 90.25% in terms of “income” per tourist, at a normal level of no more than 33%, which characterizes the high differentiation level. There is also a significant right-sided asymmetry that characterizes the displacement of the most areas into a low-level tourist flow, and so differentiation is characteristic between the majority of areas with a low tourist flow and a minority with a high tourist flow. It can be noted that the slope of the distribution is significant (the value of the asymmetry coefficient exceeds 1).
Figure 1
Indicators of σ-convergence in the tourist flow volume among the municipal formations of the Krasnodar Territory
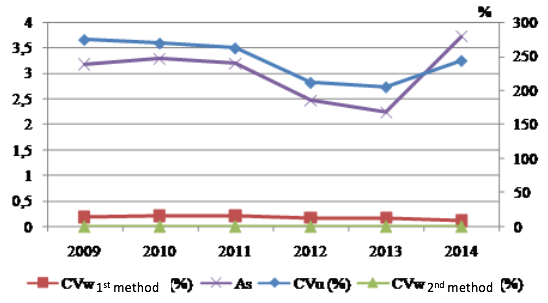
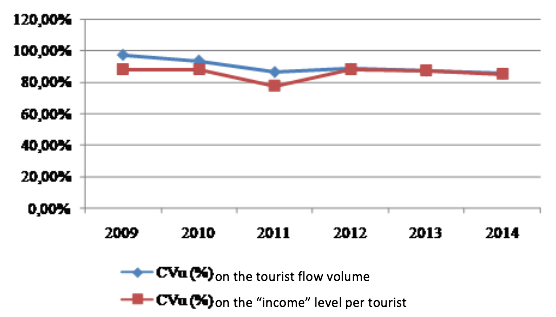
Figure 2
σ-convergence indicators on the income of collective and individual accommodation
facilities per tourist among the municipal formations of the Krasnodar Territory
Thus, the analysis of the given values of the indicators allowed for concluding that there are two groups of municipal formations are being formed in the South of Russia - one is characterized by a high number and relatively low volume of tourist flow and “income” per tourist, the second forms a high differentiation and shows high values of the tourist flow volume and “Income” for 1 tourist.
However, this imbalance does not remain frozen, but on the contrary, in recent years, it has undergone significant changes. For example, the role of individual municipalities in the aggregate dispersion index, namely Anapa, Gelendzhik and the Tuapse district, which in 2009 determined about 40% of the total variation, decreased substantially, and in 2014 they formed only 20% of the variation dynamics. As for the other municipal formations, the changes are insignificant. The contribution of each of them to the integral differentiation index in 2009-2013, first, is relatively low, and secondly, is comparable to the others.
Thus, several municipal formation, in virtue by special objective and subjective circumstances have severely broken away from the average tourist flow index (with Anapa, Gelendzhik and Tuapse district significantly lagging behind this level, in contrast to Sochi, the leader) during the reviewed period, generating imbalances and being the “tranquility disturbers”.
In this case, it makes sense to compare the differentiation dynamics with these municipal formations and without them (Fig. 3).
Figure 3
Variation factor dynamics in the tourist flow dynamics and the “income”
level per tourist, excl. Sochi, Gelendzhik, Armavir and the Tuapse district
As it can be seen from Figure 3, the exclusion of the four municipal formations does not change the main differentiation trend, but significantly lowers its level. At the same time, it is possible to note minor areas of variation stabilizing: 1993-1997 and 2003-2008. Thus, the differentiation pattern in the tourist and recreational zone of the Krasnodar Territory visually demonstrates the effect of divergence between the main mass of areas and at the same time the separation of the four leaders from this mass: Sochi, Gelendzhik, Armavir, and the Tuapse district.
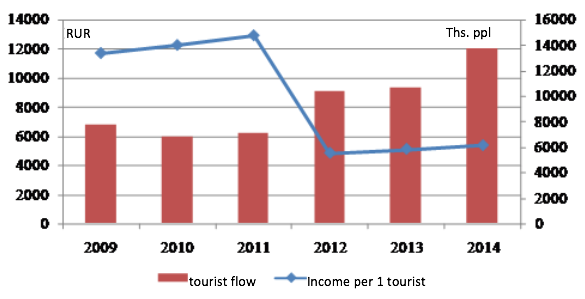
Also, a certain variations interrelation in municipal formations variations in the Krasnodar Territory is found with a general trend in the tourist sector development. Comparison of the results with the conclusions drawn based on the analysis of the characteristics of tourist flow volume indicators and “income” per tourist allows for concluding that the increase in inequality from 2009 to 2014 was observed along with the growth of the absolute value of the tourist flow and the “income” average for the entire sample. That is, the growth of tourist flows in 2009-2014 was accompanied by the trend to increase territorial stratification (Figure 5).
Figure 4
The dynamics of the change in the tourist flow and “income” per 1 tourist in the
whole aggregate of municipal formations of the Krasnodar Territory in 2009-2014.
Summarizing the obtained results, the authors may say that the σ-convergence concept has not been confirmed by data on the municipal formations of the Krasnodar Territory. It was found that the level of inequality in the areas at the South of Russia is increasing. At the same time, the analysis of various inequality indicators allowed for obtaining similar results. Comparison of the obtained results with the conclusions drawn based on the analysis of the characteristics of the tourist flow volume indicators allowed for concluding that the growth of inequality was observed along with the increase in the absolute level of the tourist flow on average throughout the sample and the decrease in the “income” per 1 tourist.
In the conditions of extremely high differentiation, it is necessary to determine the distribution structure of the tourist flow values, the nature of the unevenness and its dynamics. Analysis of the structure and distribution dynamics by the method of D. Quah (1996a) allows for not only characterizing the changes in the distribution structure, but also to assess the structural characteristics of intra-areas distribution of productivity values in the future. The boundaries of the tourist flow values relatively to the average level of municipal formations of the Krasnodar Territory are 1/4, 1/2, 1 and 2. Thus, the whole group of 40 municipal formations, in each considered year, is divided into five parts by the tourist flow value, respectively. The first interval includes the areas whose tourist numbers are below ¼ of the average value, the second interval is for the areas with a level of ¼ to ½, the third interval starts from ½ to 1, the fourth interval starts from 1 to 2, the fifth is the remaining group countries.
Figure 5 shows the histograms of the tourist flow distribution relative to the average one, observed in 2009 and 2014.
Figure 5
The distribution of per capita tourist flow in
2009 and 2014 relative to the average value
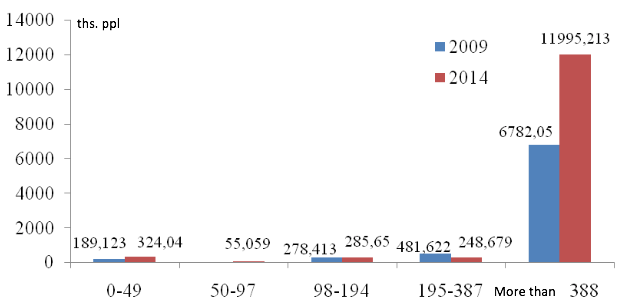
The results of the analysis of the distribution structure dynamics allowed for assuming about the dominant tendency to divergence, and also for refining the convergence area, which is about 90% of the total distribution and which is located within the fifth group of a more than twofold value of the mean value, and where the highest values and the rightmost asymmetry of the distribution increase. At the same time, the main “mass” of countries is shifted to the left - to the area with lower indicator values.
Within the framework of the β-convergence concept, the so-called representative area is determined based on the average for municipal formations, and the process of reducing differentiation is measured by the approximation rate of the average value (representative municipal formation) to the equilibrium state.
The empirical analysis of the territorial development processes in municipal formations of the Krasnodar Territory is carried out further based on the tools of the β-convergence model. The presence of β-convergence implies a negative statistical relationship between the growth rate of the per capita income indicator and its initial level when performing paired regression analysis of countries. In this case, the regression model specification determines what kind of β-convergence is to be checked.
Thus, if the pairwise regression dependence of the growth rate of the tourist flow index on the invariable and the initial level of this index is evaluated, then the existence of absolute convergence is verified. If additional exogenous parameters are included in the equation, then the conditional convergence hypothesis is tested.
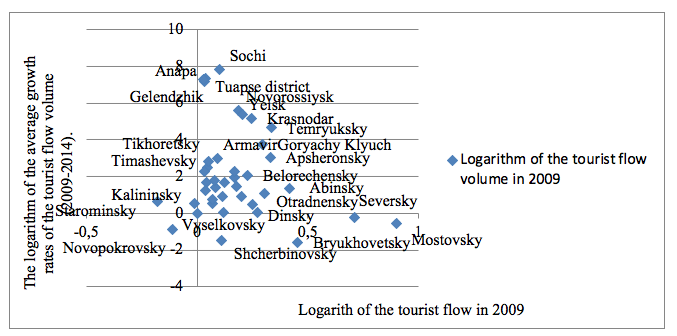
The variation diagram in Fig. 3 shows the values (logarithm) variation of the average growth rates of the tourist flow for 2009-2014 relatively to the logarithm of the initial level of the tourist flow volume in 2009. The diagram clearly shows the spikes of municipal formations with pronounced high average growth rates: Sochi, Anapa, Gelendzhik, and the Tuapse district. It is also possible to single out territories with extremely low average growth rates of the tourist flow volume: Mostovsky, Seversky, Bryukhovetsky, Shcherbinovsky, Vyselkovsky, Novopokrovsky, Starominsky and Kalininsky Districts.
Figure 6.
Variation diagram of the average growth rates logarithm of the tourist flow volume for 2009-2014
relatively to the initial level logarithm of tourist flow in 2009, 40 municipal formations
Considering the obtained results, the authors will conduct an empirical analysis of β-convergence both in the full group of 40 municipal formations and in the reduced part of the territorial space of the Krasnodar Territory. First of all, it is necessary to analyze the results of estimating the pairwise regression dependence of the growth rate of the tourist flow in 2014 relatively to 2009 (in annual terms) from the initial level of tourist flow in 2009, i.е. the presence of absolute (unconditional) β-convergence. The results of this relationship assessment are presented in Table. 4.
Table 4
Assessment of the unconditional (absolute) β-convergence model for the
tourist flow volume t of municipal formations of the Krasnodar Territory
Parameters and statistics |
2009-2014 |
For all municipal formations Coefficient β Invariable F-statistics P-value t-statistics Determination coefficient (R2) Rate, % per year Convergence time (t), years |
-0.017 0.212 1.756 0.193 -1.325 0.045 1.63 70 |
Excl. Sochi, Anapa, Gelendzhik, and Tuapse district Coefficient β Invariable F-statistics P-value t-statistics Determination coefficient (R2) Rate, % per year Convergence time (t), years |
-0.0098 0.205 0.244 0.624 -0.494 0.007 0.95 68 |
As it can be seen from the data in the table, the assessment did not reveal a statistically significant relationship between the development pace of the territories and their initial state, since the obtained values are insignificant, and the determination coefficients are negligibly low. Testing the β-coefficient hypothesis is equal to zero gave positive result. Therefore, it cannot be concluded that there is an unconditional convergence, as well as that there is an unconditional divergence.
Testing the β-convergence hypothesis by years also did not give meaningful values (Table 5).
Table 5
Assessment of the unconditional (absolute) β-convergence model for the tourist
flow volume in the municipal formations of the Krasnodar Territory by years
|
Coefficient β |
F-statistics |
Determination coefficient (R2) |
2010 |
-0.006 |
2.758 |
0.071 |
2011 |
0.029 |
0.845 |
0.023 |
2012 |
-0.028 |
0.188 |
0.005 |
2013 |
-0.068 |
3.127 |
0.079 |
2014 |
-0.017 |
1.756 |
0.045 |
It should be noted that most of β-convergence coefficients are negative, that is, it could confirm the areas convergence as per the studied index at a certain rate per year. For example, the average convergence rate for 2009-2014 amounted to less than 2% per year, which is extremely low.
In general, despite the fact that there is certain differentiation growth observed and captured by different methods, the space non-uniformity of the areas of the South of Russia is still not sustainable in nature.
The obtained results allow for formulating the following conclusions:
Based on the obtained, the authors formulated the following conclusions:
The variation factor dynamics according to the characteristics of tourist flow volume and the “income” per tourist in municipal formations testifies to the lack of σ-convergence and to the increase in inequality between the areas of the Krasnodar Territory, which demonstrated an increase in the distance in the areas' development.
Analysis of individual contributions of municipal formations to the integral assessment of their differentiation demonstrated that several areas (Sochi, Anapa, Gelendzhik and Tuapse districts), in virtue by the special objective and subjective circumstances, sharply broke off in the tourist flow from the average level during the reviewed period, generating disequilibrium and being the “tranquility disturbers”.
The assessment of unconditional (absolute) β-convergence models did not demonstrate statistically significant assessments of the relationship between the areas development rates and their initial state. It is not possible to conclude that there is a single equilibrium strategy for these indicators in the context of the regional development of tourist and recreational areas of the South of Russia.
The research was conducted with the financial support of the Russian Foundation for Basic Research in the framework of the research project “Methodological Approach to Capacity Assessment and Scenario Projection of the Development of Tourist and Recreational Clusters in the Conditions of Territorial Differentiation” (Project No. 18-010-00665).
BAHAR, O., DOGAN, B., BOZKURT, K. Empirical Testing of Convergence Hypothesis of International Tourism Sector. Social Sciences. Year 2013, issue 1.
BARRO, R.J., SALA–I–MARTIN, X. Convergence. Journal of Political Economy. Vol 100, year 1992, issue 2, page 223–251.
BARRO, R.J., SALA–I–MARTIN, X. (1995). Economic Growth. New York: VcGraw–Hill.
BARRO, R.J., SALA–I–MARTIN, X. (1990). Economic Growth and Convergence across the United States. Cambridge: NBER Working Paper.
BARRO, R.J., SALA–I–MARTIN, X. (2004). Economic Growth. The MIT Press.
BOBKOVA, A.Yu. Political diagnostics of convergent-divergent processes in regional fiscal policy. Bisnesinform. Year 2013, issue 11, page 113–119.
DROBYSHEVSKY, S., LUGOVOY, O., ASTAFIEVA, E., POLEVOY, D., KOZLOVSKAYA, A., TRUNIN, P., LEDERMAN, L. (2005). Factors of economic growth in the regions of the Russian Federation. Moscow: Institute for Economy in Transition.
DUDETSKY, D.J. Assessment of effectiveness of managing a tourism destination competitiveness. Contemporary Economic Issues. Year 2014a, issue 3. Retrieved from http://economic-journal.net/index.php/CEI/article/view/111. DOI: 10.24194/31401.
DUDETSKY, D.J. Mechanism of competitive advantages of tourism destinations. Contemporary Economic Issues. Year 2014b, issue 4. Retrieved from http://economic-journal.net/index.php/CEI/article/view/115. DOI: 10.24194/41404.
DUDETSKIY, D.U. The concept of development of a tourist destination and ways of increasing its competitiveness (on the example of the Perm region). Contemporary Economic Issues. Year 2014c, issue 1. Retrieved from http://economic-journal.net/index.php/CEI/article/view/93. DOI: 10.24194/11405.
GRANBERG, A.G. (2007). Mathematical models of socialistic economy. Moscow: Economics.
GURIANOVA, L.S., PROKOPOVICH, S.V. Models for assessing the interregional interaction impact on the processes of territory development convergence. Bisnesinform. Year 2013, issue 1, page 62 – 67.
HOOI, L.H., SMYTH, R. (2006). Marketing, Malaysia Welcomes the World: Are Malaysia’s Tourism Markets Converging? Monash University Business and Economics.
IODCHIN, A.A. Decomposition of interregional convergence in Russia. Audit and financial analysis. Year 2007a, issue 4, page 475–482.
IODCHIN, A.A. (2007b). Econometric modeling of interregional convergence in Russia. Author's abstract of the Dissertation of the Candidate of Sciences (Economy). Moscow: MSU.
KATRAKILIDIS, C., KONTEOS, G., SARIANNIDIS, N., MANOLIDOU, Ch. Investigation of Convergence in the Tourist Markets of Greece. European Research Studies Journal. Vol XX, year 2017, issue 4A, page 707-729.
KIZIM, N.A., RAEVNEVA, E.V., BOBKOVA, A.Yu. (2011). Uneven regional development in Ukraine: the theoretical and methodological framework and assessment tools. Kharkiv: INGEK Publishing House.
KLEBANOVA, T.S., GURIANOVA, L.S., SERGIENKO, E.A., GONCHARENKO, G.S. Asymmetry analysis model of regional development. Problems of Economy. Year 2012a, issue 2, page 27-33.
KLEBANOVA, T.S., GURIANOVA, L.S., TRUNOVA, T.N., SMIRNOVA, A.Yu. Scenario modeling in the management of regional development. Businesinform. Year 2012b, issue 10, page 60-65.
KOLOMAK, E.A. Uneven spatial development in Russia: explanations of the new economic geography. The questions of economy. Year 2013, issue 2, page 132-150.
LAVROVSKY, B.L., SHILTSIN, E.A. (2009). Indicators of variation in regional studies. Novosibirsk: Novosibirsk state technical university.
LEAN, H.H., SMYTH, R. Are Malaysia’s Tourism Markets Converging? Evidence From Univariate and Panel Unit Root Tests with Structural Breaks. Tourism Economics. Vol 14, year 2008, issue 1, page 97-112.
LORDE, T., MOORE, W. Co-movement in Tourist Arrivals in the Caribbean. Tourism Economics. Vol 14, year 2008, issue 3, page 631-643.
MAKSIMOV, D.V. (2016). Statistics and dynamics of the tourist-recreational system development in the region: the Krasnodar Territory: Monograph. Krasnodar: Kuban State University.
MANKIW, G., ROMER, D., WEIL, D. A Contribution to the Empirics of Economic Growth. Quarterly Journal of Economics. Vol 107, year 1992, page 407–438.
NARAYAN, P.K. Are Australia’s Tourism Markets Converging? Applied Economics. Vol 38, year 2006, issue 10, page 1153-1162.
NARAYAN, P.K. Testing Convergence of Fiji’s Tourism Markets. Pacific Economic Review. Vol 12, year 2007, issue 5, page 651-663.
PHENICHNYKH, Yu.A. Methodological basis for convergence study. Bulletin of the Taganrog Institute of Management and Economics. Year 2015, issue 2, page 114-118.
QUAH, D. Empirics for Economic Growth and Convergence. European Economic Review. Vol 40, year 1996a, page 1353–1375.
QUAH, D. Twin peaks: Growth and convergence in models of distribution dynamics. Economic Journal. Vol 106, year 1996b, page 1045–1055.
RAEVNEVA, E.V., BOBKOVA, A.Yu. (2012). Decomposition of interregional differentiation by economy branches. Materials of the First International Scientific and Practical Conference of Students, PhD Students and Young Scientists. Petropavlovsk-Kamchatsky: Kamchatka State Technical University.
SALA–I–MARTIN, X. Regional cohesion: Evidence and theories of regional growth and convergence. European Economic Review. Vol 40, year 1996, page 1325–1352.
SALA–I–MARTIN, X. The classical approach to convergence analysis. The Economic Journal. Vol 106, year 1996, page 1019–1036.
SALA–I–MARTIN, X. (1998). Determinants of Economic Growth: A Cross–Country Empirical Study. MIT Press.
SALA–I–MARTIN, X. (1990). On Growth and States. Harvard University.
SAMIRKAŞ, M., BAHAR, O. Turizm Sektörünün Bölgelerarası Gelişmişlik Farklılıklarını Gidermedeki Etkisi: Yakınsama Modeli. Finans Politik and Ekonomik Yorumlar Dergisi. Vol 48, year 2011, issue 557, page 85-98.
SHILTSIN, E.A. (2010). Evaluation of the convergence and divergence of the regional space of Russia and Siberia. Author's abstract Of the Dissertation of the Candidate of Sciences (Economy). Novosibirsk.
SOLOW, R. Contribution to Theory Economic Growth. Quarterly Journal Economics. Vol 70, year 1956, issue 1, page 65–94.
SOUKIAZI, E., PROENÇA, S. Tourism as an Alternative Source of Regional Growth in Portugal: a Panal Data Analysis at NUTS II and III Levels. Portuguese Economic Journal. Vol 7, year 2008, issue 1, page 43- 61.
TOLMACHEV, M.N. Theoretical and empirical approaches to the agricultural production convergence. Bulletin of the Volgograd State University. Vol 1, year 2012, issue 20, page 193-199.
VASILJEVA, M.V., DUDETSKIY, D.U. Problems and priority directions of development of a tourist destination in the Perm region. Contemporary Economic Issues. Year 2014, issue 1. Retrieved from http://economic-journal.net/index.php/CEI/article/view/98. DOI: 10.24194/11407.
1. PhD in Economic sciences, Assoc. Prof. in Southern Federal University, Rostov-on-Don, Russia, 344006 Russia, Rostov-on-Don, 105/42 Bolshaya Sadovaya Str. E-mail: Pshenichnih.julia@gmail.com
2. PhD in Economic sciences, Head of the Department management technologies in the tourism industry, Southern Federal University, Rostov-on-Don, Russia, 344006 Russia, Rostov-on-Don, 105/42 Bolshaya Sadovaya Str. E-mail: Yakimenko.m@mail.ru
3. PhD in Economic sciences, Assoc. Prof. in Southern Federal University, Rostov-on-Don, Russia, 344006 Russia, Rostov-on-Don, 105/42 Bolshaya Sadovaya Str. E-mail: jertovskayaev@yandex.ru
4. Professor, Dr. of Economics in Sochi State University, Sochi, Russia, 354000 Russia, Sochi,94 Plastunskaya Str. E-mail: sveta.grinenko@gmail.com