![]() ISSN 0798 1015
ISSN 0798 1015

![]() ISSN 0798 1015
ISSN 0798 1015
Vol. 39 (Number 37) Year 2018 • Page 31
Andrey А. CHEREPASHKOV 1; Pavel A. SAMOYLOV 2
Received: 04/04/2018 • Approved: 20/05/2018
ABSTRACT: The article discusses the problems of creation and implementation of integrated automated systems in mechanical engineering. The necessity of using dynamic models for the organization of managing the processes of design and operation of integrated automatic design systems is justified. The use of S-shaped curves for identifying the processes in PLM systems is described. The results of surveys of enterprises and organizations of a machine-building cluster, the experimental data obtained as a result of the implementation of projects of implementing complex automated systems by ASCON-Samara Ltd serve as the informational, organizational and technological basis for the investigation. |
RESUMEN: El artículo discute los problemas de creación e implementación de sistemas automatizados integrados en ingeniería mecánica. La necesidad de utilizar modelos dinámicos se justifica para la organización de la gestión de procesos de diseño y operación de sistemas integrados de diseño automático. Se describe el uso de curvas en forma de S para identificar los procesos en sistemas PLM. Los resultados de las encuestas de empresas y organizaciones de un clúster de construcción de maquinaria, los datos experimentales obtenidos como resultados de la implementación de proyectos de aplicación de sistemas automatizados complejos por ASCON-Samara Ltd sirven como base informativa, organizativa y tecnológica para la investigación. Palabras clave: sistema PLM, tecnologías CA "x", modelado de procesos, curvas en S |

Computer-integrated manufacturing based on the usage of digital processing equipment, computer-aided design (CA”x”-technologies) and manufacturing operations management is one of the main drivers that ensure the development and competitiveness of modern industrial enterprises. Implementation and operation of integrated automated systems (IAS) requires significant modernization of the production infrastructure and re-engineering of all major business processes. It inevitably affects CAD, CAM, as well as SCADA, ERP, MES, PLM systems that create unified information and project-oriented industrial environment of computer-aided mechanical engineering.
In a market economy, the development of industrial programming and commercialization of software development inevitably lead to the advent of professional computer companies (vendors). They specialize in the development and implementation (integration) of application software for the industrial use. The results of surveys of enterprises and organizations of a machine-building cluster, the experimental data obtained as a result of the implementation of projects of complex automated systems by ASCON-Samara LTD at some leading enterprises of the region serve as the informational, organizational and technological basis.
The paradigm of product lifecycle information support that became popular in the 21st century, implemented by methods and means of CALS technologies significantly expands the subject area of industrial automation. It extends the latter "from marketing up to the disposal of the product" (Cherepashkov and Nosov, 2009). Practice shows, however, that vendors who are usually pressed for time, financial, labor and other resources in their PLM- Solutions (Product Lifecycle Management Solution) implement the system with limited functionality. As a rule, only the design and production stages of the life cycle are automated. However, these stages may have many different solutions within them, the choice of which is not a routine task, and requires a multi-criteria optimization approach for its successful solution.
In most scientific and practical works devoted to the problems of development, implementation and operation of automated systems for industrial use, multiple diagrams (constructed in accordance with the recommendations of current standards) are used that demonstrate the composition and data connections (structure) of the IAS (Cherepashkov and Nosov, 2009; Zelenin and Medvedev, 2009; Results of 2015…; Complex decisions…). But as practice shows, the information and component connections between subsystems are much more complex and multitask. Processes circulating in the system must be considered in dynamics in order to solve the problems of the analysis and optimization of IAS functioning. It is very important to support static diagrams by dynamic models that take into account the possibility of a powerful flow of information and works characteristic of organizational and technical automation systems for the industrial use in the creation and implementation of the IAS.
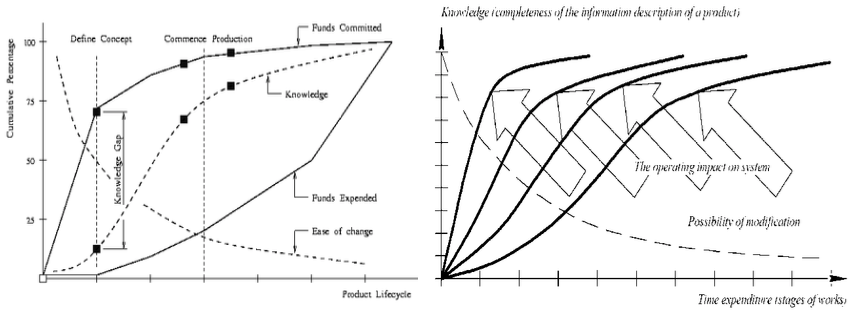
Certain data sets collected during the survey of enterprises in the implementation and operation of the IAS, provide an opportunity to develop a dynamic model of the basic processes. Usage of such models makes it possible to organize and improve the efficiency of controlling the processes of development, implementation and operation of organizational and technical automation systems. Methods of modeling various processes on the basis of autoregressive mathematical models are deeply seated in many sciences (Semyonychev, 2004). In engineering it was shown that for the simulation of homogeneous design processes related to the development and modification of design documentation relatively simple functions can also be used that have obvious counterparts in classical dynamics: for example, in the form of annular waves, a damped oscillatory process or concentric spirals (Komarov, 2010). According to the authors in order to identify complex processes in PLM systems that connect heterogeneous subsystems or stages of the engineering product life cycle so called “S” - shaped curves (S-curves) widely used by scholars in the discussion of creative design work in various subject areas [4] are most suitable. The following charts illustrate the laws of formation of a complete description of information products in the process of integrated design (Product Lifecycle in Fig. 1.a) (Terdalkar and Rencis, 2006).
At the initial stages of design works the knowledge about the product (Product Knowledge) is minimal, but the developer is given maximum freedom of decision-making (Ease of change). At the end of the pre-production stage the description of the product reaches a level sufficient for its manufacture, but there are few chances to change the product (without significant alterations of the whole project). Moreover, there is a big difference between the actual and the desired trajectories of the completeness of information projects (Knowledge Gap), which is the main cause of mistakes and failures in the development of innovative products. These arguments and dependencies can be applied to the processes of development and implementation of IAS with a high degree of similarity. It goes without saying that the distinctive features and specificity both of the subject area and the means of automation used should be taken into account.
The dynamics of changes in “S” -curves (Fig. 1.b) shows the effect of control actions (introduction of new information technologies and tools, personnel training, and so on) on the IAS effectiveness. The proximity to the reference curve may serve as an integral criterion of success (effectiveness) of the project implementation development. In their turn, violation of smoothness or deviation of design trajectories from the planned ones clearly show that there are some problems.
Figure 1
a) “S”-curve (shown as a dashed line); b) Trajectories of the project activity
The modern paradigm of the development of industrial automation industry is based on the following principles of system integration (Cherepashkov and Nosov, 2009).
In recent years, evident and stable processes of globalization take place among CAD vendors, which leads to the narrowing of the group of leaders. At the same time, these processes result in their consolidation and expansion of the subject area covered by software development companies. In opposition to this, there are significant changes in the market of PLM integration and introduction related to the evolution and increased levels of customer requirements to system solutions (Buley, 2016). Skilled managers in the field who experienced the hardships of the first stage of mass computerization with increasing frequency forgo so-called packaged (off-the-shelf) software in favor of customized development works in the IAS implementation. In these customized solutions significantly modified or bespoke software is used (Transition metrics…, 2016).
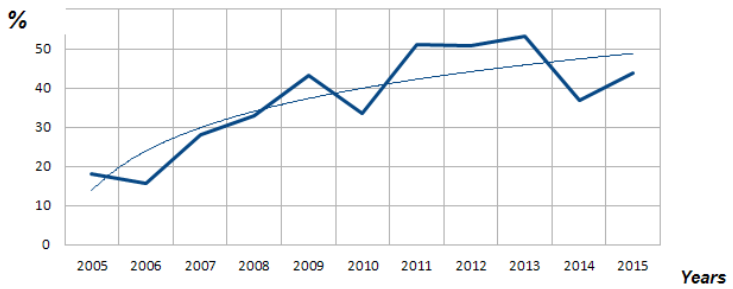
As far back as 10 years ago, many design organizations and production associations sought to independently carry out the implementation of projects, to adapt and refine standard software or even develop their own applications (Komarov, 2010; Zelenin and Medvedev, 2009). However, in recent years, Russian companies (following the example of foreign corporations (Autodesk creates…) increasingly outsource the processes of IAS development and implementation to external integrators. Fig.3 shows the graph illustrating the increase in the share of engineering services in the total order portfolio of one of the largest dealers and integrators of complex CAD solutions in Samara region - ASCON-Samara Ltd (Fig. 2).
The volume of design work at the regional ASCON representation has been steadily growing during a representative time span (it has increased by 2.7 times and exceeded the 50 percent mark over a decade). The growing logarithmic trend fits the general characteristics of this tendency. Extrapolation of the chart makes it possible to predict a significant increase in the proportion of original customization research and work in the activity of professional integrators in the future. Consequently, it will be possible to provide qualitative changes in the nature of activities of the regional innovative companies in the field of industrial automation, consisting in the transition from mostly dealer functions to the development and implementation of customized solutions. This trend of industrial automation market is noticed by other system integrators (Results of 2015…; Complex decisions for…; Transition metrics…). CAD vendors who, over decades, have been progressing due to replicating popular software products are increasingly forced to deal with software development. But usually this occurs only under special (long-term and high-yield) agreements with major industrial associations and corporations. (Complex decisions for…) The number of such projects is limited by the resources of central development teams. Their cost is high, and the implementation is hindered by the territorial, temporal, organizational and other barriers which inevitably arise in the interaction with users remote from the central office. In the case of foreign partners the problems are compounded by linguistic, financial and even cultural aspects. In this case, the vendors have to create an extensive network of offices or delegate function customization to subcontractors (Autodesk creates…).
Integrator companies operating locally are economically and technically more efficient in implementing projects even at small enterprises. In so doing they use their own (or localized) components of support tools for automated systems and the process of designing and deploying the ICC becomes more flexible and manageable, partly due to operational planning and accounting of work.
Figure 2
The share of services in the total order portfolio of ASCON-Samara Ltd
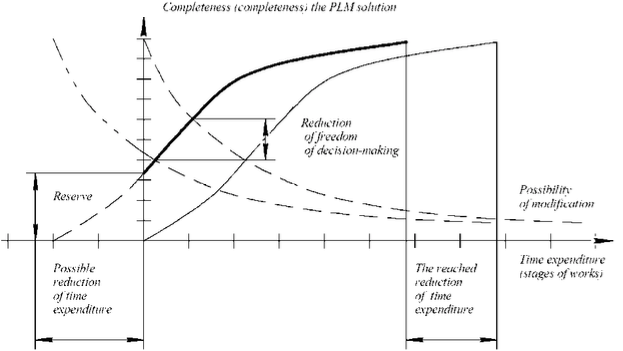
In the known charts that reflect the dynamics of designing (including Fig. 1) the construction of schedules starts from the "zero point" (the origin). We assume that the development of a new project also starts from zero, both in terms of time and the information description level. And if this holds for counting down the start of works, the starting level of information for system description usually already contains a certain set of data in the form of standard or template patterns. It is vitally important for representing the laws of the design activity and implementation organizations in particular because the initial level of "knowledge" of the object reflects both the level of competence of the integrator company staff and the presence of certain groundwork in the system components. In this case S-curves in the graphs must shift to the left of the vertical axis, as shown in Fig. 3, while the initial part of the curve is cut down to a complete loss of the first inflection point in the implementation of off-the-shelf solutions.
In the above graph the vertical axis marks the levels of "knowledge of the subject" or "completeness of information" expressed as a percentage (Cumulative percentage) of a given level of development, or even a certain ideal, for example, complete definition of the object. It should be noted that complete definition of PLM-systems is practically unattainable due to a number of reasons. Firstly, according to the same principles of system engineering, any sufficiently complex organizational and technical system must constantly develop and improve to maintain its existence (Continuous Acquisition).
Figure 3
Change of the trajectory of the introduction in the case of a standard solution
Secondly, according to the laws of designing the way from ignorance (technical specifications) to knowledge (a new technical object) comprises a substantial probability component. Final specifications of new products are only projected at the early stages. By the way, models discussed in this article are also created for solving forecasting tasks. The integrator company and the customer enterprise need to understand: how will the process of development and implementation of the automated system develop? What results can be expected? They also need to realize: what affects the timing and achievement of the project? And how can you influence them?
Construction of dynamic trajectories demonstrates the basic laws of the development of the project implementation process quite convincingly. In this case the S-shaped curve is one of the most convenient and evident. Thus, for example, Figure 4 shows that significant reduction in time consumption is possible due to the fact that a promotional organization possesses a certain reserve in the form of off-the-shelf solutions. However, in this case, the variability and flexibility of designing is somewhat decreased. In the case of packaged solutions the implementation costs are minimal, but the quality of the project implementation is also low (Fig. 4).
Figure 4
Different implementation trajectories in using: 1) packaged solutions (Figure left);
2) the original design made by the enterprise
(chart on the right);
3) project, implemented on the basis of the decisions of the integrator company - (middle graph)
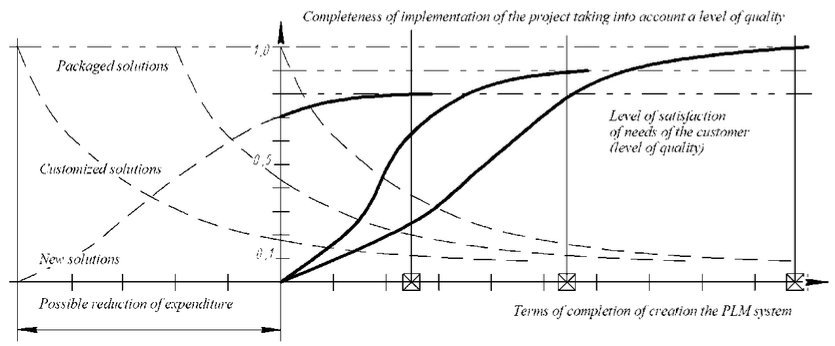
When a completely original design is being created, it is possible to achieve maximum satisfaction of the specification requirements, but the project execution time is extremely long, among other things, because of time-consuming debugging of new software and other components of the integrated CAD software tools.
The choice of a sufficiently evident formalized indicator of the project completeness level is the least specified in the scientific and practical aspects and is the key element of the approach to modeling. A number of scientific studies (Komarov, 2010) uses the number of developed design documents as a criterion for assessing the level of information completeness and an indicator of the design process dynamics. Such an indicator is quite logical from the standpoint of traditional "paper-centric" method of project work. In fact, engineering work standardization at many design bureaus was related to the number of sheets of paper issued by the executive for a specific calendar period, regardless of their content. In case of computer-aided design it is necessary to take into account electronic documents, models, design and data information arrays and other things which are rather difficult to equate with paper formats. How can one evaluate and compare programming, testing, training, technical support?
That is why the criterion of labor input is proposed to be used for integrated assessment of work on the creation and implementation of automated systems (as well as other new technical objects created as a result of poorly formalized human activity). Organizations that provide services widely use labor input for calculating the cost of works. The so-called labor hour (man hour) comprises not only the time of execution of the works, but also their nature, complexity, importance and so on. Of course, this approach contains a certain objective (expert) component. But in the course of many years of work in a competitive environment of specialized entities (which include integrator companies) expert evaluations of the complexity of standard jobs get smoothed over, both in absolute and relative terms. Besides, in commercial companies all paid jobs are skillfully measured. The cost of the completed project is evaluated by the total estimated labor input.
A typical list of works for developing a PLM solution includes the following enlarged steps:
1. Enterprise survey.
2. Development of the system concept.
3. Development of technical and commercial proposals.
4. Development of the system architecture, integration of purchased software and so on.
5. Development of software, informational, organizational and other supporting tools.
6. Testing of subsystems.
7. Development of all kinds of supporting documents.
8. System deployment at automated workplaces.
9. Staff training.
10. Staff consulting.
11. System maintenance.
Fig. 5 - 6 show the actual graphs constructed according to a number of specific projects. For each type of projects 2 comparable decisions have been chosen. The charts of the development and implementation of the original system (Fig. 5) are rather flat due to longer duration of practically all stages. The initial stages of work involving negotiations with customers, the definition of system requirements, examinations, and the formation of the IAS concept are very important but not the most labor-intensive. Software development, debugging and testing are the most time-consuming and labor-intensive processes. These stages involve a large group of developers.
Figure 5
Trajectories of the development and introduction of new (unique) PLM solutions
(On the horizontal axis - project stages, on the vertical axis - labor input in relative sizes)
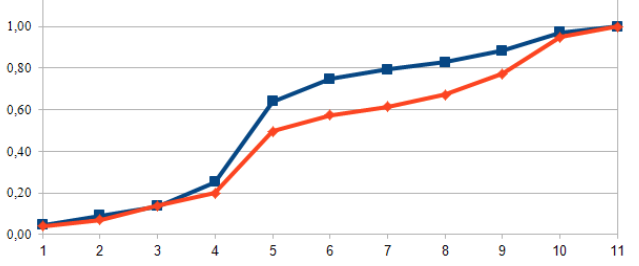
At the final stages the scope of activity is reduced. It should be mentioned that the support of the original system may continue almost indefinitely over time. The continuation of the curve becomes exponential. That is why the graphs are artificially interrupted when reaching the level of system operation stability acceptable for the customer.
In some cases a lengthy calm period is followed by logical development of the IAS maintenance into a new project to upgrade and expand the system. This should be regarded as an independent development. But the dynamics of the process in this case is closer to a customized solution (Fig. 6.a). When implementing customized solutions the typical list of steps usually remains the same. However, the duration of production stages is significantly reduced. The reserve is used at the initial stages and their labor intensity is lower than that of the original ones. Labor intensity rises at the production stages when standard subsystems are refined and new support tools are developed. This is clearly reflected in the graph leading to its compression along the horizontal axis, and larger curvature in the central part.
The trajectories of introducing packaged solutions (Fig. 6.b) do not look like “S”, but, as mentioned above, it is the consequence of undercutting of the designing trajectory due to already completed developments and the reserve used. The indicators of solution quality are not taken into account in constructing the graphs (fig. 6-8). The level of quality defined in international standards as the “degree of customer satisfaction” can be indirectly assessed according to the list of desirable improvements in a system.
Figure 6
a) Trajectories of development and implementation of customized solutions
b) Trajectories of implementation of packaged solutions
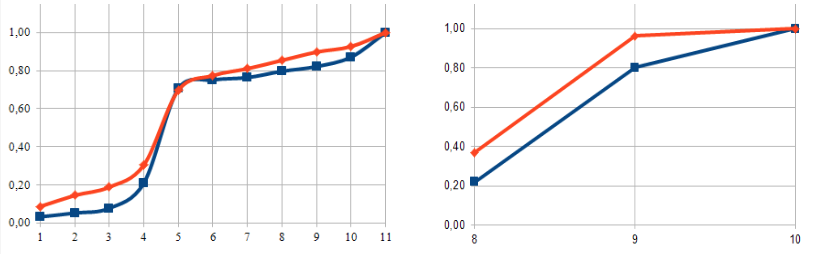
As a rule, a customer needs time to see what improvements and modifications are required and thus new customer requests form gradually over the entire period of operation of the system. Later on the original packaged projects might develop into a customization cycle. In such a case production stages of development manifest themselves and the trajectories of system dynamics again acquire the characteristic S-shape as in the theoretical model described above.
Autodesk creates new type of a partner network in Russia. Available at: http://isicad.ru/ru/news.php?news=18379 (Access date 18.03.16).
Bespoke Vs COTS. Available at: http://www.blueberrysystems.co.uk/Resources/WhitePapers/BespokeVsCommercialOff-The-Shelf.aspx (Access date 18.03.16).
Buley, N.V. (2016). Substantiation of ways of monitoring the behavior of customers and suppliers in the construction industry. Materials of the Afanasiev Readings, 3(16): 99-107.
Cherepashkov, A.A., Nosov, N.V. (2009). Computer technologies, modeling and automated systems in machine building. Volgograd: In-folio.
Complex decisions for the ASKON Mechanical engineering. Available at: ASKON, Inc. http://ascon.ru/press/news/items/?news=2043 (Access date 12.02.16).
Dietz, P., Penschke, S., Ort, A. (1997). Strategies for Product Knowledge Management and Feedback to Design – Application Examples. 2nd Workshop on Product Knowledge Sharing and Integration (ProKSI—97), Sophia Antipolis, France.
Komarov, V.A. (2010). Models of assessment of acceleration of construction work in knowledge-intensive mechanical engineering due to parallelization of iterative processes of development. Bulletin of the Samara State Aerospace University, 4 (24), 224-231.
Results of 2015. Consulting KORUS Company. Available at: http: //korusconsulting.ru/press-center/news/itogi-goda-korus-consulting.html (Access date 29.02.2016).
Semyonychev, V.К. (2004). Identification of economic dynamics on the basis of auto regression models. Samara: Publishing House of the Russian Academy of Sciences Center.
Terdalkar, S.S., Rencis, J.J. (2006). Graphically driven interactive finite element stress reanalysis for machine elements in the early design stage. Finite Elements in Analysis and Design, 42 (10), 884-899.
Transition metrics and revenue metrics offer alternative scenarios for Autodesk’s fiscal year. Available at: http://gfxspeak.com/2016/02/26/autodesk-revenue-down-in-fourth-quarter-flat-for-fiscal-year/ (Access date 18.03.16).
Zelenin, A.P., Medvedev A.K. (2009). Experience of through automation of JSC Plant of Drilling Equipment: collection of articles of the third internationa projects l scientific and practical conference "Systems of design, modeling, preparation of production and management of CAD/CAM/CAE/PDM”. Penza: Privolzhsky Dom Znaniy (Volga house of knowledge).
1. PhD., Prof. Department of Mechanical Engineering. Samara State Technical University. Samara. Russion Federation. E-mail: cher-mail@mail.ru
2. ASCON-Samara Ltd. Samara. Russion Federation. E-mail: samoylov.p.a@yandex.ru