![]() ISSN 0798 1015
ISSN 0798 1015

![]() ISSN 0798 1015
ISSN 0798 1015
Vol. 39 (Number 39) Year 2018 • Page 14
Isabel MALDONADO 1; Carlos PINHO 2; Francisco RODRÍGUEZ DE PRADO 3; Carla AZEVEDO LOBO 4
Received: 07/04/2018 • Approved: 20/05/2018
4. Estimation and adjustment quality
ABSTRACT: In this paper we investigate the yield curve forecasting performance of dynamic models combining yield curve factors and macroeconomic variables. We test dynamic models using sovereign debt data, inflation rate and annual variation of the industrial production index for Portugal and Spain. We also explore the dynamic correlations between the yield curve factors of the countries under analysis. Results indicate that the consideration of macroeconomic factors has a positive contribution to the improvement of forecasts. The analysis shows a strong correlation between the two countries level factor and important changes in the curvature factor correlations associated with international crisis episodes. |
RESUMEN: En este trabajo investigamos la capacidad de previsión de modelos dinámicos de la estructura temporal de las tasas de interés que combinan factores de la curva de rendimiento y variables macroeconómicas. Probamos los modelos dinámicos de la curva de rendimiento utilizando datos de deuda pública, tasa de inflación y variación anual del índice de producción industrial para Portugal y España. También exploramos las correlaciones dinámicas entre los factores de curva de rendimiento de los países bajo análisis. Los resultados indican que la consideración de los factores macroeconómicos tiene una contribución positiva a la mejora de las previsiones para los dos. El análisis de correlaciones muestra una fuerte correlación entre el factor de nivel de dos países y cambios importantes en las correlaciones del factor de curvatura asociadas con episodios internacionales de crisis. |

In the last decades the modelling and forecasting of the term structure of interest rates has seen significant progress in pursuit of the answer to the question “Is it actually possible to use finance theory to extract this information and improve the forecasts of the treasury yields?” (Carriero, 2011, p. 425). Diebold et al. (2006, p.415) state that “From a macroeconomic perspective, the short-term interest rate is a policy instrument under the direct control of the central bank, which adjusts the rate to achieve its economic stabilization goals. From a finance perspective, the short rate is a fundamental building block for yields of other maturities, which are just risk-adjusted averages of expected future short rates”.
Given the importance of the term structure of interest rates for the most various economic agents, several authors have been making efforts to create of a model which, on the one hand, allows a precise estimate of the structure of interest rates and, on the other hand, is capable of predicting its future developments.
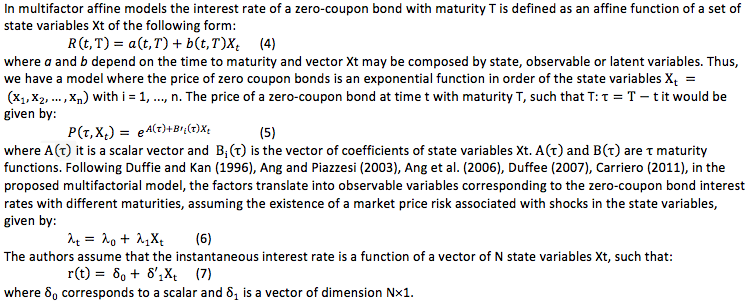
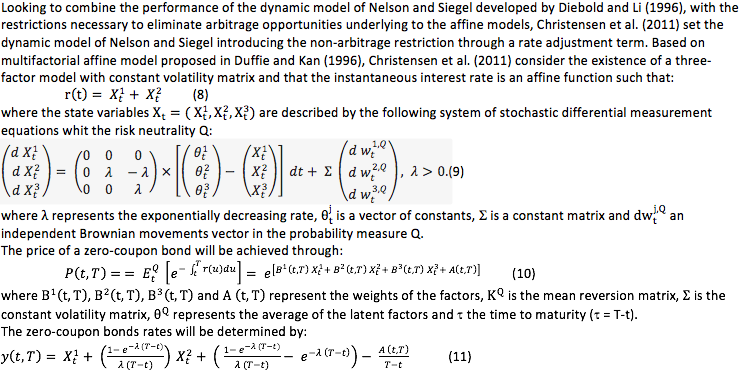
Since the 70´s, models such the ones of Merton (1973), Vasicek (1977), Cox et al. (1985), Duffie and Kan (1996), Dai and Singleton (2000), Duffee (2002) and Ang and Piazzesi (2003) tries to model the yield curve assuming that the interest rates behaviour is defined by stochastic processes. At the same time, McCulloch (1971, 1975), Carleton and Cooper (1976), Vasicek and Fong (1982), Nelson and Siegel (1987) and Svensson (1994) developed other class of models based on the calculation of the spot rates that, at the time of estimation, are best adjusted to the prices contracted in the equilibrium market. The Nelson and Siegel´s model stands out as one of the most popular models for the modelling and forecasting of the term structure of interest rates.
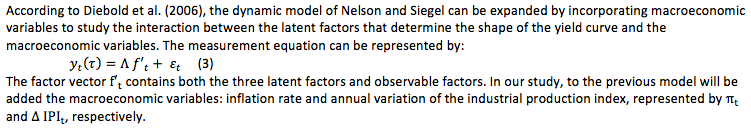
In order to improve the models’ predictive ability, advances have been made to combine the dynamics of the term structure of interest rates with fundamental economic variables. Among the works of reference are those of Ang and Piazzesi (2003), Kim and Wright (2005), Diebold and Li (2006), Diebold et al. (2006) and Rudebush and Wu (2008). Diebold et al. (2006) depart from the dynamic version of the Nelson and Siegel model proposed by Diebold and Li (2006) and expand their scope by introducing macroeconomic variables as explanatory factors of the term structure of interest rates. Their results prove that the introduction of macroeconomic variables improves the explanatory power of the term structure models. Studies such as the ones of Moench (2008), De Pooter et al. (2010), Morales (2010), Bikbov and Chernov (2010), Kaya (2012), Favero et al. (2012), Coroneo et al. (2016), Paccagnini (2016), Rubaszek (2016) and Vieira et al. (2017) point in the same direction. However, much of the studies mentioned does not address the issue of out-of-sample forecasting.
Simultaneously, several studies show the existence of a strong correlation between the public debt markets of the different EU countries. One of the first works in this area was developed by Hafer et al. (1997), who analyse the existence of correlations between long-term interest rates in four European countries: Belgium, France, Germany and the Netherlands. This correlation is also demonstrated in a number of other studies analysing both the connections within European Union markets and wider international connections, with markets such as the USA and Japan. Given the importance of knowing the co-movements between the interest rates latent factors, some of these studies focus on the analysis of global international factors: Ilmanen (1995) for the USA, Canada, Japan, Germany, France and the United Kingdom; and Driessen et al. (2003) for USA, Germany and Japan. Continuing the search for the determinants of interest rate behaviour, Engsted and Tanggaard (2005) and Tam and Yu (2008), chose to use of models of decomposition of the term structure into factors. Engsted and Tanggaard (2005), in an analysis for the US and German markets, decompose the excess bond return into three components: information on future inflation, information on future real interest rates and information on the future excess bond return. They conclude that information on future inflation is the main determinant behind the co-movement of the interest rates of the public debt of the two countries. On the same line, but based on different factors, Tam and Yu (2008) apply the Diebold et al. (2006) model to model US, Japanese and German government bond yield curves by combining the yield curve latent factors with observable macroeconomic variables. They analyse the dynamic correlations between the different markets applying, concluding from a positive correlation between the level factors in the USA, Germany and Japan, but the results concerning the slope and curvature factors are inconclusive. Antonakakis (2012) studies the correlation between the spreads of public debt interest rates of different European Union countries, Austria, Belgium, France, the Netherlands, Greece, Ireland, Italy, Portugal, Spain and Germany and the results of the correlation estimates suggest an increase in correlations from the beginning of the sample to the beginning of 2010, when they begin to decrease gradually until June 2012, indicating a dissociation between the bond markets in the zone Euro with the public debt crisis.
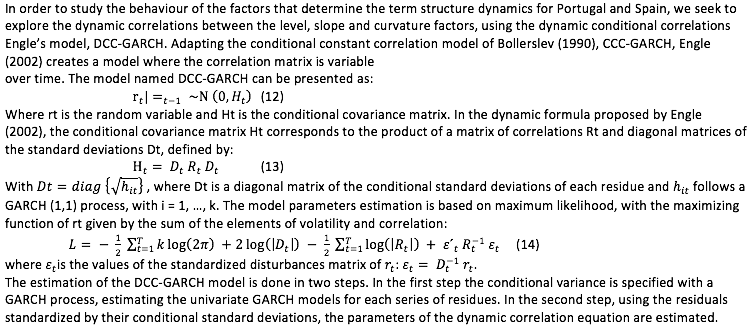
The aim of this paper is to examine forecasting performance of term structure dynamic models using latent factors as well as macroeconomic information. Based on the analysis of the term structure factors behaviour, we also seek to explore the dynamic correlations between the level, slope and curvature, using the dynamic conditional correlation model DCC-GARCH.
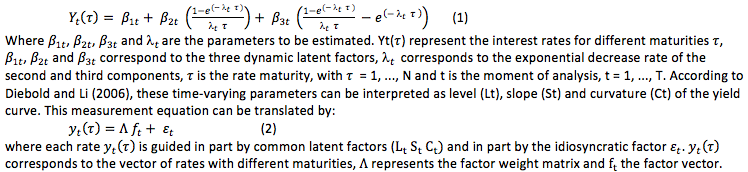
Diebold and Li (2006) proposed to study and estimate the term structure of interest rates using the model proposed by Nelson and Siegel (1987), assuming that the parameters vary over time. The dynamics of the term structure would be described by the following equation:
The empirical analysis is based on monthly of the public debt interest rates of Spain and Portugal for the period from January 1990 to December 2012, with maturities of 3, 6, 9, 12, 24, 36, 48, 60, 72, 84, 96, 108 and 120 months (Figure 1).
Figure 1
Term structure of interest rates: Portugal and Spain
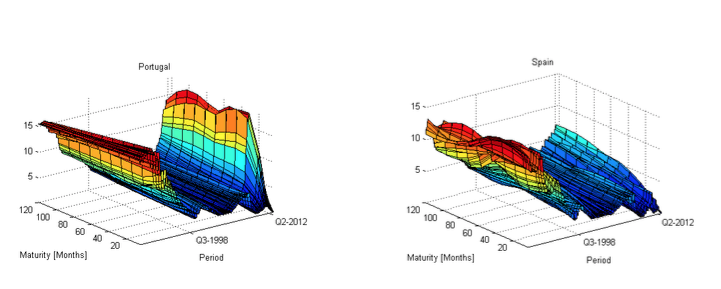
The data were collected directly from the respective Central Banks. For the missing maturity, we used the non-parametric interpolation procedure proposed by McCulloch (1971, 1975). Data on macroeconomic variables were obtained through the Organization for Economic Cooperation and Development - OECD: EO = Economic Outlook, MEI = Main Economic Indicators. For the inflation rate was used the consumer price index (CPI) and for the annual change in industrial production index were used data relating to the industrial production index, total industry excluding construction (ICI).
In order to assess the adjustment quality of the dynamic Nelson and Siegel model (DNS), we proceed the estimation, assuming autoregressive specifications of first order, AR(1), and vector autoregressive specifications of first order, VAR(1). For comparative purposes, it was also estimated the dynamic version of the affine Nelson and Siegel model, ADNS, which will be used in the analysis of the root mean square error. The estimation was carried out by maximum likelihood and the results for the DNS dynamic model with AR(1) and VAR(1) specifications, as well as, for the affine dynamic model ADNS, show that the level factor highly persistent, followed by the factors slope and curvature.
The degree of adjustment between the observed rates and estimated rates, measured by the Root Mean Square Error (RMSE) is generally high for the different models and the models can capture with sufficient degree of adequacy the interest rates observed for different maturities. The estimation results show that none of the models analysed seems to be clearly superior to the others in terms of adjustment. With regard to the temporal dimension, DNS and ADNS models have a good adjustment in market stability phases, however, in periods of high volatility the adjustment quality decreases considerably.
Aiming to assess the models predictive power, the methodology was based on the rolling windows method, keeping the size of each sub-sample and moving a monthly observation each month. The data set was divided into two subsets: an initial, January 1990 to December 2002 used for the initial estimation, and a second subset, January 2003 to December 2012, used for forecasting. Given the forecast period considered, we use rolling windows with 120 observations and for the prediction horizons set, h = 1, 3, 6, 9, 12, 15 and 18 months, were estimated for each maturity 119, 117, 114, 111, 105 and 102 forecasts. For each of the 13 maturities estimated (3, 6, 9, 12, 24, 36, 48, 60, 72, 84, 96, 108 and 120 months) was determined the RMSE as well as the ratio RMSE and RMSE of the random walk model (RW).
The analysis of the models’ predictive ability was carried out using the DNS autoregressive first-order model (DNS-AR (1)) and a vector autoregressive model of first order (DNS-VAR (1)). The relative performance of each model was measured by ratio of the RMSE obtained from the model to the RMSE of the random-walk process.
The out-of-sample forecasts results indicate that the model based on a VAR (1) process has a superior performance that the model based on an AR (1) process, although assuming similar error values. However, its performance in terms of forecasting is not systematically higher than the RW model for some of maturities under analysis.
For Spain, we conclude that the three models’ performance for short-term maturities is very close to all forecast horizons. The RMSE presents values between 0.278 (RW) and 0.486 (AR) for 1-month forecast horizon (h = 1), between 0.534 (RW) and 0.751 (RW) for 3-month forecast horizons (h = 3) and between 0.649 (RW) and 0.889 (VAR) for 6 months (h = 6). Results show a decrease in the models’ predictive ability as the forecast horizon increases, especially for shorter maturities. The models present greater predictive ability for the longer maturities, especially for maturities of 108 and 120 months in which the RW model stands out.
Table 1 presents the Spanish case, assuming the use of only latent factors of term structure and allows to compare the performance of the AR (1) and VAR (1) models with respect to the RW model. It should be noted that the AR (1) and VAR (1) models clearly outperform the RW model for 3-month maturities and 36-96 months for all forecast horizons.
Table 1
Root mean square error ratio for DNS-AR
and DNS-VAR models, Spain.
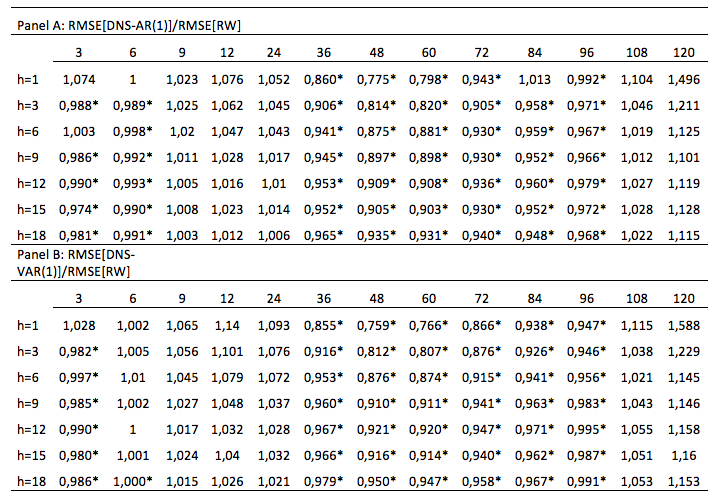
Table presents in two panels the RMSE ratio for Spain, for out-of-sample forecasts, for the autoregressive of first order process AR (1) in latent factors model (DNS) (Panel A) and for the vector autoregressive of first order process VAR (1) in latent factors model (DNS) (Panel B). The values marked with the symbol * correspond to the forecast horizons (h) and maturities for which the models show a superior performance. The forecasts in all cases presented were made for the period between 01:2003 and 12:2012. The forecasts were made for the maturities of 3, 6, 9, 12, 24, 36, 48, 60, 72, 84, 96, 108 and 120 months and for forecast horizons of 1 to 18 months (h=1, h=3, h=6, h=9, h=12, h=15 and h=18).
Table 2 present the results of the RMSE ratio for the Portuguese case. We found that the models have more difficulty in forecasting future interest rates, with the exception of the 1-month forecasts, the 3-month forecasts for the 3 to 9-month maturities and the forecast to 6 months for the maturity of 3 months. The results obtained for the Portuguese case may be related to the strong period of financial instability felt in Portugal which, accompanied by a strong sovereign debt crisis, led to a great uncertainty in interest rates associated with public debt. In comparative terms, the AR (1) and VAR (1) models generally outperform the RW model, mainly for 3-month maturities and 72-96 months, for most prediction horizons.
Table 2
Root mean square error ratio for DNS-AR
and DNS-VAR models, Portugal.
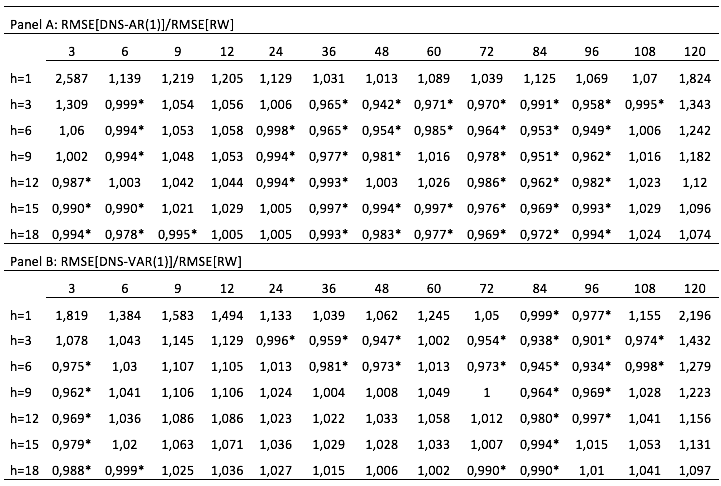
Table presents in two panels the RMSE ratio for Portugal, for out-of-sample forecasts, for the autoregressive of first order process AR (1) in latent factors model (DNS) (Panel A) and for the vector autoregressive of first order process VAR (1) in latent factors model (DNS) (Panel B). The values marked with the symbol * correspond to the forecast horizons (h) and maturities for which the models show a superior performance. The forecasts in all cases presented were made for the period between 01:2003 and 12:2012. The forecasts were made for the maturities of 3, 6, 9, 12, 24, 36, 48, 60, 72, 84, 96, 108 and 120 months and for forecast horizons of 1 to 18 months (h=1, h=3, h=6, h=9, h=12, h=15 and h=18).
In order to assess the impact of the introduction of macroeconomic variables in the dynamic models, we added to the state vector of the first order VAR(1) model two macroeconomic variables, representing inflation rate and annual change in the industrial production index.
Similarly, to the previous analysis, we present for the model with macroeconomic variables the ratio of the RMSE of each of the dynamic process and the RMSE of the RW model. Results indicate the existence of a positive contribution to the performance of dynamic models resulting from the incorporation of macroeconomic data.
Table 3
Root mean square error ratio of the DNS-VAR
model with macroeconomic factors, Spain.
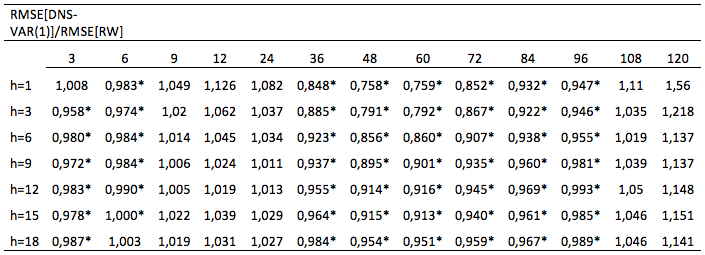
Table shows the RMSE ratio for Spain, for the out-of-sample predictions of the vector autoregressive first order VAR (1) for latent factors model (DNS) and macroeconomic variables. The values marked with the symbol * correspond to the forecast horizons (h) and maturities for which the models have a superior performance. The predictions in all cases were carried out for the period from 1:2003 to 12:2012. The forecasts were made for the maturities of 3, 6, 9, 12, 24, 36, 48, 60, 72, 84, 96, 108 and 120 months, and for forecast horizons of 1 to 18 months (h=1, h=3, h=6, h=9, h=12, h=15 and h=18).
Table 3 presents the results for Spain, considering the inclusion of macroeconomic variables in the forecasting model. There is an improvement in the results by the introduction of macroeconomic information. Based on the analysis of table 3, we observed an improvement in the performance of the Nelson and Siegel dynamic model when compared to the values presented in table 1. When we compared the performance of the VAR (1) model with the RW model, we also see a clear improvement in performance against the RW for 6-month maturity interest forecasts.
Table 4
Root mean square error ratio of the DNS-VAR model with macroeconomic factors, Portugal.
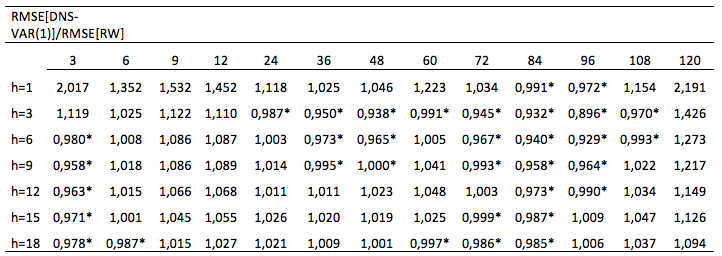
Table shows the RMSE ratio for Portugal, for the out-of-sample predictions of the vector autoregressive first order VAR (1) for latent factors model (DNS) and macroeconomic variables. The values marked with the symbol * correspond to the forecast horizons (h) and maturities for which the models have a superior performance. The predictions in all cases were carried out for the period from 1:2003 to 12:2012. The forecasts were made for the maturities of 3, 6, 9, 12, 24, 36, 48, 60, 72, 84, 96, 108 and 120 months, and for forecast horizons of 1 to 18 months (h=1, h=3, h=6, h=9, h=12, h=15 and h=18).
Tables 4 show the results for Portugal. Again, comparing with table 2, the results regarding the inclusion of macroeconomic variables in the model are higher, for all maturities, except for the 3-month interest rate in forecast horizons of 1 to 6 months. However, in the Portuguese case, the models continue to present a forecast performance lower than that the one shown for Spain, probably due to the climate of financial instability felt in the country. This can also be confirmed by the analysis of the temporal evolution of the RMSE ratio presented in the next point.
The results obtained after the incorporation of the macroeconomic variables, inflation and annual variation of the index of industrial production point to an improvement in terms of forecast for the dynamic model of Nelson and Siegel. The positive contribution of the inclusion of macroeconomic information was also reflected in an improvement in root ratios of the mean square error of the models against the mean square error of the random walk model. Even if, in many cases, the random walk model continues to have a higher forecasting capacity, the VAR (1) model considering both these macroeconomic factors, performs better for short maturities, as well as for long maturities.
In order to analyse the evolution of the model's performance compared to models that do not include macroeconomic data, presented in Figures 2 and 3, we study the evolution of the RMSE for the latent factors models (DNS) compared to the RMSE of the random walk model for the autoregressive of first order process (DNS-AR(1)), the vector autoregressive of first order process (DNS-VAR(1)) and the autoregressive of first order process, incorporating macroeconomic factors (DNS-VAR(1)MF). The data are for the period from January 2003 to December 2012, and for maturities of 1, 5 and 10 years and forecasting horizons 3 and 6 months.
Figure 2 presents the evolution of the RMSE of dynamic models (DNS) for Portugal. The uncertainty derived from the financial crisis and the sovereign debt crisis is notorious in the evolution of the series representing the root ratio of the mean square error of the different models in the last sample period. However, it is precisely in this period that we observe the clear contribution of the inclusion of macroeconomic information in the VAR (1) model. The performance of the VAR (1) MF model clearly exceeds that of the AR (1) and of the VAR (1) models, which generally have higher root mean square root mean values. This effect is mainly visible in the maturities of 1, 5 and 10 years for a forecast horizon of 3 months.
Figure 2
Portugal – Root mean square error ratio evolution
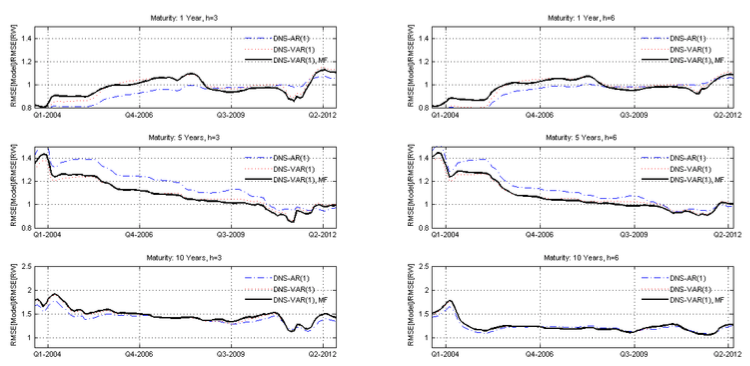
Note: RMSE evolution for Latent factors models (DNS) with autoregressive of first order process [DNS-AR (1)], with vector autoregressive of first order processes [DNS-VAR (1)] and vector autoregressive of first order processes incorporating macro-economic factors [DNS-VAR (1) MF] related whit the RMSE of the RW specification.
Figure 3
Spain – Root mean square error ratio evolution
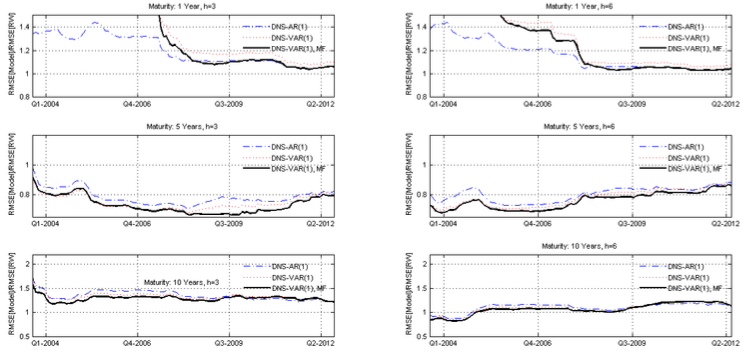
Note: RMSE evolution for Latent factors models (DNS) with autoregressive of first order process [DNS-AR (1)], with vector autoregressive of first order processes [DNS-VAR (1)] and vector autoregressive of first order processes incorporating macro-economic factors [DNS-VAR (1) MF] related whit the RMSE of the RW specification.
Figure 3 shows the time series of the mean squared error ratio of the different models for Spain. There is a great instability in the performance of the models in the first periods of the sample, especially for the 1-year maturity. The performance stabilizes in the next sample periods and a similar behaviour of the time series relative to the root mean square error of the different models is clear. For the 5-year and 10-year maturities, the VAR model incorporating macroeconomic variables (VAR (1) MF) performs better than the AR (1) and VAR (1) models that only include yield curve latent factors.
As we have seen by examining the Figures 2 and 3, for maturities of 1, 5 and 10 years and prediction horizons of 3 and 6 months, the performance of AR(1), VAR(1) and VAR(1)MF models varies over January 2003 to December 2012. The analysis of the evolution of RMSE series allows us to conclude that, in general, the inclusion of macroeconomic data in dynamic models, namely information on the inflation rate and the annual change in the industrial production index, improves its relative performance, which can be seen through the evolution of the RMSE series of the model with best performance, the dynamic model with macroeconomic variables DNS-VAR(1)MF.
We present in figure 4 the estimates of the dynamic correlations of the term structure factors for Portugal and Spain. The correlations between Portugal and Spain are persistent and always positive, but with small decreases over the period under review. There have also been declines since 2009 as a result of the financial crisis, although this effect is weakened between the two countries of the Iberian Peninsula.
Figure 4
Dynamic correlation, DCC model, Level, Slope, Curvature
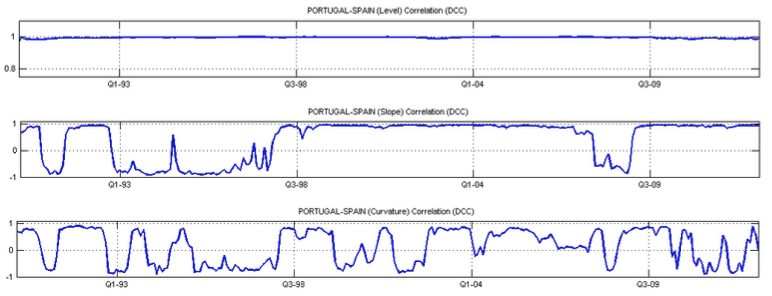
Note: Dynamic correlation of the term structure of interest factors for Portugal and Spain.
Figures 4 also present the estimates of the dynamic correlations of the factor level and the curvature factor, respectively. Contrary to that observed for the level factor, the estimated correlations for the slope factor and for the curvature factor are much less persistent, with large amplitude oscillations and a different signal. We found periods of high positive correlation interleaved with periods of strong negative correlation. Given the impact scale on the financial markets caused by the events that led to such fluctuations, some particular periods deserve our attention.
The exchange rate turbulence observed in 1992/1993 with the speculative attacks on the British pound that had repercussions in the other currencies leaves a very strong mark. The UK government reacted to the attack on the currency, allowing it to float, seized the opportunity to decrease interest rates and withdrawn its currency from the Exchange Rate Mechanism (ERM) of the European Monetary System (EMS). In the UK, rates have been reduced from a level 9-10 percent to about 5 percent with the currency depreciating around 30 percent and the effects were felt in the other countries, also occurring a devaluation of the peseta (Spain) and the escudo (Portugal).
Later, in 2008, the so-called “Global Financial Crisis” occurs. In fact, the financial crisis began in the summer of 2007 and intensified in September 2008 with the bankruptcy of Lehman Brothers. As a consequence of this turbulent period, the global financial crisis turns into a sovereign debt crisis in the euro area. Beginning with Greece at the end of 2009, the public debt crisis led to Greece's withdrawal from the international bond market and put the public debt securities of other EMU countries, particularly Ireland, Portugal and Spain, under immense pressure.
Although, the level factor correlations between Portugal and Spain showed relative stability over all period, significant fluctuations of curvature factor correlations related to the events above were observed.
The work developed in this paper aimed to analyse two issues: the predictive ability of the term structure of interest rates dynamic model of Nelson and Siegel proposed by Diebold and Li (2006) and the correlation between the latent factors of the term structure of interest rates of Portugal and Spain.
For this purpose, we start by analysing the adjustment ability of the Nelson and Siegel dynamic model, considering data on public debt interest rates of the two Iberian countries, Spain and Portugal. The model's ability to adjust to the observed data based on AR (1) and VAR (1) specifications was tested and results showed that both models present adequate and robust performance. Under conditions of low volatility, all models have a high degree of adherence to the data, however, their performance is reduced considerably in periods of high market volatility. None of the models presented was clearly superior to all others for both countries.
Next was analysed the predictive ability of the dynamic models of the yield curve, using either latent factor specifications or specifications that combine latent factors with macroeconomic data. A first order autoregressive specification, AR (1), and a multivariate specification of first order autoregressive vectors, VAR (1), were considered for the modelling of the factor dynamics, both models being compared with a random walk (RW).
Results prove that for the both countries under study, for the periods considered and for the dynamics specifications of the mentioned factors, there is a superiority of the results obtained for the RW and VAR (1) models in relation to the AR (1) model, as state by Diebold and Li (2006) and other authors. The VAR (1) model performs well in terms of forecasting, but it is not systematically superior to that of the random walk model in all maturities. The inclusion of macroeconomic variables representative of inflation and the annual variation of the industrial production index makes a positive contribution to the improvement of forecasts for both countries, for all maturities and for all forecast horizons. Even if, in many cases, the random walk model continues to have superior forecasting capacity, the VAR model (1) considering these two macroeconomic factors, performs relatively better.
Considering the existence of a strong correlation between the term structure factors and fundamental macroeconomic variables internal to two countries, Portugal and Spain, it is expected that events observed in this period have been reflected in a similar way in the two bond markets. In order to analyse the behaviour of the factors that determine the dynamics of the term structure of interest rates in Portugal and Spain, we attempt to explore the dynamic correlations between level, slope and curvature using the Engle (2002) dynamic conditional correlation model, DCC-GARCH. Results show a strong correlation between the level factor for two countries under study. Correlations remain relatively stable, high and positive in the period under review. Contrary to that observed for the level factor, the estimated correlations for the slope factor and for the curvature factor are much less persistent, with large amplitude oscillations and a different signal. The different behaviour observed between the components of the term structure of interest rates reflects the different reaction of these components to the events observed in that period.
ANG, A., PIAZZESI, M., 2003. A no-arbitrage vector autoregression of term structure dynamics with macroeconomic and latent variables. Journal of Monetary Economics 50, 745-787.
ANG, A., PIAZZESI, M., WEI, M., 2006. What does the yield curve tell us about GDP growth?. Journal of Econometrics 131(1-2), 359-403.
ANTONAKAKIS, N., 2012. Dynamic Correlations of Sovereign Bond Yield Spreads in the Euro zone and the Role of Credit Rating Agencies' Downgrades. MPRA Paper Germany, University Library of Munich.
BIKBOV, R., CHERNOV, M., 2013. Monetary policy regimes and the term structure of interest rates. Journal of Econometrics 174, 27-43.
BOLLERSLEV, T., 1990. Modelling the coherence in short-run nominal exchange rates: A multivariate generalized ARCH approach, Review of Economic and Statistics 72, 498-505.
CARLETON, W., COOPER, I., 1976. Estimation and uses of the term structure of interest rates. Journal of Finance 31(49), 1067-1083.
CARRIERO, A., 2011. Forecasting the yield curve using priors from no-arbitrage affine term structure models. International Economic Review 52, 425-459.
CHRISTENSEN, J., DIEBOLD, F., RUDEBUSCH, G., 2011. The affine arbitrage-free class of Nelson-Siegel term structure models. Journal of Econometrics 164; 4-20.
CORONEO, L., GIANNONE, D., MODUGNO, M., 2016. Unspanned macroeconomic factors in the yield curve. Journal of Business & Economic Statistics 34(3), 472-485.
COX, J., INGERSOLL, J., ROSS, S., 1985. A theory of the term structure of interest rates. Econometrica 53(2), 385-407.
DAI, Q., SINGLETON, K., 2000. Specification analysis of affine term structure models, Journal of Finance 55(5), 1943-1978.
DE POOTER, M., RAVAZZOLO, F., VAN DIJK, D., 2010. Term structure forecasting using macro factors and forecast combination. International Finance Discussion Papers, 933. Norges Bank.
DIEBOLD, F., LI, C., 2006. Forecasting the term structure of government bond yields. Journal of Econometrics 130(2), 337-364.
DIEBOLD, F., RUDEBUSCH, G., ARUOBA, S., 2006. The macroeconomy and the yield curve, a dynamic latent factor approach. Journal of Econometrics 131(1/2), 309-338.
DRIESSEN, J., MELENBERG, B., NIGMAN, T., 2003. Common factors in international bond returns. Journal of International Money and Finance 22, 629–656.
DUFFEE, G., 2002. Term premia and interest rate forecasts in affine models. Journal of Finance 57, 405-443.
DUFFEE, G., 2007. Are variations in term premia related to the macroeconomy?. Working papers series. Johns Hopkins University.
DUFFEE, D., KAN, R., 1996. A yield factor model of interest rates. Mathematical Finance 6, 379-406.
ENGLE, R., 2002. Dynamic conditional correlation: A simple class of multivariate GARCH models, Journal of Business and Economic Statistics 20, 339–350.
ENGSTED, T., TANGGAARD, C., (2005. The Comovement of US and German bond markets. V Working Paper, The Aarhus School of Business.
FAVERO, C., NIU, L., SALA, L., 2012. Term structure forecasting, No-arbitrage restrictions versus large information set. Journal of Forecasting 31, 124-156.
HAFER, R., KUTAN, A., ZHOU, S., 1997. Linkage in EMS term structure: evidence from common trends and transitory components. Journal of International Money and Finance 16, 595–607.
ILMANEN, A., 1995. Time-varying Expected Returns in International Bond Markets.
Journal of Finance 50, 481-506.
KAYA, H., 2012. Forecasting the yield curve and the role of macroeconomic information in Turkey, Economic Modelling 33, 1-7.
KIM, D., WRIGHT, J., 2005. An arbitrage-free three-factor term structure model and the recent behavior of long-term yields and distant-horizon forward rates. Finance and Economics Discussion Series, 33, Board of Governors of the Federal Reserve System U.S..
MCCULLOCH, J., 1971. Measuring the term structure of interest rates. Journal of Business 44, 19-31.
MCCULLOCH, J., 1975. The tax-adjusted yield curve. Journal of Finance 30 (3), 811-830.
MERTON, R., 1973. An intertemporal capital asset pricing model. Econometrica 41(5), 867-887.
MOENCH, E., 2008. Forecasting the yield curve in a data-rich environment, a no-arbitrage factor-augmented VAR approach. Journal of Econometrics 146, 26-43.
MORALES, M., 2010. The real yield curve and macroeconomic factors in the Chilean economy. Applied Economics 42, 3533-3545.
NELSON, C., SIEGEL, A., 1987. Parsimonious modeling of yield curves. Journal of Business 60(4), 473-489.
PACCAGNINI, A., 2016. The macroeconomic determinants of the US term structure during the Great Moderation. Economic Modelling 52, 216–225.
RUBASZEK, M., 2016. Forecasting the yield curve with macroeconomic variables. Econometric Research in Finance 1(1), 1 – 21.
RUDEBUSCH, G., WU, T., 2008. A macro-finance model of the term structure, monetary policy and the economy. The Economic Journal 118, 906-926.
SVENSSON, L., 1994. Estimating and interpreting forward interest rates, Sweden 1992-1994. National Bureau of Economic Research, 4871.
TAM, C., YU, I., 2008. Modelling sovereign bond yield curves of the US, Japan and Germany. International Journal of Finance and Economics 13, 82–91.
VASICEK, O., 1977. An equilibrium characterization of the term structure. Journal of Financial Economics 5(2), 177-188.
VASICEK, O., FONG, H., 1982. Term structure modeling using exponential splines. Journal of Finance 37(2), 339-348.
VIEIRA, F., CHAGUE, F., FERNANDES, M., 2017. A dynamic Nelson-Siegel model with forward-looking indicators for the yield curve in the US. Working Paper Series- Escola de Economia de São Paulo da Fundação Getúlio Vargas, 445, CEQEF nº 32.
1. Assistant Professor of Portucalense University. REMIT – Portucalense University and GOVCOPP – University of Aveiro, Portugal. ianm@upt.pt
2. Associate Professor of University of Aveiro. GOVCOPP – University of Aveiro, Portugal. cpinho@ua.pt
3. Full Professor of University of Vigo, Spain. fprado@uvigo.es
4. Assistant Professor of Portucalense University. REMIT – Portucalense University, IJP – Portucalense University, and GOVCOPP – University of Aveiro, Portugal. cadsa@upt.pt