![]() ISSN 0798 1015
ISSN 0798 1015

![]() ISSN 0798 1015
ISSN 0798 1015
Vol. 39 (Number 41) Year 2018 • Page 17
Aslan B. TASMAGANBETOV 1; Botakoz Zh. BOLATOVA 2; Каnаt Ye. АGLESHOV 3; Samal Zh. ТАSMAGANBETOVA 4; Anar YESSENGELDINA 5; Azamat ZHANSEITOV 6
Received:24/04/2018 • Approved: 10/06/2018
2. Theoretical framework and empirical literature
3. Description of the data collection
ABSTRACT: This paper investigates relationship between stock market development and economic growth by taking into consideration 30 low income and 30 middle/high income group countries. For the study, OSL regression is chosen to identify the link between variables. Authors use Stock market total value traded to GDP; Stock market capitalisation to GDP; Stock market turnover ratio as a proxy for stock market development and GDP growth rate as a proxy for economic growth. Authors also analyse results by dividing countries into two income groups and explain some reasons for outliers. |
RESUMEN: Este documento investiga la relación entre el desarrollo del mercado de valores y el crecimiento económico teniendo en cuenta 30 países de bajos ingresos y 30 de grupos de ingresos medios / altos. Para el estudio, se elige la regresión OSL para identificar el vínculo entre las variables. Los autores utilizan el valor total del mercado de valores negociado con el PIB; Capitalización bursátil al PIB; El índice de rotación del mercado de valores como proxy del desarrollo del mercado de valores y la tasa de crecimiento del PIB como proxy del crecimiento económico. Los autores también analizan los resultados dividiendo los países en dos grupos de ingresos y explican algunas razones de los valores atípicos. |

The role of stock market development in the progress of economic growth is not a new issue of debate; early work exists by Schumpeter (1911) and McKinnon (1973). The majority of research on the importance of the worldwide financial markets has identified the relationship between their development and economic growth, highlighting both positive and negative features.
Existing studies revolve around two specific questions: Is there any relationship between the expansion of an economy and equity market development? If there is, what is the form and nature of the relationship? Researchers hold different views on these questions. Some claim stock market development has a high positive correlation to economic growth (Pagano, 1993; Levine and Zervos, 1996; 1998; Rousseau and Wachel, 2000; Beck and Levine, 2004). Others believe that the stock market has an adverse effect on growth (Stiglitz, 1985; Bencivenga and Smith, 1991; Naceur and Ghazouani 2007). Furthermore, theorists of traditional growth claim that no link exists between the stock market and economic growth, with some claiming that using the stock market as an instrument could harm economic development because of its volatile nature. Meanwhile, other work supports governments in selecting the appropriate economic policy, and reshaping the financial sector to enhance development. For instance, Bahrain attempted to differentiate its economy in order to generate sources of income other than oil output.
To analyse the link between stock markets and economic growth, this study will take into consideration the income group of countries, and the variables required to reflect the situation of the stock market, and will include a brief review of literature on this topic. The third section will present the data consulted for this work, and an assessment and analysis of the results will follow in Section Four. The paper will end with concluding remarks.
Empirical literature regarding the financial market and economic growth has evolved progressively over time, witnessing the introduction of a series of new techniques to support various views about the role of the stock market in enhancing economic growth.
Gurley and Shaw (1955) were the first to investigate the link between stock markets and real economic performance. Their work examined the nature of financial systems development in both developed and less developed countries (LDCs). They concluded that developed countries’ financial systems are more innovative, and may themselves contribute to economic growth. This conclusion proposed the theory that more developed stock markets might extend a greater number of loans, or credit, to investors to support the growth of their projects.
Another positive relationship between stock markets and economic growth was tested by Atje and Jovanovic (1993), who presented cross-country research of 40 countries in the period 1980 to 1988, and discovered a high correlation between growth and stock market trading, when applying OLS regression to GDP. An almost identical cross-sectional analysis was conducted by King and Levine (1993). In their study of 77 countries in the period 1960 to 1989, a strong link was recorded between initial financial development, and stable growth. Furthermore, Levine and Zervos (1996) applied a pooled cross-country time series regression to 41 countries in the period 1979 to 1993, focussing primarily on the function of stock market development. The results demonstrated a high correlation between long-term economic growth, and stock market development. Findings from yet another work by Levine and Zervos (1998), studying 48 countries between 1976 and 1993, repeatedly demonstrated a statistically high relationship between stock market development, banking development, and sustainable economic growth. The research emphasized that this forecast growth.
Rousseau and Wachtel (2000), and Beck and Levine (2004) indicated that the stock market has a strong correlation with the growth rate of real GDP per capita. Their work discovered that the liquidity of the stock market is a primary stock market variable in justifying economic growth. Nevertheless, a majority of these works are adversely affected by differing statistical or econometric weaknesses. For example, Zhao (1999) did not examine the reverse nature of both variables, and his study of the relationship between stock returns and growth in China from 1993 to 1998, using OLS regression, discovered only that predicted economic growth has a notable influence on the returns of stock.
Filer, Hanousek and Campos (2000) analysed the bridge between the stock market and economic growth in 70 countries in the period 1985 to 1997 by applying the Grainger causality test. They discovered a little link between variables, notably for the lower income countries in the sample. Granger causality tests were employed by Carp (2011) in order to investigate the dynamic of the stock market, and the influence of the volatility of international capital inflows, using data for economic growth in Eastern and Central Europe from 2000 to 2007. The study does not demonstrate any impact on growth rates from market capitalization and stock value traded.
Ovat (2012) analysed the Nigerian financial market, using indicators such as stock market size, and stock market liquidity, and concluded that the latter has more impact on growth than market size. A similar study in Kuwait by Bentour (2014) demonstrated that market capitalisation has a significant positive effect on GDP. Wai Mun et al. (2008), studied the economy of Malaysia, and discovered that the stock market has no reverse causation on economic productivity.
Hondroyiannis, Lolos and Papapetrou (2005) provided an empirical assessment of the relationship between banking system development, the stock market, and economic productivity in the case of Greece. However, Azarmi, Lazar and Jeyapaul (2007) assessed the same connection in India in the period 1981 to 2001, by applying time series regression. They demonstrated that pre-liberalization was positively related, and post-liberalization time was negatively related, thereby presenting the Indian stock market in the form of a casino, unsupported by the growth of India.
Rioja and Valev (2014) analysed the impact of the stock market on economic growth in low and high income group countries by applying the dynamic panel Generalized method of moments. They identified that the stock market has no influence on capital accumulation, or growth, in low income group countries, but that it has a considerable positive impact on both capital and productivity growth in high income group countries.
As demonstrated above, while economic findings support a considerable positive connection between the stock market and economic growth, because the stock market is crucial in financing significant projects at a micro and a macro-level for economic development, the evidence of the studies differs from one market to another. The conclusion can therefore be drawn that a causative link between financial market and economic growth exists in some countries, but not in others.
In this study, cross-sectional data was used by consolidating the data for 60 countries. The countries selected are presented in Tables 2 and 3, and are listed by their respective name and income group. Instead of dividing countries equally by income group, i.e. 30 low and 30 high, five low income and 25 low middle income group countries were selected. For the 30 high income countries, 15 upper middle, and 15 high income group countries were used. The reason for this selection was the lack of data availability in the required period of 1970 to 2010. Only one average value is taken for each variable in the given time span.
GDP growth rate was taken as a dependent variable, and the stock market total value traded to GDP; stock market capitalisation to GDP; and stock market turnover ratio, were selected as explanatory variables. All variables in this research were taken from the World Bank (World Development Indicators). In order to measure the stock market development indicators, a set of variables was applied from the next methodologies adopted from King and Levine (1993); Levine and Zervos (1998); Levine, Loayza and Beck (2000); and Seetanah (2008). The variables are presented in Table 1, and are explained below:
Table 1
The variables taken for investigation
Variable |
Description |
Source |
GDP growth rate |
GDP growth rate (annual %) |
World Development Indicators, |
Stock to GDP |
Stock market total value traded to GDP (%) |
|
Capitalization to GDP |
Stock market capitalization to GDP (%) |
|
Stock market turnover ratio |
Stock market turnover ratio (%) |
GDP growth rate is defined as the economic growth measure, which is the annual percentage growth rate at market prices, based on constant local currency.
Stock market total value traded to GDP is one of the proxies for stock market development used in this research. It indicates the value of the total number of shares traded, both foreign and domestic, multiplied by their respective matching prices. Stock market total value traded to GDP measures the trading amount as a share of national income, and should therefore positively reflect the influence of liquidity on economic growth. Numbers are individually counted by taking into consideration only one side of transactions. Companies permitted to list, and to trade, are included in the proxy. The data is provided in end-of-year terms.
Stock market capitalisation to GDP is known as ‘market value’, and measures the size of the stock market. It equates to the share price multiplied by the number of shares (including their range of classes) for listed domestic companies. Investment funds, unit trusts, and companies whose only business goal is to retain the shares of other listed companies, are excluded. Proxies are given in terms of end-of-year.
Stock market turnover ratio is the value of domestic shares divided by their capitalization of market. The indicator is annualized by multiplying 12 by the monthly average. It is also an indirect measure of theoretical definitions of liquidity, with high turnover usually applied as a low transaction costs indicator.
Table 2
Correlation coefficients between GDP growth rate (annual %), Stock market total
value traded to GDP (%), Stock market capitalization to GDP (%) and Stock
market turnover ratio (%) in Low/ Lower middle income and Upper middle/
High income group countries
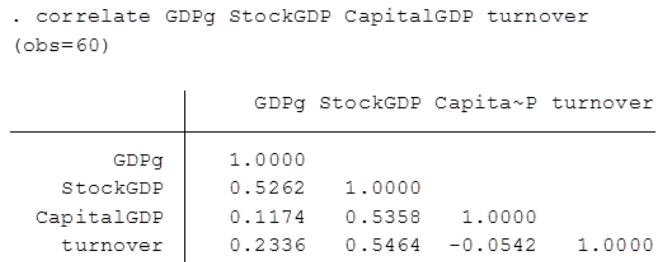
Source: authors’ calculation
Depicting the first step of the analysis, Table 2 demonstrates a noticeable positive correlation between financial market indicators and economic growth variables in the 60 low and high income countries in the period studied. Despite a differentiation in the income groups, the variables have a positive correlation. There is a strong relationship between GDP growth rate and the stock market total value traded to GDP, which indicates 0.53. Stock market capitalisation to GDP (0.12), and stock market turnover ratio (0.23), are weakly related to economic growth in 60 countries with mixed income groups.
In the second step of this empirical analysis, the relationship between economic growth and stock market indicators was examined by separating the income groups in two categories: low and high. The low income group include five low income, and 25 lower middle income countries, which are presented in Table 3.
Table 3
The list of selected countries and data for variables (Low/Lower middle income)
# |
Code |
Income group |
Country |
GDP growth rate |
Stock to GDP |
Capitalization to GDP |
Stock market turnover ratio |
1 |
NPL |
Low income |
Nepal |
3.923104606 |
0.731934375 |
15.35508575 |
4.9542935 |
2 |
TZA |
Low income |
Tanzania |
4.901982212 |
0.09533032 |
3.7848215 |
2.314672725 |
3 |
UGA |
Low income |
Uganda |
5.961484743 |
0.108173813 |
6.333921056 |
2.097400686 |
4 |
ZWE |
Low income |
Zimbabwe |
1.856522708 |
26.08438026 |
183.9703723 |
6.6442487 |
5 |
MWI |
Low income |
Malawi |
4.168455717 |
0.51388795 |
17.41132786 |
4.265743429 |
6 |
ARM |
Lower middle income |
Armenia |
2.935049433 |
0.027635644 |
0.85974272 |
4.820084267 |
7 |
BGD |
Lower middle income |
Bangladesh |
3.873938291 |
0.991863133 |
7.422240722 |
23.02961456 |
8 |
IND |
Lower middle income |
India |
5.412071189 |
26.85996365 |
41.89575145 |
104.0909841 |
9 |
BOL |
Lower middle income |
Bolivia |
2.849904199 |
0.119659093 |
12.36826836 |
1.017716567 |
10 |
ZMB |
Lower middle income |
Zambia |
2.982019578 |
0.141132459 |
12.07352236 |
1.617937414 |
11 |
SLV |
Lower middle income |
El Salvador |
2.186348082 |
0.405018136 |
15.968381 |
3.086101857 |
12 |
VNM |
Lower middle income |
Vietnam |
6.528554059 |
6.747982129 |
10.75096764 |
63.70144429 |
13 |
PAK |
Lower middle income |
Pakistan |
4.957686569 |
32.03415096 |
19.16803245 |
157.991371 |
14 |
TUN |
Lower middle income |
Tunisia |
5.005873246 |
1.410145905 |
11.29012195 |
11.85464873 |
15 |
UZB |
Lower middle income |
Uzbekistan |
3.606914352 |
0.196087143 |
0.68446999 |
64.1722697 |
16 |
MDA |
Lower middle income |
Moldova |
2.671151587 |
1.63083675 |
2.93790725 |
82.852771 |
17 |
MNG |
Lower middle income |
Mongolia |
3.834778492 |
0.46439925 |
4.225983688 |
13.01260356 |
18 |
MAR |
Lower middle income |
Morocco |
4.519343579 |
7.5781585 |
32.42928073 |
16.79615323 |
19 |
LKA |
Lower middle income |
Sri Lanka |
4.739979808 |
2.141506009 |
14.75616109 |
15.7108745 |
20 |
NGA |
Lower middle income |
Nigeria |
4.369939465 |
1.575149368 |
16.66918414 |
7.829565241 |
21 |
PHL |
Lower middle income |
Philippines |
3.847101751 |
9.254364048 |
44.00382273 |
23.04333136 |
22 |
KEN |
Lower middle income |
Kenya |
4.400020787 |
1.117334255 |
19.31448264 |
4.869498524 |
23 |
KGZ |
Lower middle income |
Kyrgyz Republic |
1.339016317 |
1.5594917 |
1.310397867 |
204.8547383 |
24 |
GTM |
Lower middle income |
Guatemala |
3.564286081 |
0.033966733 |
0.8549389 |
4.628171 |
25 |
EGY |
Lower middle income |
Egypt, Arab Rep. |
5.340930426 |
12.69586097 |
31.63158991 |
28.09927591 |
26 |
GHA |
Lower middle income |
Ghana |
3.38011173 |
0.412229933 |
10.14187158 |
5.351184222 |
27 |
IDN |
Lower middle income |
Indonesia |
6.038532982 |
8.311406082 |
22.148356 |
43.66334864 |
28 |
PSE |
Lower middle income |
West Bank and Gaza |
6.371626787 |
5.645356223 |
23.16380385 |
22.03235423 |
29 |
PNG |
Lower middle income |
Papua New Guinea |
3.266491233 |
0.30524756 |
122.3268922 |
0.270791478 |
30 |
SWZ |
Lower middle income |
Swaziland |
5.58665669 |
3.931563143 |
10.58638212 |
31.33646534 |
Source: authors’ calculation from The World Bank, 2016
The high income group involved 15 upper middle income, and 15 high income countries, as listed in Table 4.
Table 4
The list of selected countries and data for variables (Upper middle/High income)
# |
Code |
Income group |
Country |
GDP growth rate |
Stock to GDP |
Capitalization to GDP |
Stock market turnover ratio |
1 |
KAZ |
Upper middle income |
Kazakhstan |
2.49 |
1.721105608 |
15.52509323 |
11.32447992 |
2 |
FJI |
Upper middle income |
Fiji |
2.88730825 |
0.155066309 |
11.50987594 |
1.616238718 |
3 |
ARG |
Upper middle income |
Argentina |
2.524089605 |
4.113716058 |
9.583287112 |
49.35699147 |
4 |
MEX |
Upper middle income |
Mexico |
3.58435694 |
5.609551436 |
15.84496358 |
82.09354394 |
5 |
MYS |
Upper middle income |
Malaysia |
6.438098031 |
27.12151419 |
124.884737 |
23.257375 |
6 |
PER |
Upper middle income |
Peru |
3.155872418 |
3.367196005 |
24.77182152 |
19.90384338 |
7 |
BWA |
Upper middle income |
Botswana |
9.013473896 |
0.803934679 |
20.89867589 |
5.760236211 |
8 |
BRA |
Upper middle income |
Brazil |
4.264276163 |
10.38781183 |
31.34471591 |
71.96072955 |
9 |
BGR |
Upper middle income |
Bulgaria |
2.049046957 |
1.690778217 |
8.657626189 |
25.58816776 |
10 |
CHN |
Upper middle income |
China |
9.40739795 |
43.58322763 |
30.91079311 |
158.9852905 |
11 |
COL |
Upper middle income |
Colombia |
4.050516507 |
2.250462439 |
20.44768218 |
11.02058627 |
12 |
CRI |
Upper middle income |
Costa Rica |
4.448594492 |
0.3515343 |
7.933677235 |
5.929600313 |
13 |
SRB |
Upper middle income |
Serbia |
3.492881431 |
1.781627893 |
29.01833713 |
14.40786225 |
14 |
THA |
Upper middle income |
Thailand |
6.113840617 |
26.65731432 |
50.36242909 |
76.32414005 |
15 |
GEO |
Upper middle income |
Georgia |
1.482063199 |
0.279257545 |
4.917451591 |
7.150443391 |
16 |
LVA |
High income |
Latvia |
4.467754202 |
0.884015944 |
7.5601802 |
14.60339933 |
17 |
EST |
High income |
Estonia |
4.438427079 |
6.545504846 |
25.31007 |
28.24580462 |
18 |
KOR |
High income |
Korea, Rep. |
7.598016165 |
55.55654678 |
35.63015184 |
141.8909719 |
19 |
BHR |
High income |
Bahrain |
4.23183913 |
4.481606786 |
94.5735275 |
5.028291667 |
20 |
BRB |
High income |
Barbados |
1.078941007 |
4.05255666 |
66.910691 |
4.56246949 |
21 |
BMU |
High income |
Bermuda |
2.451076581 |
2.530236313 |
47.41738091 |
4.855328273 |
22 |
HUN |
High income |
Hungary |
1.92284279 |
14.42876267 |
19.02297453 |
65.84297084 |
23 |
MLT |
High income |
Malta |
5.32514248 |
1.422891644 |
38.91380475 |
6.128637244 |
24 |
URY |
High income |
Uruguay |
2.455288192 |
0.014754438 |
1.234974171 |
2.755166108 |
25 |
CYM |
High income |
Cayman Islands |
5.305202786 |
0.0492667 |
4.926673 |
0.9999999 |
26 |
HRV |
High income |
Croatia |
2.840129704 |
1.760609694 |
28.26486938 |
7.471407938 |
27 |
OMN |
High income |
Oman |
6.012466753 |
7.736140588 |
30.50223471 |
24.14069312 |
28 |
SGP |
High income |
Singapore |
7.651063736 |
68.45479 |
144.3924491 |
47.36585616 |
29 |
SVN |
High income |
Slovenia |
3.244459447 |
2.733010063 |
19.83737994 |
24.16274081 |
30 |
ARE |
High income |
United Arab Emirates |
5.085970333 |
12.89583335 |
40.484315 |
29.47036325 |
Source: authors’ calculation from The World Bank, 2016
The following analysis provides explanations for both overall trends, and the outliers in each income group, by presenting appropriate examples.
The study of the 30 countries in the low income group illustrates different results in terms of correlation than in the mixed income countries. The GDP growth rate of low and lower middle income countries has little, and negative, correlation with respect to financial market indicators. Stock market value traded to GDP correlates 0.18 with economic growth, when stock capitalisation to GDP, and stock market turnover ratio, has a minus correlation of -0.23 and -0.07 respectively. These coefficients are listed in Table 5.
Table 5
Correlation coefficients between GDP growth rate (annual %), Stock market total
value traded to GDP (%), Stock market capitalization to GDP (%) and Stock market
turnover ratio (%) in Low/ Lower middle income group countries
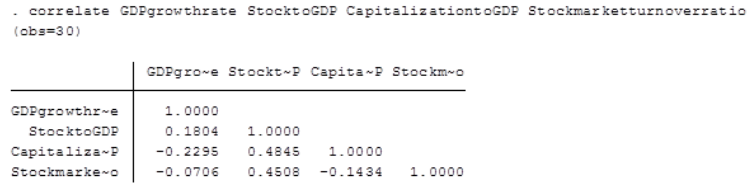
Source: authors’ calculation
The results in Figure 1.1 support a small positive effect of stock market total value traded to GDP on economic growth.
Figure 1.1
Scatterplot between GDP growth rate (annual %) and Stock market total
value traded to GDP (%) in Low/ Lower middle income group countries
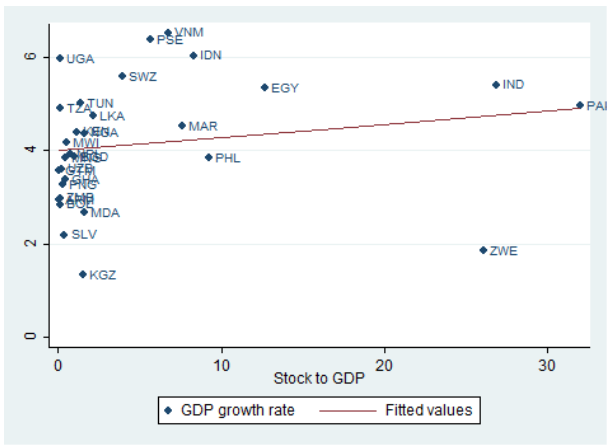
Source: authors’ construction
This is true for most low and lower middle income countries in the scatterplot presented. However, some outliers exist, such as Uganda; the West Bank and Gaza; Vietnam; El Salvador; the Kyrgyz Republic; and Zimbabwe.
The scatterplot in Figure 1.2 captures the negative relationship between GDP growth rate and stock market capitalisation to GDP for the given list of countries.
Figure 1.2
Scatterplot between GDP growth rate (annual %) and Stock market
capitalization to GDP (%) in Low/ Lower middle income group countries
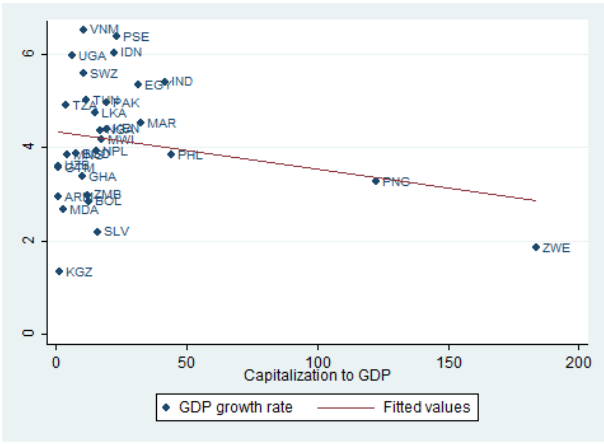
Source: authors’ construction
Many countries follow a downward trend, apart from Uganda; the West Bank and Gaza; Vietnam; Indonesia; El Salvador; the Kyrgyz Republic; and Zimbabwe.
Figure 1.3
Scatterplot between GDP growth rate (annual %) and Stock market
turnover ratio (%) in Low/ Lower middle income group countries
Source: authors’ construction
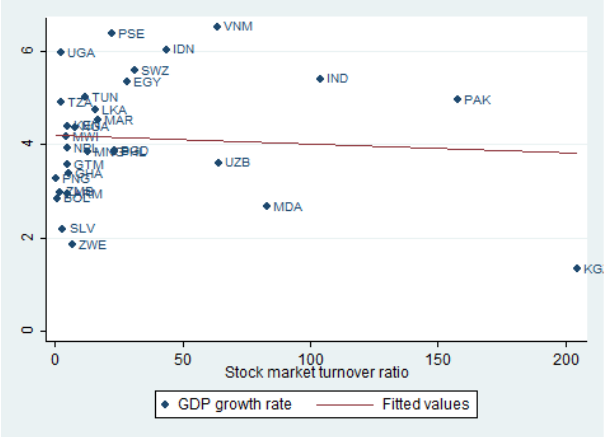
In Figure 1.3, the results of the correlation between economic growth and stock market turnover ratio among these countries projects a negative slope pattern. The same outliers exist as in Figure 1.2.
As many studies suggest, the stock markets of low income countries have an insignificant influence on growth, which can be explained by a lack of resources and financial instruments. For example, Rioja and Valev (2014) found that stock markets make no contribution to productivity growth, or capital accumulation, in low income countries. This is because the size and activity of equity markets in these countries have not achieved a stage where they are considerable determinants of growth. The authors also emphasized the key role of banks for low income group countries, because they have a sizable positive impact on capital accumulation. Overall, the findings of the analysis conducted as part of this paper support this view.
However, some outliers exist, notably Zimbabwe. In order to explain this, the research of Tichanova Zivengwa et al. (2011) was employed. The authors justified the case of Zimbabwe through investment, explaining that stock market size caused investment, which in turn resulted in real GDP per capita. Therefore, the size of the stock market attracts investment, and this situation has a considerable effect on real GDP per capita. The study also showed that the turnover of the stock market had no significant impact on real GDP per capita at the outset, and its power only became more apparent during later periods.
Another outlier in the relationship between the stock market and economic growth in low income countries is Vietnam. An explanation for this case derives from research by Nguyen Thi Phuong Nhung (2013), which used the error correction mechanism (ECM), and the Granger causality test, to clarify the connection. The author states that while the stock market of Vietnam is immature and underdeveloped, it has played a key role in financing and funding the support of the Vietnamese growth rate. Phan Nguyen Ngoc Xuan My and et al. (2016) provide a more detailed explanation for Vietnam being an outlier in low income countries, asserting that overconfidence has been justified as a crucial factor for the observed anomalies in the securities markets. The authors also found that a high amount of stock returns result on every occasion, because of the high trading volume, despite the measurement of trading value.
According to the results, it can be asserted that the stock market has a mainly negative effect on economic productivity in respect to low income group countries. This might be because an underdeveloped stock market exists in low income countries, which weakens the country’s economy. Nevertheless, stock market total value traded to GDP makes a minimal contribution to growth. Surprisingly, exceptions exist, such as Uganda; the West Bank and Gaza; Vietnam; El Salvador; the Kyrgyz Republic; and Zimbabwe, in which stock markets might contribute to the countries’ economic growth.
The research conducted on the 30 high income group countries demonstrates reverse correlation results when compared with the low income countries. The GDP growth rate of upper middle and high income countries has high positive correlation in regard to financial market indicators. Stock market value traded to GDP correlates 0.64 with economic growth, when stock capitalisation to GDP and stock market turnover ratio has correlation of 0.35 and 0.49, respectively. These indicators are listed in Table 6.
Table 6
Correlation coefficients between GDP growth rate (annual %), Stock market total
value traded to GDP (%), Stock market capitalization to GDP (%) and Stock
market turnover ratio (%) in Upper middle/ High income group countries
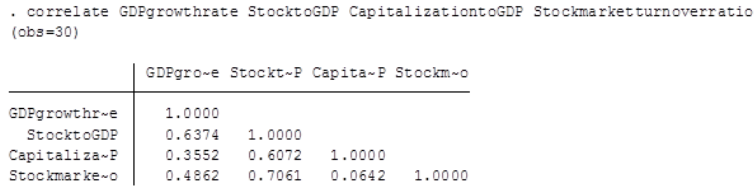
Source: authors’ calculation
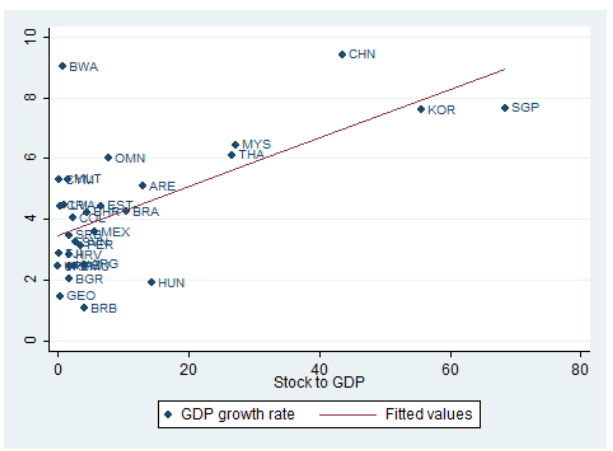
In the results in Figure 2.1, the scatterplot demonstrates an overall positive pattern between GDP growth rate and stock market total value traded to GDP, with some exceptions among upper middle and high income group countries, such as Botswana; Singapore; Malaysia; Georgia; Barbados; Bulgaria; Argentina; Hungary; and Mexico.
Figure 2.1
Scatterplot between GDP growth rate (annual %) and Stock market total
value traded to GDP (%) in Upper middle/ High income group countries
Source: authors’ construction
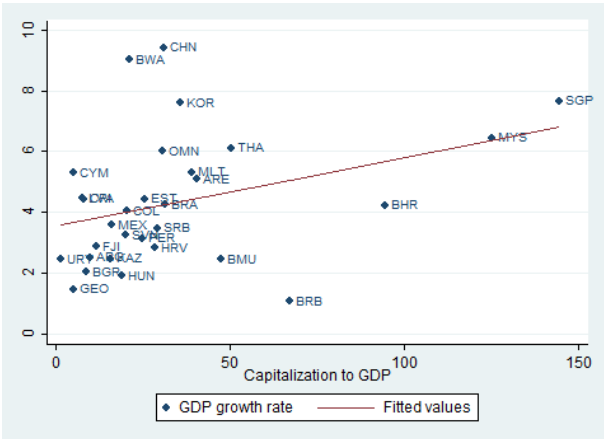
In Figure 2.2, the high positive trend demonstrated between GDP growth rate and stock market capitalisation has fewer outliers than in Figure 2.1.
Figure 2.2
Scatterplot between GDP growth rate (annual %) and Stock market capitalization
to GDP (%) in Upper middle/ High income group countries
Source: authors’ construction
These are Botswana; China; Georgia; Barbados; and Hungary. The scatterplot in Figure 2.3 illustrates largely the same positive results between GDP growth rate and stock market turnover ratio. Nevertheless, a number of exceptions exist, such as Botswana; China; the Korean Republic; Georgia; and Barbados.
Figure 2.3
Scatterplot between GDP growth rate (annual %) and Stock market
turnover ratio (%) in Upper middle/ High income group countries
Source: authors’ construction
This study reaffirms the conclusion of Rioja and Valev (2014) that the stock market has a significant positive impact on productivity growth in high income group countries. Therefore, the economies of these countries can reap some benefit from the stock market, and potentially replace their source of income. However, groups of outliers frequently appear, such as Hungary; Botswana; China; and Barbados. Because of the inadequacy of the source material, the following paragraphs provide explanations for Hungary and China alone.
A common feature of stock market evolution in many developing, and in some transitional economies, is that further stock market development is desirable, specifically in terms of empirical evidence supporting the development of the stock market as positively linked to future growth (Levine and Zervos, 1998; Beck et al., 2001). Nevertheless, certain factors contribute to a constraint in the stock market size in Hungary. Specifically, firms of FDI, which represent a significant proportion of the domestic GDP share, are catalogued at foreign stock markets. Consequently, a considerable increase in the capitalisation of the stock market in Hungary might be taken from only the entry of small or medium sized firms. However, since almost all of these are very small, and represent high risk, they are unlikely to attract investors. It has been indicated that the level of financial depth remains relatively low in Hungary (Colombo and Driffill, 2003).
Interestingly, China, one of the leading economies, appears as an outlier. Lei Pan and Vinod Mishra (2016) justified this through empirical research, arguing that the reason for the minimal impact is possibly the fact that China is huge country, and the stock market still constitutes only a small amount of the full economy, and is therefore inadequate to have an influential impact on the overall economy of the country. The authors explained the negative link between the stock market and economic growth via stock market as a tool for the Chinese state to reach its specific aim, rather than to reflect growth. Moreover, apparent evidence of a lack of rational thriving on the A share markets could result in financial bubbles. The authors’ empirical evidence finds no proof to support this form of association between the financial sector of China, and the real sector, in respect of the short-term relationship.
There are some middle/high income group countries which have small contribution to economic growth in terms of stock market development. Because these emerging countries have only started to build their competency by involving some innovations. Kazakhstan, for instance, might be exemplary in this regard. As Yessengeldin et al. (2016) conclude in that Kazakhstan’s economic growth can be targeted on the basis of innovations with proper usage of new scientific and technological progress.
With respect to the results, it can be assumed that the stock market has a strong positive influence on economic growth in terms of high income group countries. This could be because, in high income countries, a sufficiently advanced level of stock market exists to affect the country’s economy, and even to replace some sources of income. Nevertheless, exceptions exist, such as Hungary; Botswana; China; and Barbados, whose stock markets are likely to be too weak to contribute to their economic growth.
This research paper studied the impact of stock markets on productivity growth among 60 low and high income group countries. Overall, the results demonstrated a small positive trend in the relationship of the taken variables. The most significant contribution occurred when low and high income group countries were investigated separately.
In low and lower middle income countries, the stock markets had largely not contributed to economic growth, because the size and liquidity of equity markets in developing countries were not significant determinants of the growth source. However, some countries showed surprising results, despite falling in the low income group.
Conversely, in upper middle and high income group countries, the stock markets were mainly found to possess a positive sizable influence on growth. This supported the theory of Allen and Gale (1999), which presented stock markets as being essential in funding innovations that lead to the growth of productivity. The results provided in this paper emphasize a strong relationship between given variables, but also demonstrate some outliers among high income countries.
Allen, F. and Gale, D. (1999). Innovations in Financial Services, Relationships, and Risk Sharing. Management Science, 45(9), pp.1239-1253.
Atje, R. and Jovanovic, B. (1993). Stock Markets and Development. European Economic Review, 37, pp.632-640.
Azarmi, T., Lazar, D. and Jeyapaul, J. (2007). Is The Indian Stock Market A Casino? Journal of Business & Economics Research (JBER), 3(4).
Beck, T. and Levine, R. (2004). Stock Markets, Banks and Growth: Panel Evidence. Journal of Banking and Finance, 28, pp.423–442.
Bencivenga, V. and Smith, B. (1991). Financial Intermediation and Endogenous Growth. The Review of Economic Studies, 58(2), p.195.
Bentour, E. (2014). Stock markets and economic growth in oil exporting countries: evidence from Kuwait. International Journal of Development and Sustainability, 3(8), pp.1806-1813.
Carp, L. (2011). Can stock market development boost economic growth? Empirical evidence from emerging markets in Central and Eastern Europe. Procedia Economy and Finance, 3, pp.438–444.
Colombo, E. and Driffill, J. (2003). The role of financial markets in the transition process. 1st ed. Heidelberg: Physica-Verlag.
Filer, R., Hanousek, J. and Campos, N. (2000). Do stock markets promote economic growth? CERGE-EI Working Paper Series, p.151.
Gurley, J. and Shaw, E. (1955). Financial Intermediaries and the Saving-Investment Process. The Journal of Finance, 11(2), p.257.
Hondroyiannis, G., Lolos, S. and Papapetrou, E. (2005). Financial markets and economic growth in Greece, 1986–1999. Journal of International Financial Markets, Institutions and Money, 15(2), pp.173-188.
King, R. and Levine, R. (1993). Finance and Growth: Schumpeter Might Be Right. The Quarterly Journal of Economics, 108(3), pp.717-737.
Lei Pan and Vinod Mishra (2016). Stock Market Development and Economic Growth: Empirical Evidence from China. Monash Business, 5(32), pp.134-163.
Levine, R. and Zervos, S. (1996). Stock Market Development and Long-Run Growth. The World Bank Economic Review, 10(2), pp.323-339.
Levine, R. and Zervos, S. (1998). Capital control liberalization and stock market development. World Development, 26(7), pp.1169-1183.
Levine, R., Loayza, N. and Beck, T. (2000). Financial intermediation and growth: Causality and causes. Journal of Monetary Economics, 46(1), pp.31-77.
McKinnon, R. (1973). Inflation as a global problem. Journal of International Economics, 3(4), pp.397-398.
Naceur, S. and Ghazouani, S. (2007). Stock markets, banks, and economic growth: Empirical evidence from the MENA region. Research in International Business and Finance, 21(2), pp.297-315.
Nguyen Thi Phuong Nhung (2013). The case-effect relationship between economic growth and stock market development. The case of Vietnam. Economics and Commerce, 1(3), pp.17-42.
Ovat, O. (2012). Stock Market Development and Economic Growth in Nigeria: Market Size versus Liquidity. Canadian Social Science, 8(5), pp.65-70.
Pagano, M. (1993). Financial markets and growth. European Economic Review, 37(2-3), pp.613-622.
Phan Nguyen Ngoc Xuan My, Huynh Luu Duc Toan and Nguyen Thi Kim Cuong (2016). Empirical evaluation of overconfidence hypothesis among investors the evidence in Vietnam stock market. Foreign Trade, 4(46), pp.1-26.
Rioja, F. and Valev, N. (2014). Financial structure and capital investment. Applied Economics, 44(14), pp.1783-1793.
Rousseau, P. and Wachtel, P. (2000). Equity Markets and Growth: Cross-country Evidence on Timing and Outcomes: 1980–1995. Journal of Banking and Finance, 24, pp.1933– 1957.
Schumpeter, J. (1911). The Theory of Economic Development. Cambridge, MA, Harvard University Press.
Seetanah, B. (2008). ‘Financial development and economic growth in an ARDL approach. Applied Economics Letter, 4(43), pp.43‐50.
Stiglitz, J. (1985). Economics of information and the theory of economic development. Brazilian Review of Econometrics, 5(1), p.7.
Wai Mun, H., Kai Lin, T. and Kar Man, Y. (2008). FDI and Economic Growth Relationship: An Empirical Study on Malaysia. International Business Research, 1(2), pp.11-18.
Yessengeldin, B., Sitenko, D., Murzatayeva, G., Yessengeldina, A. (2016). Scientific potential as the basis of innovation development of Kazakhstan. International Journal of Economics and Financial Issues, 6(3).
Zhao, F. (1999). 2000: the open century. Futures, 31(9-10), pp.913-922.
Zivengwa, T., Mashika, J., Bokosi, F. and Makova, T. (2011). Stock Market Development and Economic Growth in Zimbabwe. International Journal of Economics and Finance, 3(5).
1. Candidate of Economic Sciences, Dean of the Faculty of economics and law, K. Zhubanov Aktobe Regional State University
2. PhD, Head of the Department of economics and management, Faculty of economics and law, K. Zhubanov Aktobe Regional State University
3. Candidate of Economic Sciences, Senior teacher of the Department of economics and management, Faculty of economics and law, K. Zhubanov Aktobe Regional State University
4. Master of management, Senior teacher of the Department of economics and management, Faculty of economics and law, K. Zhubanov Aktobe Regional State University
5. Candidate of Economic Sciences, associate professor, Academy of Public Administration under the President of the Republic of Kazakhstan
6. MSc Development Economics and Policy, The University of Manchester. e-mail: azamat.zhanseitov@icloud.com