![]() ISSN 0798 1015
ISSN 0798 1015

![]() ISSN 0798 1015
ISSN 0798 1015
Vol. 39 (Number 42) Year 2018 • Page 20
Ana ESTIMA 1; Carmina S. NUNES 2; Judite MANSO 3
Received: 24/04/2018 • Approved: 09/06/2018
ABSTRACT: The purpose of this paper is to present the real implementation of a Portuguese project in a Private Healthcare Institution, using a tool called Customer-Friendly Service (LAC), described in a previous paper. Through this case, the authors have tried to evaluate the existence of a dynamic between four attributes: Consumer Protection Law, store presentation, staff presentation and service elements evaluation. It provides an observation relating to the importance of tangible and intangible attributes in obtaining improvement in service quality. |
RESUMO: O objetivo deste trabalho é apresentar a implementação real de um projeto de português em uma Instituição de Saúde Particular, utilizando uma ferramenta chamada Serviço de Atendimento ao Cliente (LAC), descrita em um artigo anterior. Através deste caso, os autores tentaram avaliar a existência de uma dinâmica entre quatro atributos: Lei de Proteção ao Consumidor, apresentação de loja, apresentação de equipe e avaliação de elementos de serviço. Ele fornece uma observação relativa à importância dos atributos tangíveis e intangíveis na obtenção de melhoria na qualidade do serviço. |

The structure of the present paper is as follows: first, the authors discuss some of the key theoretical issues concerning service quality and healthcare described in the specialized literature; then, focusing on the case study, they analyse the different phases of the LAC process’s audit evaluation. Following that analysis, they discuss and interpret the data, putting forward an adequate model for this specific case. The authors then conclude by describing the PHI LAC certification process, identifying the tangible and intangible attributes and specifying how the model helped them correct the problems found. Regarding the tangible attributes, after presenting and implementing a solution targeting issues pointed out in the initial diagnosis, researchers found that it was possible to maintain a high and stable level of quality that required only occasional adjustments. Intangible attributes, on the other hand, because they rely on people’s attitudes, were more difficult to maintain on the long term. As a future research direction, the authors intend to present the LAC model as an innovative model of quality of service and demonstrate its flexibility and universality by providing real examples of its commercial application to different services, such as public service, driving schools, medical clinics, retail, among others.
According to Wiele, Hesselink, & Iwaarden (2005), customer focus is the basic element of quality management. In the last two decades, quality management has prioritized the importance of customer satisfaction. Moving beyond the development of internal quality systems, the current trend in quality management is to measure the quality of relationships by looking outside an organization and focusing on its external stakeholders. In their opinion, this is the only way to strengthen the relationship with the customer and thus compete in the various sectors of the business (Gummesson, 1998).
The ISO 9000: 2000 standard included a more customer-oriented regulation of a standard of service. However, what happens in practice is a simple collection of data using surveys dealing with customer satisfaction, which are rarely used for the improvement of the organization (Wiele et al. 2005).
According to Shaw & Ivens (2002), there are seven theories that help us understand what customers perceive as being excellent service quality experiences: the recognition that excellence in customer experience is the source of long-term competitive advantage; great customers experiences are built on the basis of exceeding their physical and emotional expectations; they are different from each other, and therefore there should be a force majeure to provide planned emotions; it is possible to meet customers’ expectations through inspiring leadership, promoted by a culture of empathic and happy people; the assumptions are designed outside in, and not inside out; they generate revenues and can mean cost savings; and finally, great experiences are a template for the brand. Smith & Wheeler (2002) point out that service quality goes beyond simply providing an excellent customer service, focused on a single moment. Therefore, if satisfied, the customer becomes a brand advocate.
One of the most used scales for measuring service quality is SERVQUAL, which seeks to measure service delivery through five dimensions: Empathy, Tangibility, Competence, Reliability, and Security (Parasuraman, Zeithaml & Berry, 1988; 2002). This model tries to evaluate both the expectations of the customers and the final service perception.
Another model used is the SERVPERF, developed by Cronin & Taylor (1992), which mostly aims at gauging the perception of service performance. This model is based on the belief that perceived quality is conceptualized as the customer’s attitude towards quality dimensions. Therefore, it cannot be measured based on the differences between expectations and performance.
Regardless of the scales used and their ever wider application, it seems there is a growing interest surrounding the question of quality of service within organizations, being that the changes taking place can be seen as a journey to be made and not as a destination (Talib, Rahman & Qureshi, 2012). As a result, there are relevant examples in the literature about the importance of the application of evaluation scales and the development of new models of total quality management, especially in the context of services (Gilmore & Carson, 1993). These models standardize procedures and can intervene in the real problems of organizations, creating a paradigm of service science that can help create value for organizations (Gumesson, 2014).
Healthcare is considered to be a distinct, compound and multidimensional area in which the elements of process service quality play an important role (James, Calderon & Cook, 2017). This is mostly due to the fact that it includes an emotional component, but also because service quality is directly connected with customer satisfaction, although little is known about its impact (Kitapci, Akdoganb & Dortyolb, 2014).
One of the biggest challenges regarding healthcare service quality from the customer’s point of view is to develop actions and models that can improve perceived service quality (Cleary & Edgman-Levitan, 1997). For instance, the SERVQUAL model is the only model designed to specifically measure service quality and customer satisfaction in healthcare (Chakraborty & Majumdar, 2011). Recently, in an attempt to improve quality evaluation, some pilot studies were carried out in health service in Europe (Katsarava et al., 2015). Other studies aimed at validating and adapting existing health quality service scales to other markets, including a Brazilian Portuguese version of the instrument (Rocha et al., 2013).
Regardless, the biggest challenge is the need to further investigate the influences of customization on customer satisfaction and faithfulness through service quality as argued by Kasiria, et al. (2017). Based on a questionnaire including data from the healthcare industry, Meesalaa and Paul (2016) used patient satisfaction and loyalty as variables to be connected to health service quality. In addition to this study, Lillrank (2015) also mentioned a conceptual healthcare quality model based on three healthcare quality types: patient experience, patient safety and clinical decision-making. However, according to Zeithmal (1981), because it is a highly technical and specialized field that requires knowledge and experience, it is very difficult for customers to measure service quality in healthcare. The aim of this research is to refer to service quality healthcare from the customers’ point of view and their expectations, by achieving a consistent value.
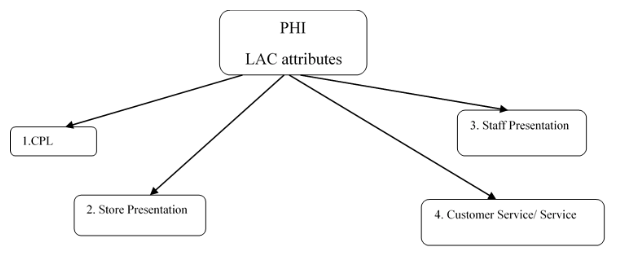
The evaluation method described in this paper is based on the "Mystery Shopping" approach. This provides an interesting perspective, seeing that a regular customer assesses how a service is operated according to his or her expectations. This assessment consists of 19 items that can be divided into the following four main attributes: Consumer Protection Law (CPL), store presentation, staff presentation and service elements evaluation. These elements are crucial in obtaining LAC certification and outlining the major changes brought about by the intervention.
The CPL attribute evaluated the following elements:
a) compliance with CPL: the service must conform to existing regulations;
b) avoiding misleading advertising: the product/service prices advertised in the media, including brochures, outdoor advertising, and etc., should match the prices displayed in stores;
c) payment methods: accepted payment methods, such as debit and credit cards, as well as post-dated checks, should be clearly displayed and visible to customers;
d) exchange or return policy: the store must respect the exchange and return rules defined by the CPL;
e) complaint management policy: the existence of a complaint book.
Store presentation or space analysis:
a) maintenance and cleaning: storage conditions and cleanliness of the space (such as painting, furniture, flooring and hygiene, depending on the area of business) will be evaluated;
b) organization: how space is organized, including the adequacy of preparation area(s) for customer service, waiting spaces, and the existence of interior and exterior signs and signalling panels, etc.;
c) ambiance, lighting, temperature and sound: lighting conditions (i.e. if the place is too dark or too bright) and temperature (whether it is pleasant for the customer or suitable for the product or service) will be evaluated, as well as the existence of background music and whether it harms customers or undermines communication;
d) visual image: if the visual aspect and atmosphere suit the business style.
Staff presentation:
a) staff’s image: clothes, makeup, grooming, etc.;
b) Clothing: checking if the clothing being worn by the contact person is compatible with the type of store; use of uniform (when applicable), and its state: cleanliness and appearance;
c) body language: if the staff member has a proper posture, or sits or leans on the counter, smokes outside the store, etc.;
d) identification: if staff members use some form of identification.
Service elements evaluation:
a) waiting time: waiting time (whether customers are served immediately or are left waiting); the way simultaneous calls are managed, etc.;
b) host: the way customers are welcomed will be evaluated, as well as the approach followed (i.e. if the staff member was aggressive or inappropriate, or friendly and well-mannered);
c) agility in service delivery: the service will be evaluated;
d) politeness and courtesy: the use of the customer's name and of courtesy expressions will be evaluated;
e) proper use of the Portuguese language: language problems or mistakes will be awarded negative points in the analysis;
f) appropriate response to requests: inadequate or impatient answers will be scored negatively;
g) offering alternative products and prices: posture aiming to meet customer needs by offering alternative products, services or prices will be evaluated;
h) proactivity in sales: proactivity in sales will be evaluated, i.e. is it appropriate and customer-focused (Estima, Manso & Nunes, 2017, p. 37).
Figure 1
LAC attributes
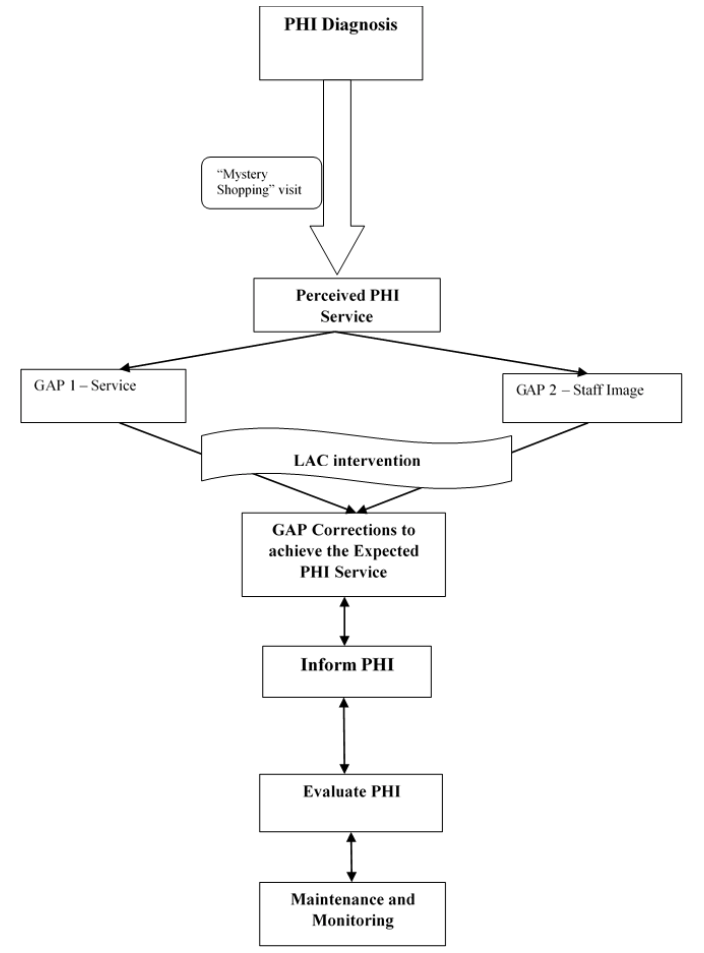
The accession process to LAC certification is characterized by the following phases: diagnosis, gap correction, information, evaluation, and maintenance monitoring.
The example described in this article is based on the actual implementation of the model in a PHI. Rather than presenting the details pertaining to the customer’s accession process, researchers put forward the different stages of the LAC’s accession process and demonstrate the practical implementation of each phase, with some examples of the PHI process. Thus, after identifying the stages of the LAC accession process, they describe the objectives of each stage, the methodology used, the evidence resulting from that moment and the PHI case study.
The accession process to LAC certification is characterized by the following phases: diagnosis, gap correction, information, evaluation, and maintenance monitoring.
3.2.2.1 Phase 1 – Diagnosis
Objective |
To identify and characterize the customer-service process and evaluate the relevance of LAC within the organization. |
Methodology |
"Mystery Shopping" visit. |
Evidence |
Diagnosis report: identification of gaps and improvement suggestions. If the identified gaps undermine the certification (final evaluation score under 800 points), the organization must correct them within 90 days. The organization is autonomous in choosing and implementing solutions. |
PHI case
|
The PHI did not get the minimum score to be awarded the LAC certification at this stage. After receiving the report and identifying the gaps, the PHI requested help to overcome them. Here are 2 examples of identified gaps: GAP 1) Service The non-medical professionals circulate through the halls with frowned facial expressions, showing no sign of availability. It's hard to find someone who looks at us and smiles. Very few friendly people and not available at all. At the reception counter, staff members are nicer. . GAP 2) No identification of non-medical professionals: There is a uniform, that none of the 13 elements of the PHI non-medical team wears. They do not carry any kind of identification. |
---
3.2.2.2 Phase 2 – Gap Corrections
Objective |
To rectify the gaps identified in Phase 1 (when found). |
Methodology |
Meeting with the person responsible for the area organization. |
Evidence |
Intervention proposal. |
PHI case
|
In this specific case, the PHI asked the researchers for help in rectifying the identified gaps and accepted their proposals. The changes were implemented within 3 months: GAP 1) Service The creation and implementation of a service manual. Training. GAP 2) Image (of the professionals) Reintroduction of the use of uniform and introduction of an identification plate for every member of the non-medical team. |
---
3.2.2.3 Phase 3 – Information/Feedback
Objective |
To understand and evaluate the implementation level of the changes and give feedback to the whole team; to engage and motivate the team to facilitate change. |
Methodology |
“Mystery Shopping” visit (if the client has gone through Phase 2). If not (when gaps are still not rectified), Phase 3 boils down to:
|
Evidence |
Information Report: report delivered to the client indicating the status of the project and the provisional opinion based on the evidence of compliance with LAC conditions and the recommendations and/or suggestions that apply. |
PHI case
|
At this stage, there was a mystery visit to ascertain the progress level of the implementation. Based on the retrieved data, training was prepared. |
“Mystery Shopping” visit |
GAP 1 - Service The service protocol was being followed; the whole team welcomed customers in the same way. As to friendliness, it should be reinforced. GAP 2 - Image (staff presentation) Most staff members offered some resistance to the idea of wearing an uniform. The uniform consists of a suit (skirt or trousers and a dark blue blazer) and red neckerchief (PHI’s colors). Most staff members did not use the neckerchief, a key identification element. |
Classroom training |
To unveil the results of the mystery visit and raise awareness for the importance of doing well; To demonstrate the consequences of not following procedure, by showing examples; To inform and congratulate the team for the project’s development; To ask for suggestions; To involve staff members in the decision-making process; To report LAC certification conditions. |
-----
3.2.2.4 Phase 4 – Evaluation
Objective |
To verify compliance with the LAC requirements |
Methodology |
“Mystery Shopping” audit In Phase 4, the accession process must be completed. If the organization has not obtained a minimum score in Phase 1; has failed to correct the gaps in Phase 2, and has not obtained a minimum score at this stage, it cannot apply for LAC certification for 1 year – period defined for the institution to rectify the gaps. |
Evidence |
Audit report, to be handed in to the client organization, identifying: - the improvements implemented after the Information Phase (Phase 3); - weaknesses and strengths, as well as suggestions for improvement. |
PHI case
|
In this phase, there was a mystery visit to evaluate the compliance level with the LAC requirements. The PHI obtained the maximum score. |
---
3.2.2.5 Phase 5 – Maintenance and Monitoring
Objective |
To maintain and monitor the certification, ensuring quality service. |
Methodology |
Two mystery audits, to be held during the year of the agreement, with a special focus on the measures implemented at the beginning of the process. A 4-hour face-to-face training session (classroom or workplace) A written test. |
Evidence |
Audit report, to be delivered to the client organization. |
HCPI case |
The LAC process is currently underway. |
-----
Figure 2
LAC Service Quality Model PHI case study
The data collected between 2012 and 2015 was as follows:
Attributes |
LAC 2012 |
LAC 2013 |
LAC 2014 |
LAC 2015 |
CPL |
100% |
100% |
100% |
100% |
Presentation of the Store |
100% |
100% |
100% |
100% |
Service elements evaluation |
100% |
75% |
100% |
63% |
Staff presentation |
100% |
33% |
100% |
67% |
Total |
100% |
80% |
100% |
78% |
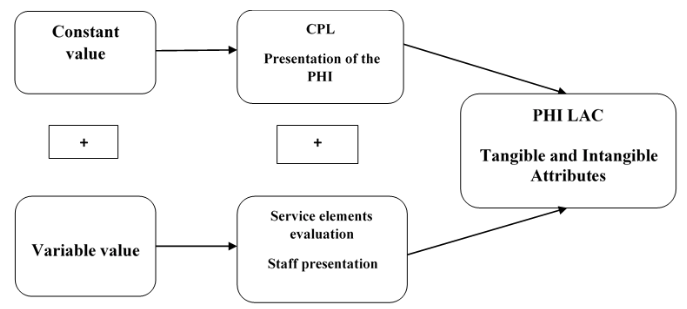
Considering the result of the evaluation throughout four consecutive years, it can be concluded that, regarding the first two established attributes (CPL and store presentation), the evaluation is always at its maximum value. For that reason, these attributes have been considered tangible. Therefore, based on the data, it can also be concluded that in the case of tangible elements, problems have been corrected, making it easier for the organization to continue to achieve high scores. This conclusion confirms what is conveyed in the literature, namely that, because they are observable, tangible elements are always more valued and more easily associated with profitability (Gummesson, 1998).
When analyzing the remaining two attributes (service elements evaluation and presentation of professionals), the scores recorded non-constant values over the course of the four years. These attributes can be considered intangible, as they failed to achieve the level required to obtain LAC certification.
After reflecting and analyzing the detailed scores of these attributes, and based on the knowledge of the whole process and organization, researchers have identified the factors they consider to be responsible for the recorded scores:
In conclusion, obtaining LAC certification depends on two main attributes, tangible and intangible. Tangibles attributes, once corrected, are easier to maintain. Intangible attributes, because they depend on people's performance, are harder to maintain.
Figure 3
Tangible and Intangible PHI LAC Attributes
The current paper set out to analyse a PHI’s service quality based on the customer’s perception, make a diagnosis, and identify and correct gaps, taking into account four main attributes, which were divided into two subclasses, providing a premise of consistent value to customers. This way, the organizational needs were satisfied and a real competitive advantage was achieved, which demonstrates the potentialities of LAC as a tool for promoting and developing an organization, through quality improvement of customer-service.
This case study shows that service evaluation relies on two main dimensions that can be correlated with tangible and intangible variables. Not only is it possible to outline physical evidence regarding spaces, furniture and service processes, but this study has also shown that, after correcting the problems found in the initial diagnosis, it is possible to maintain a high and stable level of quality, requiring only occasional adjustments. In the case of intangible variables, long-term maintenance is more challenging, as they rely heavily on the attitudes and behaviour of people working within the organization. This is mostly due to the three following factors: resistance to change, high turnover and the non-commitment of management to training. These results are in line with those found by other researchers who have carried out studies in the service quality area (e.g., Talib & Rahman (2015), Beer (2003), Ng, Leung, Johnston & Cowling, B.J. (2013)). Although the variability of factors confirmed the constant found in the international literature in this research area, researchers have also concluded that this model makes it possible for the provider to effectively act on in the most sensitive points of service and correct the most usual gaps, namely through the tools used in phases two, three and five of the process, where it is possible to directly interact and intervene with people. This possibility of an intervention that goes beyond the mere identification of problems, enables providers to act on and directly correct the source of the problems and solve them, namely by adjusting staff training, focusing specifically on that business area, and creating standards of service excellence. This opens the door to future research, in which researchers intend to demonstrate the flexibility and universality of the LAC model, providing real examples of its commercial application in diverse areas of service, including public service, driving schools, medical clinics and retail, among others.
BEER, M. (2003). Why total quality management programs do not persist: the role of management quality and implications for leading a TQM transformation. Decision Sciences, 34(4), 623-642.
CHAKRABORTY, R., & MAJUMDAR, A. (2011). Measuring consumer satisfaction in health care sector: The applicability of servqual. Researchers World, 2(4), 149.
CLEARY, P. D., & EDGMAN-LEVITAN, S. (1997). Health care quality: incorporating consumer perspectives. Jama, 278(19), 1608-1612.
CRONIN Jr, J. J., & TAYLOR, S. A. (1992). Measuring service quality: a reexamination and extension. The Journal of Marketing, 55-68.
ESTIMA, A., MANSO, J., & NUNES, C. S. (2017). Service Quality in Marketing LAC-A Suggested Tool for Evaluation and Continuous Improvement. Quality-Access to Success, 18 (159).
GUMMESSON, E. (1998). Productivity, quality and relationship marketing in service operations. International journal of contemporary hospitality management, 10(1), 4-15.
GUMMESSON, E. (2014). Productivity, quality and relationship marketing in service operations: A revisit in a new service paradigm. International Journal of Contemporary Hospitality Management, 26(5), 656-662.
GILMORE, A., & CARSON, D. (1993). Quality improvements in a services marketing context. Journal of Services Marketing, 7(3), 59-71.
JAMES, T. L., CALDERON, E. D. V., & COOK, D. F. (2017). Exploring patient perceptions of healthcare service quality through analysis of unstructured feedback. Expert Systems with Applications, 71, 479-492.
KASIRI, L. A., CHENG, K. T. G., SAMBASIVAN, M., & SIDIN, S. M. (2017). Integration of standardization and customization: Impact on service quality, customer satisfaction, and loyalty. Journal of Retailing and Consumer Services, 35, 91-97.
KATSARAVA, Z., GOUVEIA, R. G., JENSEN, R., GAUL, C., SCHRAMM, S., SCHOPPE, A., & STEINER, T. J. (2015). Evaluation of headache service quality indicators: pilot implementation in two specialist-care centres. The Journal of Headache and Pain, 16(1), 53.
KITAPCI, O., AKDOGAN, C., & DORTYOL, I. T. (2014). The impact of service quality dimensions on patient satisfaction, repurchase intentions and word-of-mouth communication in the public healthcare industry. Procedia-Social and Behavioral Sciences, 148, 161-169.
LILLRANK, P. (2015). Small and big quality in health care. International journal of health care quality assurance, 28(4), 356-366.
MEESALA, A., & PAUL, J. (2016). Service quality, consumer satisfaction and loyalty in hospitals: Thinking for the future. Journal of Retailing and Consumer Services.
NG, K. B., LEUNG, G. K., JOHNSTON, J. M., & COWLING, B. J. (2013). Factors affecting implementation of accreditation programmes and the impact of the accreditation process on quality improvement in hospitals: a SWOT analysis. Hong Kong Medical Journal.
PARASURAMAN, A., ZEITHAML, V. A., & BERRY, L. L. (1988). Servqual: A multiple-item scale for measuring consumer perceptions of service quality. Journal of Retailing, 64(1), 12.
PARASURAMAN, A., ZEITHAML, V., & BERRY, L. (2002). SERVQUAL: a multiple-item scale for measuring consumer perceptions of service quality. Retailing: critical concepts, 64(1), 140.
ROCHA, L. R. M., VEIGA, D. F., e OLIVEIRA, P. R., SONG, E. H., & FERREIRA, L. M. (2013). Health service quality scale: Brazilian Portuguese translation, reliability and validity. BMC health services research, 13(1), 24.
SHAW, C., & IVENS, J. (2005). Building great customer experiences. Basingstoke: Palgrave Macmillan.
SMITH, S., & WHEELER, J. (2002). Managing the customer experience: Turning customers into advocates. Pearson Education.
TALIB, F., RAHMAN, Z., & QURESHI, M. N. (2012). Total quality management in service sector: a literature review. International Journal of Business Innovation and Research, 6(3), 259-301.
TALIB, F., & RAHMAN, Z. (2015). Identification and prioritization of barriers to total quality management implementation in service industry: an analytic hierarchy process approach. The TQM Journal, 27(5), 591-615.
WIELE, T. V. D., HESSELINK, M., & IWAARDEN, J. V. (2005). Mystery shopping: A tool to develop insight into customer service provision. Total Quality Management & Business Excellence, 16(4), 529-541.
ZEITHMAL, V., (1981). How Consumer Evaluation Processes Differ for Products and Services. American Marketing Association First Services Marketing Conference, 186-190.
1. Ph.D. in Marketing and Strategy from the University of Aveiro, Portugal. She is an Invited Adjunct Professor at the Superior Institute of Accounting and Management - University of Aveiro. Affiliation: GOVCOPP and ISCA - University of Aveiro. aestima@ua.pt
2. Ph.D. in Management in Romania, recognized in 2013 by the University of Coimbra. She is an Invited Adjunct Professor at Águeda School of Technology and Management (ESTGA), University of Aveiro Affiliation: GOVCOPP and ESTGA - University of Aveiro carminanunes@ua.pt
3. Degree in marketing management from IPAM - The Marketing School. Title of Marketing from the University of Aveiro. Invited Adjunct Professor at Águeda School of Technology and Management (ESTGA), University of Aveiro. Affiliation: ESTGA – University of Aveiro. juditemanso@ua.pt