![]() ISSN 0798 1015
ISSN 0798 1015

![]() ISSN 0798 1015
ISSN 0798 1015
Vol. 39 (Number 47) Year 2018. Page 14
David RAMÍREZ Soto 1; Leonardo RIVERA Cadavid 2; Armando OROBIOQuiñones 3; Alvaro Julio CUADROS López 4
Received: 23/05/2018 • Approved: 08/07/2018
ABSTRACT: In this paper the risks that affect highway construction projects duration are studied by qualitative and quantitative approaches. For the qualitative analysis the consistency of expert opinions was evaluated and two methods were applied to identify critical risks that affect local projects. The quantitative analysis studied the impact of those risks over the activities of a local project and also the relationship between risks using fuzzy logic and Monte Carlo simulation. |
RESUMEN: En este artículo se estudian los riesgos que afectan la duración de los proyectos de construcción de vías mediante enfoques cualitativos y cuantitativos. El análisis cualitativo incluyó la evaluación de la consistencia de la opinión de expertos y la identificación de los riesgos críticos mediante dos métodos. El análisis cuantitativo usó lógica difusa y simulación Monte Carlo para estudiar el impacto de esos riesgos críticos sobre las actividades de un proyecto y además la relación entre los mismos riesgos. |

The construction of infrastructure more than an end, is constituted as a means through which other economic activities grow (Augusto et al., 2015). In Colombia, construction industry is usually a driver for economic growth. As can be seen in the Table 1, construction industry growth has been usually higher than national Colombian growth.
Table 1
Construction industry growth in Colombia
2014 |
2015 |
2016 |
2017 |
|
Colombia GNP |
4,6% |
3,1% |
2,0% |
1,8% |
Construction industry |
9,9% |
3,9% |
4,1% |
7,1% |
Source: (DANE, 2015), (DANE, 2016)
(DANE, 2017), (Redacción de Dinero, 2018).
In the country the construction industry is classified in buildings (residential and not residential) and infrastructure (roads, dams, bridges, railways). In particular, transportation infrastructure is a key element in a country’s economy and its growth, because this industry represents the link among production and consumption centers (Pérez, 2005).
However, in Colombia the available infrastructure is lower, not only compared to the developing countries of the rest of the world, but it is also below the average of Latin American countries (Augusto et al., 2015). In addition, (Benavides, 2008) states that the outlook is not favorable in Colombia, given that, of the 22 concessions in force in 2008, there were 281 changes of various kinds. The most frequently modified attribute was the investment requirement. In most cases, these renegotiations led to increases in the duration of the contracts initially established.
The possibility that the projects, their events, their impacts and the dynamics of the results are different to that anticipated by the parties, is due in part to the existence of risk factors (Fernández, 2007). The inadequate study and risk evaluation that cause cost overruns and time delays, is one of the weaknesses infrastructure construction industry in the country (Augusto et al., 2015).
In this regard, the research aimed to identify critical risks that affect local projects, and prioritize them in order to perform the analysis of impacts between risks and activities and between risks. This article is divided in two parts: The first part shows the general method followed for the research and the second part include the application of the steps proposed. The method proposed covers the risk identification, the risk prioritization and the simulation of project duration considering the risk relationship.
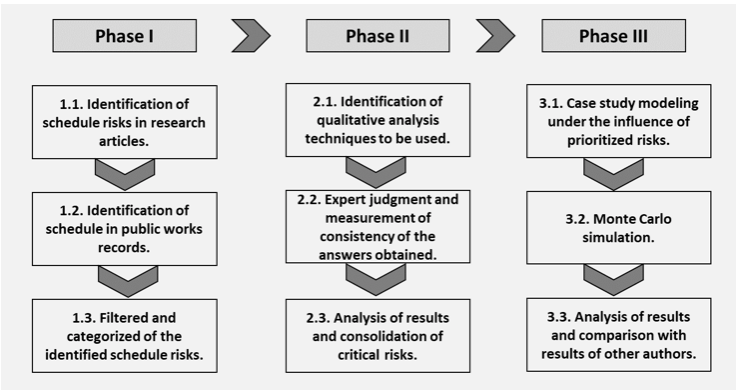
This paper followed the three basic phases proposed for risk management: risk identification, qualitative analysis and quantitative analysis with some adjustments in tools applied according to particularities of local environment and of the project where the method was applied.
In first place it was developed an identification and categorization of risks. A literature review about construction projects provided the list of potential risks that a project would have. This general input was later adjusted to the local construction environment whit help of an expert panel. Finally, those risks were categorized in order to facilitate the analysis.
The second phase was performing the qualitative analysis to have more information about risks and decide what risks should be included in the research. The analysis was done by the Failure Mode Effect Analysis (FMEA) method that uses likehood, impact and detection attributes for every risk to build a risk priority number (RPN). Risks with higher RPN were used for the quantitative analysis.
Finally, it was performed a quantitative analysis by Monte Carlo Simulation (MCS) and fuzzy logic to include uncertainty in activities durations. The first step was gathering planning project data such as activities, precedence relationship and activities duration. Later was gather risks correlation, probabilities limits, the scale of activity-risk influence degrees and the activity-risk influence. After that, the simulation model was built and a sensitivity analysis was performed. The general method followed for the paper is shown in the Figure 1:
Figure 1
General methodology used
First step in this phase was to identify all potential schedule risks by reviewing research papers and public works records in the city. The literature review about delay causes and schedule risks in construction and highway projects in databases such as Science Direct, EBSCO, Scielo and Emerald provided a total of 415 risk factors. Another source of information was the control reports in local projects. From this review, a total of 18 risk factors were obtained.
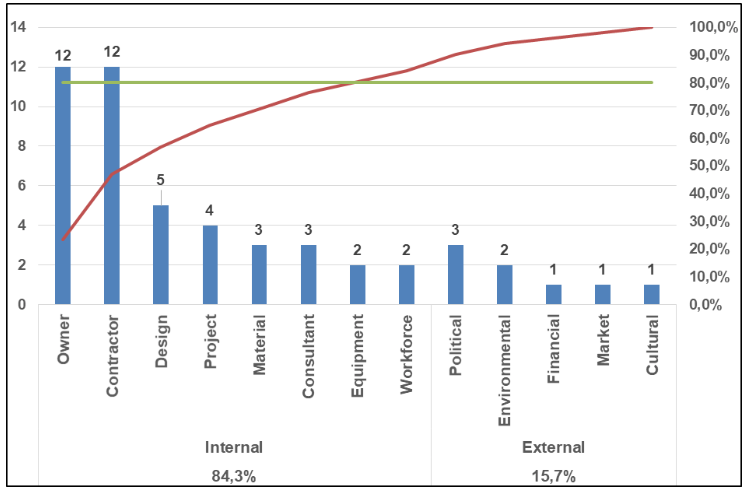
Finally, it was withdrawn those risks repeated, implicit in others or simply not applicable to the context to be evaluated to have a total of 43 risks. Those risks were categorized into internal and external risks, under the combination of the methodologies used by (Zayed, Amer, & Pan, 2008) and (Aziz & Abdel-Hakam, 2016) as can be seen in Figure 2.
Figure 2
Source of risks
Taking into account that the measurement instrument used in the interview was built empirically and that the scale originally presented by (Carbone & Tippett, 2004) was modified, it was considered necessary to evaluate the consistency of the instrument. The Cronbach's alpha coefficient is an index used to measure the internal consistency reliability of a scale, that is, to what extent the items of an instrument (Interview/Survey) are correlated. In addition (Oviedo Celina & Campo-Arias, 2005) suggest that Cronbach's alpha coefficient is one of the simplest forms used to measure internal consistency and the validation of the design of a scale. It has been also used to measure the reliability of scales in risks analysis in construction projects (Mpofu, Ochieng, Moobela, & Pretorius, 2017).
As can be seen in Table 2, the lowest coefficient was obtained in the probability of occurrence criterion (0.82).
Table 2
Cronbach Coefficient for proposed Likert scale
α Cronbach |
|
Probability of occurrence |
0,82 |
Impact |
0,94 |
Probability of detection |
0,92 |
Taking into account that the minimum acceptable value for the Cronbach coefficient is 0.70 according to (Oviedo Celina & Campo-Arias, 2005), it was found that the measurement instrument used in the interviews was understood and internalized by the experts
By the other side, in order to evaluate if there was consistency in the answers given by the experts, it was used the Spearman rank correlation coefficient. This coefficient has been used in the same way by authors such as (Mpofu et al., 2017), (Rahsid, Haq, & Aslam, 2013) y (Aziz & Abdel-Hakam, 2016).
In Table 3, the obtained results were recorded, finding that the expert three (E3), obtained a consistency of less than 0.4 with all the other experts. That is, the consistency tended to be nil, which is why it was decided to discard the qualifications provided by this expert.
Table 3
Coefficient of correlation of rankings among experts.
Correlation |
E1 |
E2 |
E3 |
E4 |
E5 |
E6 |
E7 |
E8 |
E9 |
E10 |
E1 |
1 |
- |
- |
- |
- |
- |
- |
- |
- |
- |
E2 |
0,58 |
1 |
- |
- |
- |
- |
- |
- |
- |
- |
E3 |
0,16 |
0,14 |
1 |
- |
- |
- |
- |
- |
- |
- |
E4 |
0,38 |
0,36 |
0,26 |
1 |
- |
- |
- |
- |
- |
- |
E5 |
0,40 |
0,17 |
0,07 |
0,24 |
1 |
- |
- |
- |
- |
- |
E6 |
0,36 |
0,06 |
0,20 |
0,20 |
0,88 |
1 |
- |
- |
- |
- |
E7 |
0,67 |
0,60 |
0,36 |
0,56 |
0,55 |
0,46 |
1 |
- |
- |
- |
E8 |
0,33 |
0,19 |
0,09 |
0,19 |
0,22 |
0,20 |
0,41 |
1 |
- |
- |
E9 |
0,41 |
0,29 |
0,12 |
0,26 |
0,16 |
0,16 |
0,53 |
0,46 |
1 |
- |
E10 |
0,40 |
0,16 |
0,20 |
0,37 |
0,34 |
0,16 |
0,43 |
0,31 |
0,31 |
1 |
On the other hand, the highest coefficient of consistency was obtained among the experts (E5 -E6), this may be due to the fact that both experts belonged to the same organization and their experiences and perceptions of risk may be similar. In this way, it is important to diversify the origin of the interviewed experts, because if all of them belong to the same organization, the results may be biased to this particular one and do not constitute a general vision of road infrastructure projects.
Several tools were identified to perform qualitative analysis, these tools have different evaluation criteria, number of variables and data processing. The relative Importance Index (RII) used by (El-Sayegh, 2008), consists in asking the experts to rate the severity of the risk according to a scale, to later calculate the weighted value and to be able to define a ranking. The risk criticality index (RC) used by (Zhao, Hwang, & Yu, 2013) in which, through expert judgment, two variables are qualified, which are the probability of occurrence and impact of the risk. Another tool is Risk Failure Mode and Effects Analysis (RFMEA), raised by (Carbone & Tippett, 2004), where the experts qualify three variables (Probability of occurrence, impact and detection probability), for later by means of dispersion and Pareto charts, to define a ranking, which allows to identify the critical risks.
That said, it was decided to use two tools, the RC and RFMEA. This in order to establish differences, and show if there is a significant difference between the resulting classification for each tool.
Both tools, required the judgment of experts, for which a survey was constructed where it could through interviews to record the necessary data. What was sought with the interview was that the experts rated the probability of occurrence, the impact and the probability of detection on each risk, based on a qualitative scale. This scale was adapted taking as reference (Carbone & Tippett, 2004) and it were applied the RFMEA of (Carbone & Tippett, 2004) and RC used by (Zhao et al., 2013). See Table 4.
Table 4
Value Guidelines Scale. Source: Adjusted from (Carbone & Tippett, 2004)
Likelihood |
5 |
Very likely to occur |
4 |
Will probably occur |
|
3 |
Equal chance of occurring or not |
|
2 |
Probably will not occur |
|
1 |
Very unlikely |
|
Impact |
5 |
Major milestone and critical path impact |
4 |
High milestone and critical path impact |
|
3 |
Moderate milestone and critical path impact |
|
2 |
Low milestone and critical path impact |
|
1 |
Impact insignificant |
|
Detection Difficulty |
5 |
There is no detection method available or known that will provide an alert with enough time to plan for a contingency |
4 |
Detection method is unproven or unreliable; or effectiveness of detection method is unknown to detect in time |
|
3 |
Detection method has medium effectiveness |
|
2 |
Detection method has moderately high effectiveness |
|
1 |
Detection method is highly effective and it is almost certain that the risk will be detected with adequate time |
Once the values supplied by the experts were registered, the risk criticality index for each factor was calculated, taking into account the probability of occurrence and the impact. The 10 most critical and most important risks can be seen in Table 5.
Table 5
Ranking of risks through the Risk Criticality Index (CR)
ID |
RIESGO |
RANKING |
2 |
Delays in the delivery of material and equipment |
1 |
21 |
Effect of social and cultural factors |
2 |
37 |
Acquisition of land |
3 |
30 |
Geological problems on the site |
4 |
26 |
Defective or incomplete design |
5 |
9 |
Effect of rain on construction activities |
6 |
11 |
Mismanagement of the site and supervision by the contractor |
7 |
17 |
Conflicts in the programming of subcontractors in the execution of the project |
8 |
43 |
Contractual problems |
9 |
16 |
Inefficient planning and programming by the contractor |
10 |
Once the method proposed by (Carbone & Tippett, 2004), was executed, a new risk ranking was obtained from the data obtained as can be seen in Table 6.
Table 6
Ranking of risks through the application of the RFMEA
ID |
RIESGO |
RANKING |
9 |
Effect of rain on construction activities |
1 |
2 |
Delays in the delivery of material and equipment |
2 |
17 |
Conflicts in the programming of subcontractors in the execution of the project |
3 |
16 |
Inefficient planning and programming by the contractor |
4 |
26 |
Defective or incomplete design |
5 |
30 |
Geological problems on the site |
6 |
21 |
Effect of social and cultural factors |
7 |
37 |
Acquisition of land |
8 |
14 |
Lack of experience of the contractor |
9 |
18 |
Poor communication / coordination between the consultant and other parties |
10 |
In Table 7, there are listed the 10 most critical risks obtained by every tool. They shared 80% of the risks and only four risks were not related. For this reason, it was considered to include those risks and have a final list of 12 prioritized critical risks.
Table 7
Comparison of results by RFMEA and RC
RFMEA |
Rank. |
Índice de Criticidad (RC) |
||
ID |
RIESGO |
RIESGO |
ID |
|
9 |
Effect of rain on construction activities |
1 |
Delays in the delivery of material and equipment |
2 |
2 |
Delays in the delivery of material and equipment |
2 |
Effect of social and cultural factors |
21 |
17 |
Conflicts in the programming of subcontractors in the execution of the project |
3 |
Acquisition of land |
37 |
16 |
Inefficient planning and programming by the contractor |
4 |
Geological problems on the site |
30 |
26 |
Defective or incomplete design |
5 |
Defective or incomplete design |
26 |
30 |
Geological problems on the site |
6 |
Effect of rain on construction activities |
9 |
21 |
Effect of social and cultural factors |
7 |
Mismanagement of the site and supervision by the contractor |
11 |
37 |
Acquisition of land |
8 |
Conflicts in the programming of subcontractors in the execution of the project |
17 |
14 |
Lack of experience of the contractor |
9 |
Contractual problems |
43 |
18 |
Poor communication / coordination between the consultant and other parties |
10 |
Inefficient planning and programming by the contractor |
16 |
In addition, the Spearman rank coefficient was calculated among the resulting rankings for each method, obtaining a grade of 0.88. This shows that although the treatment of the data and the variables are different, the results do not have a significant variation. It was also found that all risks identified as critical, were also recognized by other authors as can be seen in the Table 8.
Table 8
Comparison of results with those of other authors
(Gündüz, Nielsen, & Özdemir, 2012) |
(Diab, Ph, Varma, & Ph, 2012)) |
(Gündüz et al., 2012) |
(Mahamid, 2011) |
(Mousavi, Tavakkoli-Moghaddam, Azaron, Mojtahedi, & Hashemi, 2011) |
(Algahtany, Alhammadi, & Kashiwagi, 2016) |
(Aziz & Abdel-Hakam, 2016) |
(Elawi, Algahtany, & Kashiwagi, 2016) |
|
ID |
Turkey |
USA |
Vietnam |
Palestine |
Iran |
Saudi Arabia |
Egypt |
Saudi Arabia |
9 |
X |
X |
X |
|||||
2 |
X |
X |
X |
|||||
17 |
X |
X |
X |
|||||
16 |
X |
X |
||||||
26 |
X |
X |
X |
|||||
30 |
X |
X |
X |
X |
||||
21 |
X |
X |
X |
X |
||||
37 |
X |
X |
X |
X |
||||
14 |
X |
X |
X |
X |
||||
18 |
X |
X |
X |
X |
X |
|||
11 |
X |
X |
X |
|||||
43 |
X |
According to (Khedr, 2006) the most used approach to carry out the planning of construction projects is to assume a deterministic nature of activities, being the critical path method (CPM), the most used. However, this methodology is usually debated due to uncertainties or risks.
As a result, (Öztaş & Ökmen, 2008) emphasize the existence of new non-deterministic programming methods, such as the Program Review and Evaluation (PERT), the Probabilistic Network Evaluation (PNET), security intervals and the Monte Carlo simulation (MCS). Being all these, improved methods based on CPM and considered tools of risk analysis.
In this regard, (Öztaş & Ökmen, 2005) proposed a "Critical Risk Analysis Process" in which they propose a series of steps to be carried out and an equation that allow to model the variation in the duration of each activity. Among the critical input variables for this model, are the probability distributions associated with the critical risks, a risk-activity correlation matrix, where is established the percentage effect of each risk over each activity and finally a risk-risk correlation matrix, whose importance is highlighted by the authors as necessary to obtain realistic results.
They also proposed (Öztaş & Ökmen, 2004), a methodological structure to perform quantitative analysis of program and cost risks, through the analysis of a case study, which consists of a fixed price contract, that is to say where the Contractor plays the role of designer and builder. For the development of this methodology, the authors again consider as fundamental for the analysis of program risks, the minimum, probable and maximum values for the duration of the activities, the relationship between the activities and the probability that the risks affect them. On the other hand, to perform the cost risk analysis, it is also necessary to introduce to the model the minimum, maximum and probable quantities of production and unit price of each item, and the probability distributions associated with each of these ranges. Finally, using MS Excel spreadsheets and Crystall Ball simulation software, they run the model, to compare the stochastic results against the determinist plan.
Subsequently (Öztaş & Ökmen, 2008), in search of an increasingly sophisticated tool to determine the duration of the projects, they proposed a methodology called Correlated Schedule Risk Analysis Model (CSRAM), in which the correlation effect is taken into account between activities and risk factors. In addition, the authors substantially reduce the complexity in the input data collection, by using qualitative estimates, which are subsequently converted into quantitative estimates, through an iterative calculation algorithm present in the model.
Having said that, it was decided to use the CSRAM methodology proposed by (Öztaş & Ökmen, 2008). Because it facilitates data collection, as they are mostly obtained qualitatively through expert judgment. It also takes into account the influence of risk, implicitly in all project activities and the correlation between risk factors. The methodology was applied to a case study, corresponding to a road infrastructure project developed in the city of Cali, during the year 2017.
The case study corresponds to the construction of a pavement in the high sector of Santa Elena – city of Cali. The project was carried out through public bidding, for a final amount of COP $ 982,093,229. The information needed was the following:
The durations of the project activities were modeled, under the influence of the different risk factors, in the MS Excel software and the add-on software @Risk version 7.5.
The SMC was carried out using the @Risk software. 10,000 iterations were performed, obtaining the results recorded in Figure 3.
Figure 3
Monte Carlo simulation results - Case study
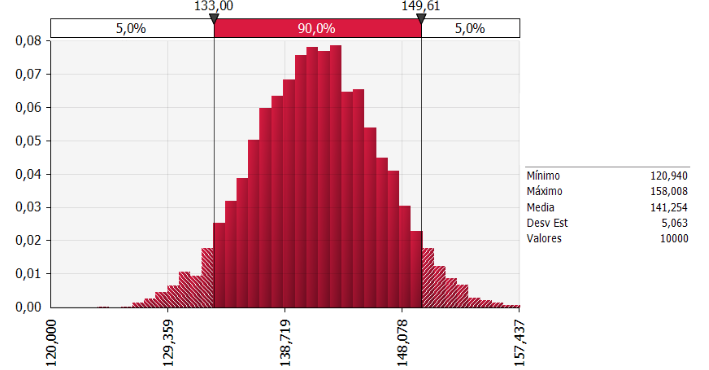
As can be seen, according to the simulation, the duration of the project would range between a minimum value of 120 and a maximum of 158 days, with an average value of 141 days. It should be noted that the agreed duration of the project in the contract was 120 days, for which there was a 0% probability of compliance, taking into account the risk factors.
The mode and the median obtained approximately the same value of 141 days, and have a standard deviation of 5 days. With a reliability of 90%, the project would take between 133 and 149.6 days. On the other hand, the distribution presents a slight asymmetry of the data to the right, since the bias index was 0.062.
It was also possible to analyze the sensitivity of the different project activities through a tornado diagram, such as the one shown in Figure 4. Where the critical activities of the project are listed and the sensitivity of these to the duration of the project is shown.
Figure 4
Tornado diagram of critical activities
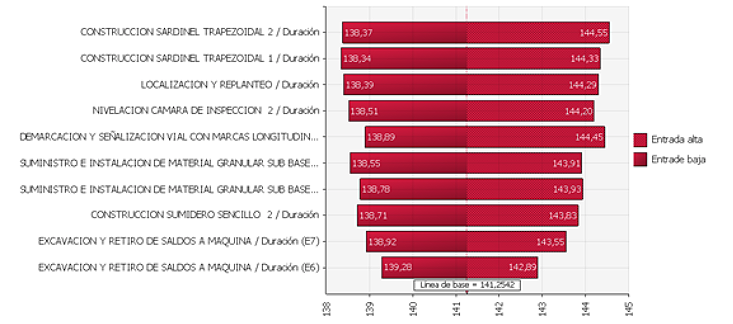
According to Figure 4, the most critical activities correspond to the construction of the trapezoidal curb. This being the activity affected in two suspensions of the project. Followed, there is the demarcation and signaling (Activity very susceptible to rain) and subsequently the activities corresponding to construction of sinks, sub base, location and redefinition and excavation. It should be remembered that the project had 23 activities but those listed are those that the model identified as critical.
With this tornado diagram what can be interpreted is that, for example, a good performance in the construction of the curb could have allowed the project to take 136 days, while poor performance could have taken the project to take 142 days.
Thirteen new simulations of 1,000 iterations each were carried out in order to have a sensitivity analysis of the risk factors. The way to proceed was to carry out the SMC assuming that the project would only be exposed to a risk, in this way the exercise was performed for each of the 12 risk factors. The last SMC was made with the project exposed to all the risk factors, obtaining the results of Table 9.
Table 9
Sensitivity analysis of the risks on the project
Stage |
Minimum Duration (Days) |
Average Duration (Days) |
Maximum duration (Days) |
Standard Deviation (Days) |
|
All risks |
146,56 |
157,14 |
167,30 |
3,45 |
|
ID 9 |
Effect of rain on construction activities |
116,34 |
125,45 |
135,08 |
2,57 |
ID 2 |
Delays in the delivery of material and equipment |
118,31 |
122,77 |
127,67 |
1,55 |
ID 17 |
Conflicts in the programming of subcontractors in the execution of the project |
118,95 |
121,43 |
124,32 |
1,06 |
ID 16 |
Inefficient planning and programming by the contractor |
119,71 |
121,04 |
122,6 |
0,46 |
ID 26 |
Defective or incomplete design |
117,26 |
124,01 |
131,79 |
2,59 |
ID 30 |
Geological problems on the site |
118,85 |
121,36 |
123,52 |
0,76 |
ID 21 |
Effect of social and cultural factors |
119,47 |
120,25 |
121,05 |
0,26 |
ID 37 |
Acquisition of land |
119,45 |
120,32 |
121,25 |
0,45 |
ID 14 |
Lack of experience of the contractor |
119,55 |
121 |
123,03 |
0,6 |
ID 18 |
Poor communication / coordination between the consultant and other parties |
120,11 |
121,21 |
123,2 |
0,47 |
ID 11 |
Mismanagement of the site and supervision by the contractor |
119,96 |
121,2 |
122,7 |
0,45 |
ID 43 |
Contractual problems |
119,45 |
120,27 |
121,25 |
0,44 |
According to the foregoing, it was possible to show that just from the risk factor "rain", the project could present a delay of up to 15 days, with the activity most affected by signaling and demarcation. In the same way, the risk factor "defective or incomplete design" could take the project to take 131 days. Being the latter, one of the real causes that impacted the duration of the project. During the execution, the project suffered different additions to the initial design.
In addition, in Table 9, the duration of the project was also recorded under the most pessimistic scenario possible. That is, a scenario where all the risks would occur simultaneously, obtaining a minimum duration of 146.56 days and a maximum duration of 167.30 days.
To compare the actual results with those obtained under the simulated model, the original programming agreed in the contract for the development of the road project must be reviewed first.
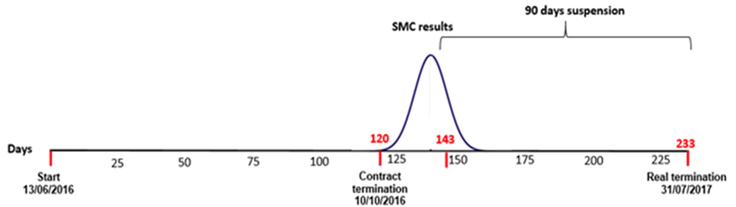
The project evaluated as a case study, had to start on June 13, 2016 and end on October 10, 2016, counting in this way with a term of 120 calendar days to execute the work. However, before starting operations, the project had a 30-day suspension because it did not have an environmental management plan. Later the project had two more suspensions, of 30 days each, for not having the technical evaluation of 11 trees that were involved in the construction of the curb, and that had to be removed.
As can be seen in Table 10, the project had 120 calendar days for the execution, but had a delay of 113 days.
Table 10
Real data of the case study project
Start date contracted |
Contracted end date |
Actual end date |
Scheduled days |
Delay in days |
13/06/2016 |
10/10/2016 |
31/01/2017 |
120 |
113 |
Once the actual results of the project were compared with those obtained in the SMC under the CSRAM methodology, it was possible to show, according to Figure 5, that the real ones were not close to the probabilistic distribution obtained. However, once the 90-day suspension was reduced to the actual duration of the project, a duration of 143 days was obtained. Value that does fall within the probabilistic distribution obtained in the SMC, with an associated probability that lasts 143 days or less corresponding to 85%.
Figure 5
Comparison of SMC versus real data
This is because in the CSRAM methodology, each iteration varies the duration of activities between a minimum and maximum value, according to the influence of the risks, and as it could be seen in Table 9, under the most pessimistic scenario the project would experience a maximum duration of 167.3 days. That is, the three suspensions that impacted the project with a duration of 30 days each, are outliers, which the CSRAM model does not recognize, because it works under normality criteria.
Comparing the previous result with other research works, such as those made by the authors (Gómez & Orobio, 2015) y (Öztaş & Ökmen, 2004), it was found that the real duration of the project that they analyzed, was within the probabilistic distribution once the SMC was made.
This is due to the fact that the case study projects analyzed by these authors suffered delays caused by risk factors in normal proportions. It must be taken into account that although the models used by these authors are different from the one used in this research project, they also process the information under normal limits and behaviors, which makes the model fragile to outliers.
The importance of prioritizing the risk factors was evident, because although initially a significantly extensive list of risks can be obtained, it is not necessary to spend resources and time developing action plans for all the risks. For the development of these techniques is characterized by having a strong influence of expert judgment, this being the main input variable, and on which a judicious and rigorous work must be done.
Monte Carlo Simulation (SMC) appears as a useful and affordable tool due to the current development of computers and the possibility of using student test versions. Allowing the quantitative evaluation of the impact of the risks on the duration of the activities and the project in general.
Regarding the CSRAM methodology used in this document to execute the SMC, it must be taken into account that this has a significant subjective influence, since the input variables of the model are defined by expert judgment, and the values obtained in the simulation will be around previously defined limits.
One of the reasons that the real duration of the project case study analyzed in this document, will not be found within the results of the simulation, is that the project in its real development suffered three suspensions of 30 days each. Values that for normal reasons no expert considers in planning. Well, although it is normal for a project to be affected by the risks, the suspensions are atypical situations.
In general, the proposed methodology used for the quantitative analysis is a good approximation of the behavior of the project. For once, the time lost as a consequence of the suspensions was eliminated, because they were considered atypical values, the duration of the project if it was within the probabilistic distribution obtained through the SMC. In addition, it must be taken into account that the CSRAM methodology has already been previously used in other investigations.
Algahtany, M., Alhammadi, Y., & Kashiwagi, D. (2016). Introducing a New Risk Management Model to the Saudi Arabian Construction Industry. Procedia Engineering, 145(480), 940–947. https://doi.org/10.1016/j.proeng.2016.04.122
Augusto, H., García, C., Antonio, M., Ospina, Á., Mantilla, L., & Meza. (2015). Análisis del sector de infraestructura en colombia. PMI Bogotá, Colombia Chapter., (1679397).
Aziz, R. F., & Abdel-Hakam, A. A. (2016). Exploring delay causes of road construction projects in Egypt. Alexandria Engineering Journal. https://doi.org/http://dx.doi.org/10.1016/j.aej.2016.03.006
Carbone, T. A., & Tippett, D. D. (2004). Project Risk Management Using the Project Risk FMEA. Engineering Management Journal, 16(4), 28–35. https://doi.org/10.1080/10429247.2004.11415263
DANE. (2015). Cuentas Trimestrales Colombia Producto Interno Bruto (PIB) Cuarto Trimestre de 2014. Bogotá: DANE.
DANE. (2016). Cuentas Trimestrales Colombia Producto Interno Bruto (PIB) Cuarto Trimestre de 2015. Bogotá: DANE.
DANE. (2017). Cuentas Trimestrales Colombia Producto Interno Bruto (PIB) Cuarto Trimestre de 2016. Bogotá: DANE.
Diab, M. F., Ph, D., Varma, A., & Ph, D. (2012). Using Risk Assessment to Improve Highway Construction Project Performance, (January 2015).
El-Sayegh, S. M. (2008). Risk assessment and allocation in the UAE construction industry. International Journal of Project Management, 26(4), 431–438. https://doi.org/10.1016/j.ijproman.2007.07.004
Elawi, G. S. A., Algahtany, M., & Kashiwagi, D. (2016). Owners’ Perspective of Factors Contributing to Project Delay: Case Studies of Road and Bridge Projects in Saudi Arabia. Procedia Engineering, 145(480), 1402–1409. https://doi.org/10.1016/j.proeng.2016.04.176
Fernández, M. R. (2007). La problemática del riesgo en los proyectos de infraestructura y en los contratos internacionales de construcción. Revista E-Mercatoria, 6, 1–29.
Gómez, H. D., & Orobio, A. (2015). Effects of uncertainty on scheduling of highway construction projects. Dyna, 82(193), 155–164. https://doi.org/10.15446/dyna.v82n193.47453
Gündüz, M., Nielsen, Y., & Özdemir, M. (2012). Quantification of Delay Factors Using the Relative Importance Index Method for Construction Projects in Turkey. Journal of Management in Engineering, 29(2), 133–139. https://doi.org/10.1061/(ASCE)ME.1943-5479.0000129.
Khedr, M. (2006). Project Risk Management Using Monte Carlo Simulation. AACE International Transactions, RI21-RI29,RI210.
Mahamid, I. (2011). Risk matrix for factors affecting time delay in road construction projects: owners’ perspective. Engineering, Construction and Architectural Management, 18(6), 609–617. https://doi.org/10.1108/09699981111180917
Mousavi, S. M., Tavakkoli-Moghaddam, R., Azaron, A., Mojtahedi, S. M. H., & Hashemi, H. (2011). Risk assessment for highway projects using jackknife technique. Expert Systems with Applications, 38(5), 5514–5524. https://doi.org/10.1016/j.eswa.2010.10.085
Mpofu, B., Ochieng, E. G., Moobela, C., & Pretorius, A. (2017). Profiling causative factors leading to construction project delays in the United Arab Emirates. Engineering, Construction and Architectural Management, 24(2), 346–376. https://doi.org/10.1108/ECAM-05-2015-0072
Oviedo Celina, H., & Campo-Arias, a. (2005). Aproximación al uso Coeficiente Alfa de Cronbach. Revista Colombiana de Psquiatría, 34(4), 572–80. https://doi.org/10.1590/S1135-57272002000200001
Öztaş, A., & Ökmen, Ö. (2004). Risk analysis in fixed-price design-build construction projects. Building and Environment, 39(2), 229–237. https://doi.org/10.1016/j.buildenv.2003.08.018
Öztaş, A., & Ökmen, Ö. (2005). Judgmental risk analysis process development in construction projects. Building and Environment, 40(9), 1244–1254. https://doi.org/10.1016/j.buildenv.2004.10.013
Öztaş, A., & Ökmen, Ö. (2008). Construction Project Network Evaluation with Correlated Schedule Risk Analysis Model. Journal of Construction Engineering and Management, (1), 49–63. https://doi.org/10.1061/(ASCE)0733-9364(2008)134:1(49)
Pérez, G. J. (2005). La Insfraestructura Del Transporte Vial Y La Movilización De Carga En Colombia. Documentos de Trabajo Sobre Economía Regional, (64), 73.
Rahsid, Y., Haq, S., & Aslam, M. S. (2013). Causes of Delay in Construction Projects of Punjab-Pakistan : An Empirical Study. Journal of Basic and Applied Scientific Research, 3(10), 87–96. https://doi.org/10.5829/idosi.hssj.2013.8.1.1128
Redacción de Dinero. (2018, February 15). ¿Qué pasó con el PIB en 2017? Dinero. Retrieved from http://www.dinero.com/economia/articulo/que-paso-con-el-pib-en-2017/255514
Zayed, T., Amer, M., & Pan, J. (2008). Assessing risk and uncertainty inherent in Chinese highway projects using AHP. International Journal of Project Management, 26(4), 408–419. https://doi.org/10.1016/j.ijproman.2007.05.012
Zhao, X., Hwang, B. G., & Yu, G. S. (2013). Identifying the critical risks in underground rail international construction joint ventures: Case study of Singapore. International Journal of Project Management, 31(4), 554–566. https://doi.org/10.1016/j.ijproman.2012.10.014
Annexed one
Identified schedule risks
N° |
Schedule risks |
1 |
Poor quality of the material |
2 |
Delays in the delivery of material and equipment |
3 |
Shortage of Equipment and Equipment |
4 |
Equipment breakdown |
5 |
Changes in government rules and laws |
6 |
Changes in the specifications and scope of the project |
7 |
Shortage of skilled labor |
8 |
Inadequate construction methods used by the contractor |
9 |
Effect of rain on construction activities |
10 |
Natural disasters |
11 |
Mismanagement of the site and supervision by the contractor |
12 |
Deficiency in inspections and quality audits |
13 |
Inadequate consultant experience |
14 |
Lack of experience of the contractor |
15 |
Deliberate delay in construction by the general contractor |
16 |
Inefficient planning and programming by the contractor |
17 |
Conflicts in the programming of subcontractors in the execution of the project |
18 |
Poor communication / coordination between the consultant and other parties |
19 |
Indefinite authority |
20 |
Fraudulent practices |
21 |
Effect of social and cultural factors |
22 |
Delay in reviewing and approving design documents by the owner |
23 |
Incomprehension of the requirements of the owners for the design engineer |
24 |
Complexity of the project design |
25 |
Inadequate experience in the design team |
26 |
Defective or incomplete design |
27 |
Mishandling of resources |
28 |
Difficulties in obtaining work permits |
29 |
Health, safety and environmental issues (HSE) |
30 |
Geological problems on the site |
31 |
Accident during construction |
32 |
Unrealistic times and requirements imposed in the contract |
33 |
Delays in the payment of progress to the contractor by the owner |
34 |
Unavailability of on-site services (such as water, electricity, telephone, etc.) |
35 |
Slow decision making by the owner |
36 |
Strikes of the workers |
37 |
Acquisition of land |
38 |
Suspension of work by the owner |
39 |
Design conflict between owners |
40 |
Shortage of construction materials in the market |
41 |
Change in taxation / new tax rates |
42 |
Rework due to errors during construction. |
43 |
Contractual problems |
1. Escuela de Ingeniería Industrial. Universidad del Valle. Ingeniero Industrial.david.soto@correounivalle.edu.co
2. Escuela de Ingeniería Industrial. Universidad del Valle. Profesor Asistente. Grupo de Investigación en Logística y Producción. leonardo.rivera.c@correounivalle.edu.co
3. Escuela de Ingeniería Civil y Geomática. Universidad del Valle. Profesor Titular. Grupo de Investigación aplicada en construcción GRUA. armando.orobio@correounivalle.edu.co
4. Escuela de Ingeniería Industrial. Universidad del Valle. Profesor Asistente. Grupo de Investigación en Logística y Producción.alvaro.cuadros@correounivalle.edu.co