![]() ISSN 0798 1015
ISSN 0798 1015

![]() ISSN 0798 1015
ISSN 0798 1015
Vol. 40 (Number 01) Year 2019. Page 7
PINO, Emmanuel 1; ROMERO, Héctor 2; FAJARDO, Eddy Johanna 3
Received: 19/07/2018 • Approved: 01/11/2018 • Published 14/01/2019
ABSTRACT: The objective of this work is to determine the effects of foreign exchange interventions on the exchange rate that have been adopted by the central bank in Colombia for the time period 2014-2016. To carry out the study is used daily data taken from the Banco de la Republica database. The methodology employed is the analysis of intervention on the time series. The results obtained show that the actions carried out by the monetary authority were successful in reducing the changes in the nominal exchange rate in Colombia. |
RESUMEN: El presente trabajo tiene como objetivo determinar los efectos de las intervenciones cambiarias sobre el tipo de cambio que han sido adoptadas por parte del Banco central en Colombia para el periodo de tiempo 2014-2016. Para llevar a cabo el estudio se utiliza datos diarios tomados de la base de datos del Banco de la República. La metodología empleada es el análisis de intervención de series de tiempo. Los resultados obtenidos demuestran que las acciones llevadas a cabo por la autoridad monetaria fueron exitosas para reducir los cambios del tipo de cambio nominal en Colombia. |

In Colombia the monetary policy is carried out by the Banco de la República, being the highest monetary authority, it sets clear objectives that are: maintaining a low and stable inflation and reaching a maximum level of economic growth similar to the maximum productive capacity of the economy. To carry out their objectives they have a series of mechanisms or policy instruments, for example, transmission channels, repo operations, banking reserve, open market operations (OMAS) and manipulation of the interest rate. Likewise, Colombia has introduced the flexible exchange rate system since 1999, which is why it has had periods in which the currency of legal tender has suffered phenomena of appreciation and depreciation on the exchange rate.
Due to the imbalances of supply and demand of Colombian pesos per US dollar, the exchange rate moved from 2.000,68 pesos/USD in 2014 to 3.053,42 pesos/USD in 2016, for an average for the whole period of 2.600,19 according to figures of the Banco de la República (2018). Given this evolution, the interest arises to observe the actions used by the Banco de la República that lead to maintain a desired exchange rate and that, in turn, maintain consistency with its objectives as a monetary authority, especially on the volatility of the price level, which translates into keeping inflation low and stable. Particular cases on studies in which the monetary authorities have carried out their exchange rate, such is the case of Beine (2003) which investigates the effects of the interventions of the Central Banks on the volatility of the exchange rate ex ante, that is, it measures expectations about volatility in advance of an intervention. In the particular case of Colombia, similar studies are scarce and their periods are out of date, reducing the likelihood of making a contrast to a similar vision of reality for which it can be proven empirically. This particular study is relevant, especially since Colombia move to an inflation targeting system in 1999; relying on a more transparent monetary policy and being in touch with modern central bank polices.
In this sense, the following research aims to verify and measure the effect of exchange intervention actions of Banco de la República. In this way, the expected effect can be measured quantitatively with respect to the interventions made, and it can also serve the different monetary authorities of each economy interested in verifying whether their intervention actions have been effective on their corresponding exchange rate. The following work is subdivided as follows: in section two (2) literature review is addressed, in section three (3) is the methodology to be used for the analysis of the data. In section four (4) the results of the investigation are shown and section five (5) proceeds to mention the conclusions or final notes.
The literature provides various studies, among which are the following: Brissimis & Chionis (2004) explores the effects of the intervention of the exchange market by the European Central Bank and the Bank of Japan on the conditional mean and the variance of euro-dollar and euro-yen exchange rates. Where the European Central Bank (ECB) takes measures to support the euro against the dollar and the Bank of Japan to moderate the strength of the yen against the euro. The model used is a generalized autoregressive conditional heteroskedasticity (GARCH) (1,1). The variables that are part of the model are the US and Japanese exchange rates, for which data are used with dummy variables, where the value of 1 takes the days Monday and zero the other days during the period of January 4 from 1999 to June 30, 2001, in order to control the monetary policies in the countries under study and to verify the effectiveness of the intervention by the corresponding monetary authorities. It was concluded that the conditional volatility only in the case of the JPY / EUR exchange rate indicates that the intervention operations of the Bank of Japan were more effective. According to the authors, the fact that the Bank of Japan operated secretly (to identify the intervention days, they had to go through the financial news in the Financial Times) was the reason for their greater impact on the exchange rate.
On the other hand, Berganza & Broto (2012) analyze target inflation, interventions in the foreign exchange market and the volatility of the exchange rate in a selection of thirty-seven (37) emerging countries. Nine (9) panel data models were used, based on a methodology for estimating ordinary least squares (OLS) grouped with temporary variables, for quarterly data from 1995:Q1 to 2010:Q1. The authors conclude that foreign exchange interventions carried out by some countries with target inflation, mainly in Latin America, have been more effective in reducing the volatility of the exchange rate than countries that do not have target inflation.
Next, Cheng et al. (2013) study the case of the intervention of the central banks and the volatility of the exchange rate with specific evidence for the case of Japan, because it is a constant topic of discussion since the collapse of the agreement of Bretton Woods (a monetary system that stablished an obligation for each member to adopt a peg of its currency to gold). Using high frequency data (every 5 minutes) on the Japanese Yen with respect to the US dollar; for a period from April 1, 1991 to July 31, 2006. No evidence was found that the interventions were effective for the entire period of the sample.
For its part, Pelinescu (2014) analyzes the volatility of the exchange rate of Romania (leu/euro) taking into account the influence of the volatility of other currencies and other fundamental macroeconomic variables. The methodology for high frequency time series applied to different autoregressive conditional heteroscedasticity (ARCH)-GARCH models is applied, the data are composed of daily time series for the period from January 5, 2000 to August 31, 2013. It is concluded that the volatility of the leu/euro exchange rate follows the ARCH model, in which there is asymmetry in the evaluation of information on the evolution of the exchange rate and that exchange returns are correlated with volatility.
On the other hand, Fatum (2015) reviews the exchange intervention when interest rates are zero in Japan. The period from 1999 to 2004 is taken with a total of 159 days and an intervention methodology is applied in GARCH models when the money market rates are at the lower limit. The author concludes that interventions can be effective in influencing the level of the exchange rate when interest rates are at the lower limit.
However, Chen & Gau (2015) analyze the role of the exchange market intervention in the price discovery process of the USD-JPY market, and also study how the asymmetry of the information in the offer is related to the interventions in the exchange market that are carried out by the Japanese monetary authorities. They used tick-by-tick quote data covering the period of January 1, 2003 and December 31, 2004, using the vector error correction methodology (VECM). Concluding that the Japanese official intervention affects the relative contributions of buying and selling quotations to the discovery of prices of the USD-JPY exchange rate.
On the other hand, Hu et al. (2016) study the current and verbal intervention in the exchange rate in the legal currency RMB (renminbi) of the Peoples Republic of China because it is the second currency worldwide used in international trade. Monthly data were obtained from July 2005 to December 2013, applying the vector autoregressive model (VAR). It is concluded that to maintain the RMB exchange rate stable, the Chinese Peoples Bank has been buying large amounts of dollars in the currency market and injecting money into the base economy. Additionally, it finds that the communication from the monetary authorities of the Popular Bank of China is not as effective as a market intervention in terms of influence on the exchange rate.
Likewise, Herrera (2016) studies the effectiveness of foreign exchange market interventions within a context of inflation goals. For which he uses a Rosset friction model, he later takes the conditional expectation of intervention, as an instrument for real interventions in a model of ordinary least squares (OLS) with daily data between January 2008 and August 2012. The results indicate that the intervention had a buffer effect on the volatility of the performance of the daily exchange rate, but not on the level of the exchange rate.
On the other hand, Mosugu & Anieting (2016) investigates the impact of the exchange rate in Nigeria. Using the classical multiple regression model under the assumptions of the OLS method and the intervention model. Monthly data from 1980 were used: 1980:M1 to 2014: M12. Finally, given that there is a significant change between the long-term average effect before and after each intervention, it is concluded that a postulated event does not cause a change in the exchange rate.
This section outlines the methodology by which the data analysis begins. Next, the model for the intervention analysis on the time series of the exchange rate in Colombia 2014-2016 is advanced. A first part of the methodology is related to the stationarity of the time series studied. In the second part, we proceed to perform the analysis of intervention, where we selected a series of relevant dates in the decision making of foreign exchange intervention that have been able to affect the exchange rate. Subsequently, the selected date is adhered to the model and it is represented with a number in the time series. Finally, the Akaike criterion of the series is contrasted before the intervention and after the intervention, to effectively infer that said dates did have an impact on the exchange rate in Colombia during the period of time studied.
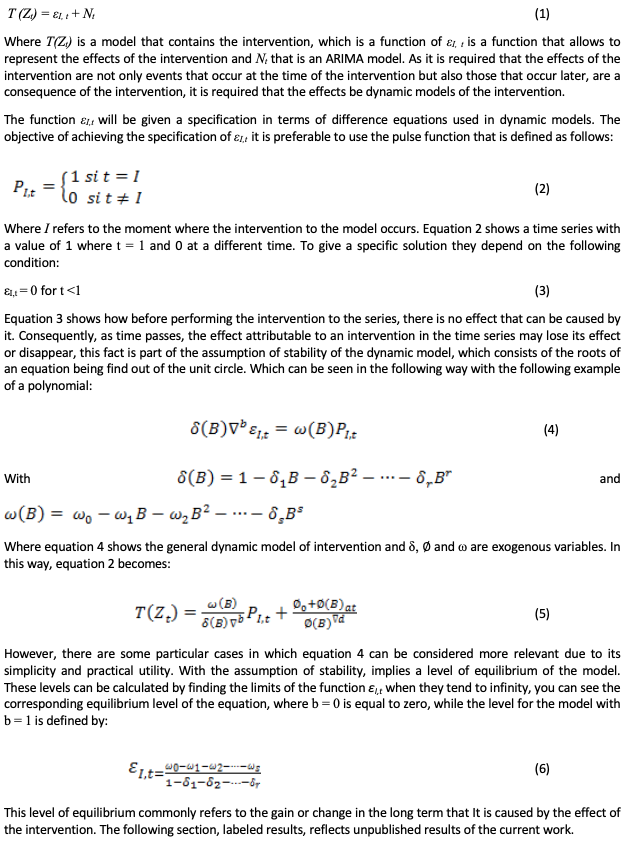
The intervention methodology is applied to a wide range of fields (see Fajardo et al. 2018, Uribe et al. 2017, Meriño et al. (2018) and Cárdenas et al. 2017 for a short review) According to Guerrero (2003), interventions can be interpreted as the occurrence of an exogenous event and in some cases they have a recursive effect, that is, they are repeated over time in a successive manner. Assume the stationary time series Wt that is made up of 2 parts, one deterministic and the other stochastic (random), given that you can differentiate 3 types of effects: (i) those that have effect on momentary loss or gain of the level on the series, (ii) those that have a constant effect on the level of the series and (iii) those that regardless of whether they influence the deterministic part, alter the stochastic structure. When the effects are presented (i) and (ii) are those that are susceptible to the intervention analysis. The intervention analysis model that is an extension of the Autoregressive Integrated Moving Average (ARIMA) models can be expressed as follows:
The following section presents the application and results obtained from the time series of the exchange rate, based on the proposed methodology. Once the methodology has been carried out, the intervention will proceed to the series, with the aim of finding out how effective these interventions have been on the exchange rate.
Graph 1
Exchange rate in thousands of
pesos for Colombia 2014 -2016.
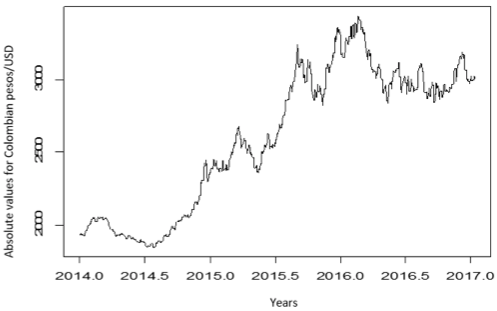
Source: Own elaboration with data from the Banco de la República in statistical package R.
For the time series of the Colombian exchange rate, it faces variations over time in relation to internal and external shocks that the economy faces. In 2014, the exchange rate was slightly depreciated in the first months of the year due to the expectation generated at that time by the electoral contest for the presidency. Once the first semester of the year was over, the exchange rate in Colombia depreciated compared to the first half of the year left by the electoral contest for that year.
Subsequently, in 2015 the exchange rate continued with its depreciation with a growing trend, which showed variations at the beginning of the year, but remained relatively stable, with an average value of 2.400,00 pesos per dollar. Then, for the month of July it began to have an upward trend due to the indirect influence of the prices to the fall of the barrel of oil, information captured from Bloomberg (2015), where the national economy stopped receiving significant revenues, going from USD 100 per barrel to face a decline until reaching USD 45,00 per barrel. Added to this, Colombia faced a decrease in foreign investment as recorded by the National Administrative Department of Statistics (2015) (DANE), which generates a lower flow of dollars circulating in the economy and has an impact on its depreciation. Next, China decided to continue with its policy of devaluation of the yuan, which affects the price of raw materials, which makes them cheaper and more attractive abroad.
Then, for 2016, after having an increase in the level of the exchange rate, it tended to decrease until the month of June when the prices of the barrel of oil began to have a slight increase in its sale price and to perceive income again. Finally, the series shows slight variations until the end of 2016 due to the rating by risk rating agencies such as Standard & Poors (2016) (S&P), where they suggest making tax changes to maintain internal stability.
Graph 2
Quarterly percentage variation of the
exchange rate in Colombia 2014-2016.
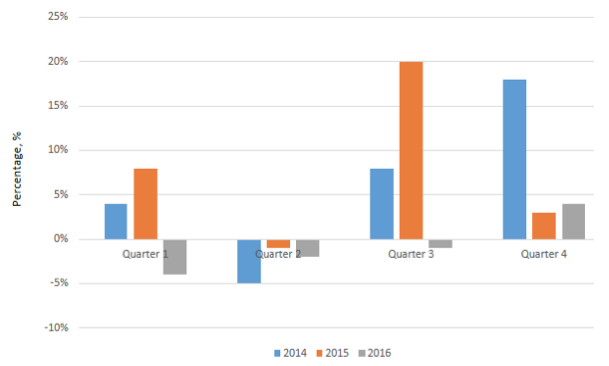
Source: Own elaboration with data from the Banco de la República
For graph two (2), 2014 generally represented a growing trend in 3 of its 4 annual quarters, the exception was the 2nd quarter of the year due to uncertainty in international markets with the rise in interest rates in the Federal Reserve of the United States. Coupled with this, the presence of the electoral year that Colombia lived, was generating volatility in its first quarter with a slight upward trend, later, the 2 quarter marked a depreciation of the exchange rate. Finally, the appreciation of the exchange rate was completed.
Then, in 2015 it was the year with the highest appreciation compared to 2014 and 2016, afterwards the quarter suffered a negative change or depreciation of the exchange rate, influenced by a slight recovery of the prices of the barrel of oil based on information obtained from the internet portal such as Bloomberg. Finally, the 3 quarters was the highest variation registered during the observed period of time. To conclude, 2016 was a volatile year in terms of variation, since the first three quarters of the year had a negative variation compared to 2015 in response to the stabilization of the price of a barrel of oil, foreign investment and stability of the economy in general taking into account the bulletins and updates of indicators provided by DANE.
Graph 3
Volatility of the exchange rate
in Colombia 2014-2016
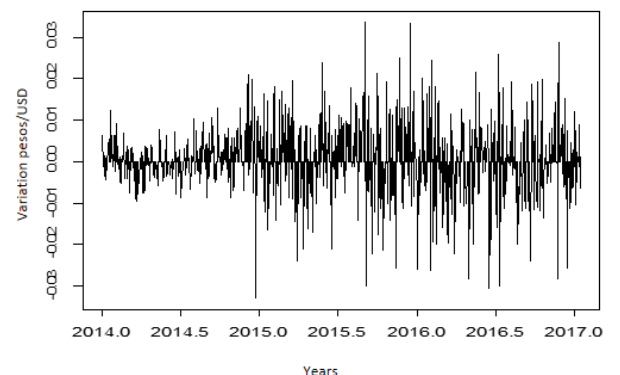
Source: Own elaboration with statistical package R.
Graph 3 shows the volatility of the series of the exchange rate where a series of outliers are highlighted throughout the series, which indicates their variation during the stipulated period of time. The first spike to highlight is the one that breaks the stable trend and marks in comparison with the graph 1 the increase of the exchange rate, that is to say, a depreciation of the Colombian peso. The upward trend in the value of the exchange rate, being the maximum value presented at the end of 2014, could be caused in part by the degree of uncertainty generated by being an election year.
Subsequently, after the second semester of 2015 until 2016, the graph shows large atypical peaks, the most prominent being the first two (2) where its variation was from end to end, that is, it had positive and negative variation in a short time this is related to the depreciation process that the exchange rate lived with respect to the low price of a barrel of oil, a decrease in foreign direct investment and the speculation begins with an increase in the interest rates of the Federal Reserve of the United States.
In its final stage the first semester of 2016 maintained peaks with both positive and negative variations, but to a lesser extent, however, with the persistent short-term variation. Finally, for the second half of 2016, its variations continue with an increasingly stable volatility trend until it reaches a point where two (2) peaks stand out again due to a slight and brief recovery of the exchange rate value but that It quickly dissipates and remains stable for reasons of slight signs of the recovery of the value of oil internationally.
Table 1
Descriptive statistics of the
volatility of the exchange rate.
Statistic |
Value |
Mínimum |
-94,37 |
Average |
0,98 |
Maximum |
107,81 |
Source: own elaboration with statistical package R.
Table 1 shows the main descriptive statistics of the volatility of the exchange rate. In that sense, the lowest recorded variation was 94,37 pesos, the maximum value is taken as 107,81 pesos. Likewise, the average value of the volatility was 0,98.
Table 2
Stationarity test.
Test |
p-value |
Dickey-Fuller |
0,01 |
KPSS |
0,10 |
* Note: the tests of Dickey-Fuller and KPSS measure with a level of significance at 0.05, to observe the stationarity of the series, the Dickey-Fuller test has an alternative hypothesis is that the series is stationary. On the contrary, the alternative hypothesis for the KPSS test is that the series is not stationary.
Source: Own elaboration in statistical package R.
To verify the stationality of the series, the Dickey-Fuller test is used (see table 2) with a result p-value = 0,01 <0,05, which confirms that it is a stationary model and has a unit root. On the other hand, the Kwiatkowski-Phillips-Schmidt-Shin test (KPSS) with its respective p-value = 0,10> 0,05 reaffirms the stationary nature of the series.
Table 3
Selection of possible ARIMA models
under the Akaike criterion.
Models |
AIC |
ARIMA (2,2,1) |
9.778,09 |
ARIMA (0,1,2) |
9.779,12* |
ARIMA (2,1,0) |
9.779,19* |
ARIMA (1,1,1) |
9.779,46* |
ARIMA (0,1,1) |
9.780,02** |
ARIMA (2,2,2) |
9.780,04 |
ARIMA (1,1,2) |
9.780,98 |
ARIMA (2,1,1) |
9.781,13 |
ARIMA (2,1,2) |
9.782,98 |
ARIMA (1,1,0) |
9.784,16 |
Note: models marked with an asterisk (*) are significant models. However, the model marked with 2 asterisks (**) is the model that best fits the series and meets its diagnosis.
Source: Own elaboration with statistical package R.
To diagnose the most optimal model, it is evaluated and verified if the ARIMA model found as ARIMA (0,1,1) is adjusted to a considerable time series. To carry out this, other models are taken into account that likewise were carried out the process. In this sense, checking if the selected model is adequate, is through compliance with the basic assumptions of the model, which are: standard errors should follow a normal distribution with zero mean and constant variance. If these assumptions are not met, it becomes necessary to re-identify another possible model and redo the proposed methodology.
In view of the above, in Table 3 the identified models are present and the one that presents the stability principle previously mentioned in the methodology is chosen. The model was specified taking into account the functions of simple autocorrelation (ACF) and partial autocorrelation (PACF), through these it was possible to find the order of autoregressive processes and moving averages. For the selection of the ARMA model, the value of the Akaike criterion (AIC) and the Bayesian information criterion (BIC) are taken into account, for which the model is the ARMA (0,1).
Graph 4
Standardized residuals of
the ARIMA model (0,1,1)
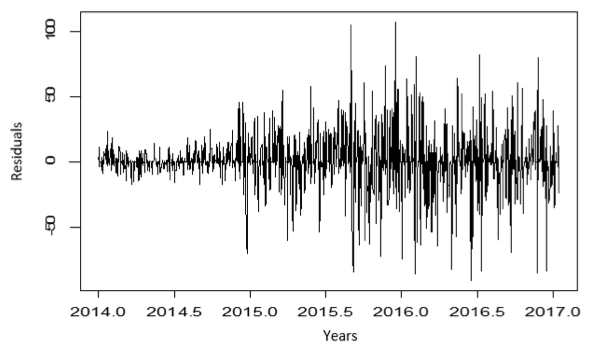
Source: Own elaboration with statistical package R.
The graph of the standardized residuals (graph 5) shows that the model has captured the essence of the series under study, this because there is no definite trend, a pattern of growth or decrement established, in other words, waste they seem random and indicate that there is no violation of the assumption that the variance is constant. From the observation of the cumulative correlogram, it is concluded that the residuals are white noise, that is, they are within the confidence limits and for this reason there is no relevant information of these, as the constant variance the model captures the essence of the series.
Graph 5
Accumulated correlogram
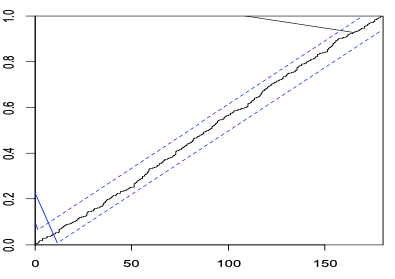
Source: Own elaboration with statistical package R.
-----
Table 4
Test of normality and independence
and randomness of the
Test |
Type of analysis |
p-value |
Shapiro-wilk |
Normality |
2,2e-16 |
Box-Ljung |
Independence |
0,9026 |
* Note: the Shapiro-Wilk test has an alternative hypothesis that the residues are normal. For the Box-Ljung test, his alternative hypothesis is that the residuals are not independent. In addition, both measure with a level of significance of 0.05.
Source: Own elaboration with statistical package R.
On the other hand, other properties such as the independence and normality of the waste are also analyzed, this is done through the Box - Ljung test and the Shapiro - wilk test respectively. According to the results of the tests in Table 4, it is found that there is normality between the residues because the p-value of the Shapiro-wilk test is less than 0.05. On the other hand, the Box-Ljung test shows that the residuals are not independent because their p-value> 0.05.
Then, a series of dates are indicated in which the Banco de la República decided to intervene in the foreign exchange rate market in a way that it considers pertinent and necessary. In this way, these interventions are indicated whether the Banco de la República performed either a purchase or a sale of dollars in the foreign exchange market (see Table 5). In February 2014, the monetary authority decided to make the purchase of USD 190 million dollars which helps the increase in the exchange rate, this in turn increases the price of the dollar in the economy because by keeping constant the demand for dollars and before a greater supply, the price of the dollar rises which generates the depreciation on the exchange rate. For the month of May 2014, the monetary authority made the direct purchase of USD 380.10 million dollars, which causes an appreciation effect on the exchange rate. Later, by the end of 2014, it was decided to intervene by buying USD 70,8 million in the exchange market, causing a depreciation of the exchange rate. Subsequently, in 2016 the Banco de la República decided to intervene by selling USD 255,60 million in the month of May in response to a volatile period, however, as the trend of the previous year, that is, in 2015 the most constant and prevailing action of the monetary authority was not to intervene, it can be said that this action helps to have an increase in the exchange rate which causes depreciation of the local currency.
Table 5
Intervention of the Banco
de la Republica.
Date |
Purchase in millions of dollars US |
Sale in millions of dollars US |
February 2014 |
190,00 |
|
May 2014 |
380,10 |
|
December 2014 |
70,80 |
|
May 2016 |
|
255,60 |
Source: Own elaboration with Microsoft Word.
As shown in table 5, the dates selected for the intervention analysis show results consistent with the decision of the Banco de la República to intervene in its vast majority in the exchange market to maintain a stable or desired exchange rate for the monetary authority. The direct auction purchase operation of USD 190, USD 380,10 and USD 70,8 million and the sale of USD 255,60 million were the only relevant purchase dates through the analysis and the monetary authority intervened. where it causes some impact on the exchange rate. On the other hand, the action of not intervening in the exchange market through purchases or sales of dollars also shows its effect as shown above.
For the analysis of time series, it is possible to measure the effect of an event or phenomenon, whether known or not, which causes some abnormal disturbance in the study series. For the purpose of the work, the implementation of the intervention analysis model has the purpose of determining whether the actions carried out by the Banco de la República through the purchase auction to accumulate and direct sale in deacumulation of international reserves to have the desired influence on the value of the exchange rate in Colombia corresponds in effect to its actions as monetary authority or yes, on the contrary, these actions were not successful to the desired extent. In this sense, a series of significant dates and named above are analyzed in which the series presented an anomaly in its value, being a very high value with respect to the average in the series or very low in relation to it, which makes it volatile. The selected dates are present in table 6.
Table 6
Dates and effect of the intervention on
the actions of the Banco de la República.
Date and effect |
Depreciation of the exchange rate |
Appreciation of the exchange rate |
Purchase in February 2014 |
|
-1,76 |
Purchase in May 2014 |
5,04 |
|
Purchase in December2014 |
|
-16,30 |
Sale in May 2016 |
|
-45,70 |
Source: Own elaboration with Microsoft Word.
Once the intervention analysis model has been made, the effect is obtained in a quantified way in pesos of the interventions made by the Banco de la República. Given this, it should be noted that some of the interventions modify the value of the exchange rate in the following way: increasing its value which causes a depreciation and decreasing what generates the opposite effect, an appreciation. The action of the Banco de la Republica helped to increase or decrease the value of the exchange rate, in this sense the monetary authority seeks to maintain a desirable exchange rate value with a goal target inflation range of "3%" with a deviation of the "± 1%", therefore, its intervention actions are not subject to maintain a strictly rigid exchange rate, but neither freely fluctuating because it can affect the wellbeing of the economy that translates into inflation, where goods and services are more expensive and affect unemployment, by not having a level of the type consistent with high and sustained economic growth.
In this order of ideas, the dates of greatest impact of the shares issued by the Banco de la República were the depreciation in May 2014, where it managed to increase the value of the exchange rate by 5,04 pesos with respect to the previous day of the exchange rate. However, the intervention of February and December 2014 did not present a depreciation, on the contrary, an appreciation of the exchange rate is evident at 1,76 pesos in February and 16,30 pesos for December. Subsequently, in May 2016 an appreciation of the exchange rate of 45,70 pesos was achieved. It is inferred by graphs 1 and 3 that the years 2015 and 2016 (partially) were years with an upward trend where, although it had some declines, it caused that, in particular, the year 2015 was a volatile year of the exchange rate in spite of maintaining an upward trend, year in which the action of not intervening in the exchange market caused an increase in the level of the exchange rate, passing on average from 2.200 pesos to 3.000 for the year 2016.
It is worth to mention that in the months where it had the greatest monthly variation of the exchange rate, it was not always the month where most currency purchases were made by direct auction, it is startling the month of December 2015 in which, although it had the highest variation of the exchange rate with respect to the other months elapsed, minor purchases of foreign currency were made for USD 23 million dollars, which seems to indicate that the greater the variation of the exchange rate, the Banco de la Republica did not want to intervene in the exchange market. In contrast next month (August) is a significant month in which the monetary authority bought a considerable amount of foreign currency with a value of USD 202.6 million, where it manages to reduce the exchange rate, but it was a month where the variation of the exchange rate was slight.
Determining the effect of the intervention policies would change on the part of the Banco de la Republica of Colombia is of great importance insofar as these actions promote welfare in the economy. Consequently, the purpose of this paper was to observe those exchange intervention actions that have affected the exchange rate in Colombia. In this way, a methodology was taken into account that allows us to see the volatility of the exchange rate and also to see its effect on the exchange rate.
The application of the intervention analysis model to the actions performed by the monetary authority can serve to be considered an instrument to evaluate the effect of said actions. Through this, you can quantify the value of the effect on the exchange rate when the central bank wants to intervene through the purchase of foreign currency in the foreign exchange market. In addition, it allows to see how said purchases or sales generate the respective phenomena on the exchange rate and that consequently are in congruence with the inflation policy objective in Colombia.
According to the results obtained, it was observed that the interventions made by the monetary authority to reduce the exchange rate were successful. However, in December and February 2014, despite making an intervention with the intention of generating an increase in the exchange rate, the opposite effect occurs, a decrease in the exchange rate which ended up generating an appreciation. On the other hand, the amount of foreign currency sales made in May 2016 was sufficient for that moment because an appreciation of the exchange rate was obtained. However, purchases made by Banco de la República increased the exchange rate in Colombia due to the amounts purchased for May 2014. However, it is recommended to be careful with the amount of exchange interventions to stabilize the rate of exchange or perform interventions more frequently. In addition, consideration must be given in the amounts to be purchased in order not to affect other macroeconomic variables of Colombia. Taking into account the amount of international reserves held.
Banco de la República (2018) Información estadística. Obtained from: http://www.banrep.gov.co/es/tasa-cambio-del-peso-colombiano-trm
Beine, M. (2003). Volatility expectations and asymmetric effects of direct interventions in the FX market. Journal of the Japenese and International Economies, 17, 55-80.
Berganza, J. & Broto, C. (2012). Flexible inflation targets, forex interventions and exchange rate volatility in the emerging countries. Journal of international Money and Finance, 31(2), 428-444.
Bloomberg. (2015). Bloomberg LP Limited Partnership. Obtained from: https://www.bloomberg.com/energy
Brissimis, S. N., & Chionis, D. P.(2004). Foreign exchange market intervention: implications of publicly announced and secret intervention for the euro exchange rate and its volatility. Journal of Policy Modeling, 26(6), 661-673.
Cárdenas, M., Sanjuanelo, T., Romero, H. & Fajardo, E. (2017) Impacto de las políticas públicas sobre la evolución del índice de precios de la vivienda nueva en Colombia (2005-2015): Un análisis de intervención. Revista Telos, 19(2), 212-236.
Chen, Y. L., & Gau, Y. F. (2015). Foreign exchange market intervention and price discovery. Journal of the Japanese and International Economies, 38, 214-227.
Cheng, A., Das, K. & Shimanati, T. (2013). Central bank intervention and exchange rate volatility: Evidence from Japan using realized volatility. Journal of Asian Economics, 28, 87-98.
Departamento Administrativo Nacional de Estadistica. (2015). Información estadística. Obtained from: http://www.dane.gov.co/index.php/estadisticas-por-tema/cuentas-nacionales/cuentas-nacionales-trimestrales#pib-oferta-y-demanda
Fajardo, E., Romero, H. & Álvarez, M. (2018) Política de tolerancia cero al alcohol y accidentes automovilísticos en el Área Metropolitana de Bucaramanga, Colombia. En Meriño, V. (Editor). Gestión del conocimiento: Perspectiva Multidiciplinaria. Fondo Editorial Universitario de la Universidad Sur del Lago “Jesús María Semprúm”. [Book in press]
Fatum, R. (2015). Foreign exchange intervention when interest rates are zero: Does the portfolio balance channel matter after all? Journal of International Money and Finance, 57, 185-199.
Guerrero, M. (2003). Analisis estadistico de series de tiempo economicas. En Guerrero, M. Analisis estadistico de series de tiempo económicas (Segunda ed., págs. 265-272). Editorial Thomson.
Herrera, J. (2016). Foreign exchange market interventions under inflation targeting: Tha case of Guatemala. Journal of International Financial Markets, Institutions & Money, 42, 101-114.
Hu, M., Li, Y., Yang, J. & Chao, C. (2016). Actual intervention and verbal intervention in the Chinese RMB exchange rate. International Review of Economics and Finance, 43, 499-508.
Meriño, V. (2018) (Editor) Gestión del conocimiento: Perspectiva Multidiciplinaria. Vol. 8 Fondo Editorial Universitario de la Universidad Sur del Lago “Jesús María Semprúm”.
Mosugu, J. K., & Nieting, A. E. (2016). Intervention Analysis of Nigeria’s Foreign Exchange Rate . Journal of Applied Sciences and Environmental Management, 20(3), 891-894.
Pelinescu, E. (2014). Volatility analysis of the Romanian exchange rate. Procedia Economics and Finance, 8, 543-549.
Standard & Poor's. (2016). Standard & Poor's. Obtained from: https://www.standardandpoors.com/es_LA/web/guest/regulatory/ratings-lists
Uribe, J., Fajardo, E. y Romero, H. Incidencia de las políticas públicas de empleo sobre la desocupación en Colombia: un análisis de intervención para el periodo 2002-2014. Revista Espacios. Vol 38, Año 2017, Número 36, Pág. 22. Obtained from: http://www.revistaespacios.com/a17v38n36/17383622.html
1. Student of Economics, Universidad Santo Tomas. Contact e-mail: emanuelfer11@hotmail.com
2. Assistant Professor. Escuela de Economía, Administración y Negocios. Universidad Pontificia Bolivariana (UPB). Contact e-mail: hector.romero@upb.edu.co
3. Assistant Professor. Universidad Autónoma de Bucaramanga (UNAB). Avenida 42 No. 48 – 11, Bucaramanga - Colombia. Contact e-mail: efajardo@unab.edu.co