![]() ISSN 0798 1015
ISSN 0798 1015

![]() ISSN 0798 1015
ISSN 0798 1015
Vol. 40 (Number 3) Year 2019. Page 24
DAMANG, Kasman 1; SIDA, Armayah 2; LASISE, Sumardi 3; MUNIZU, Musran 4; MUNIR, Abdul R. 5; PONO, Maat 6
Received: 04/09/2018 • Approved: 18/12/2018 • Published 28/01/2019
ABSTRACT: The purpose of this study was to examine the effect of supply chain strategy consisting of quality strategy, flexibility strategy, responsive strategy, efficiency strategy toward business competitiveness of passion fruit industry in South Sulawesi. The number of samples was 110 business units using simple random sampling. The method of analysis used in this study is Structural Equation Modelling. This study found that all factors in supply chain strategy have a significant effect on business competitiveness except responsive strategy. |
RESUMEN: El propósito de este estudio fue examinar el efecto en la cadena de suministro compuestas de las estrategias de calidad, de flexibilidad, de pronta respuesta, de eficiencia hacia la competitividad empresarial de la industria de la fruta de la pasión en Sulawesi del Sur. El número de muestras fue de 110 unidades de negocio utilizando muestreo aleatorio simple. El método de análisis utilizado en este estudio es el modelado de ecuaciones estructurales. Este estudio encontró que todos los factores en la estrategia de la cadena de suministro tienen un efecto significativo en la competitividad de las empresas, excepto la estrategia de pronta respuesta. |

Supply management is one of best management practices in operation management area (Heizer and Render, 2010). Supply chain management is the integration among planning, coordination, control of all business processes and activities in the supply chain to deliver superior value to consumers with the lowest cost. More supply chain emphasized the flow of materials and information while managing the supply chain emphasizes efforts to integrate a supply chain (Vorst, 2002). Supply chain is one approach that can be used to solve the problem of consumer needs to the product. The supply chain includes not only manufacturing and suppliers, but also transportation, warehousing, retailing, and consumers themselves. The main purpose of the supply chain is to satisfy the needs of the customer so that the company gets a profit. The activity of the supply chain begins with consumer demand and ends when the customer or customer has been satisfied (Bowershox, 2000; Pujawan, 2005; Chopra and Meindl, 2007).
Moreover, supply chain management is a set of approaches applied to efficiently integrate suppliers, entrepreneurs, warehouses, and other storage areas so that products can be distributed with the right quantity, place and time so as to minimize costs and satisfy customers. Supply chain management is the integration of procurement activities of materials and services, conversion into intermediate and final products, and delivery to customers that include purchasing and outsourcing activities, plus other functions essential to the relationship between supplier and distributor (Heizer and Render, 2010).
Supply chain management aims to make the entire system efficient and effective, minimizing costs from transportation and distribution to raw material inventories, in-process materials and finished goods. Some of the major players who have an interest in supply chain management are manufacturing suppliers, distributors, retailers, and consumers (David et.al. in Indrajit and Djokopranoto, 2006). Supply chain management as an approach to unite suppliers, manufacturing, warehouses, and other storage places efficiently so that the product can be produced and distributed with the right amount, right location and the right time to reduce costs and meet customer needs (Simichi-Levi et al., 2000).
According to Aramyam et al. (2006), the development of a supply chain performance measurement system needs to take into consideration the specific characteristics of the supply chain to be measured. Furthermore, Lau et al. (2002) stated partnerships among members in the supply chain were carried out to ensure product quality and supply chain effectiveness, which in turn will achieve optimal results. Demirbag et al. (2006) confirmed that optimal company performance can be seen from its operational performance. Operational performance is needed when a company wants to meet customer satisfaction, emphasizing the internal business processes, and activities that are directed to improve innovation in the organization. Therefore, operational performance measurement is very important for an organization, in order to achieve both efficiency and optimal business performance.
The objectives of this research are: (1) to identify factors influencing the competitiveness of SMEs in South Sulawesi, (2) to test and analyze the influence of supply chain strategy consisting of quality strategy, flexibility strategy, responsive strategy and efficiency strategy to competitiveness of Passion Fruit Industry in South Sulawesi. Based on the results of theoretical and literature studies, the conceptual model of this study can be presented in the following figure.
Figure 1
Conceptual Model
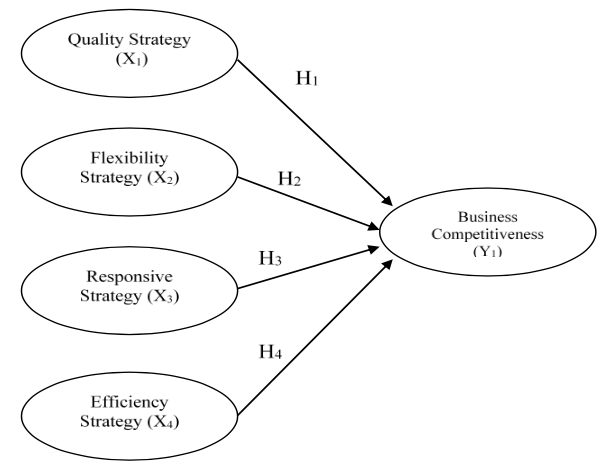
Based on the conceptual framework model above, it can be formulated research hypothesis as follows:
1. Quality strategy has a significant effect on business competitiveness (H1)
2. Flexibility strategy has a significant effect on business competitiveness (H2)
3. Responsive strategy has a significant effect on business competitiveness (H3)
4. Efficiency strategy has a significant effect on business competitiveness (H4)
This study was conducted in South Sulawesi Province, especially in Makassar City and Gowa Regency. Selection of sample districts is based on the consideration that the location is one of the centers of fruit processing passion fruit in South Sulawesi Province. The population of this study was Passion fruit industry in Makassar city and Gowa Regency with total of 240 business units. Sample determination based on SME criteria or definition according to BPS based on total workforce. Small industry has a workforce of 5-19 people, while the medium Industry has a workforce of 20-99 people. The minimum sample size is 100 business units.
This study uses secondary data and primary data. The required primary data were collected by questionnaire, interview and observation techniques. The questionnaire technique was done by giving a list of questions to the respondent. Interview technique was conducted by direct interviews to respondents and using questionnaires as a guide that contains a number of questions that have been established or in accordance with the needs in this study. Observation technique was done to complete the possibility of data that cannot be netted by the technique of questionnaire and interview technique through observation on object under study.
Validity testing is done through item analysis by Pearson Product Moment Correlation method. Validity test with this method is done by correlating the score of answers obtained on each item with the total score of the overall item. An indicator / item is said to be valid if it has a value of r > 0.30 (Ghozali, 2011 in Munir and Bata Ilyas, 2017). While the reliability test conducted to determine the reliability of an instrument or measuring instrument. Test reliability using coefficient Alpha Cronbach (α). An instrument can be said reliably if the value of α is greater than 0.60 (Hair et al., 2011; Sugiyono, 2012). The method of analysis was used in this study are: (1) Descriptive Analysis and (2) SEM analysis (structural equation model). The research data was processed using IBM SPSS and AMOS 23 software.
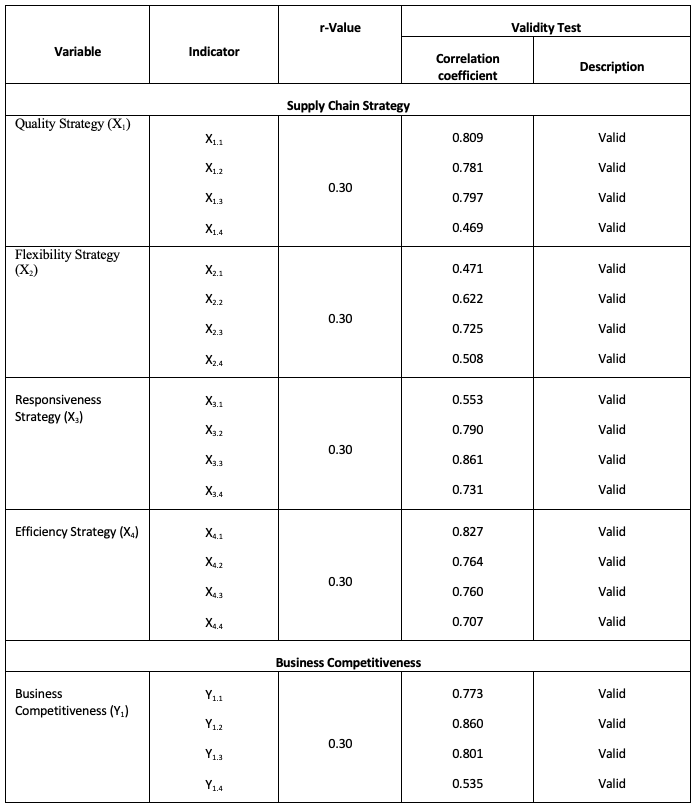
Test the validity of a questionnaire instrument aims to measure the validity or validity of a questionnaire instrument. A questionnaire is said to be valid if the question or statement in the questionnaire is able to reveal something that will be measured. To ensure this, it will be analyzed item / indicator by using the method of Pearson Product Moment correlation. The high correlation coefficient value indicates the suitability between the item function with the overall measuring function or the instrument can be said to be valid. An indicator is valid if the correlation coefficient value is: r critical / standard > 0.30.
The complete test results of the validity of the questionnaire instrument can be seen in the following table.
Table 1
Validity Test Result of Research Instrument
Source: Research findings
In accordance with the results shown in the table above, it can be concluded that all indicators used in this study was valid because it has a value of correlation coefficient greater than the standard value (r > 0.30). Therefore, this research questionnaire can be used for collecting data.
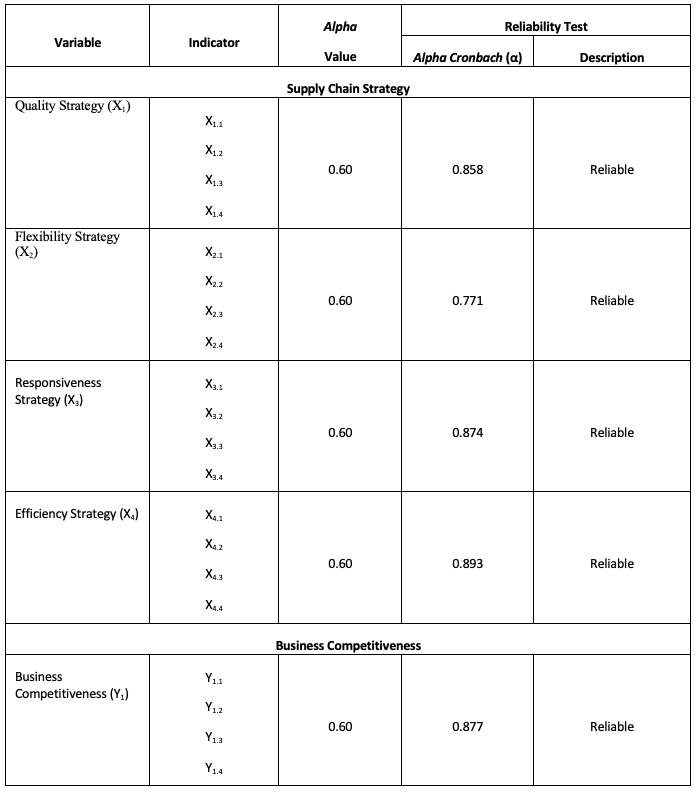
Reliability test was conducted to determine the reliability of instrument. An instrument was said reliable if the tool has ability to produce consistent results. This study used reliability of internal consistency by using Alpha Cronbach coefficient (α). An instrument can be said reliably if the value of α > 0.60. (Hair et al., 2011; Sugiyono, 2012). The complete test results reliability of the questionnaire instrument can be seen in the following table.
Table 2
Reliability Test Results of Research Instruments
Source: Research findings
Based on the results shown in the table above, it can be concluded that the variables and indicators used in this study was reliable, because Alpha Cronbach (α) value is greater than standard value (α > 0.60). Therefore, this questionnaire can be used for collecting data.
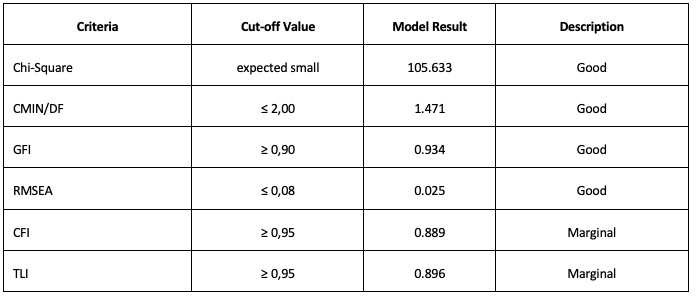
Hypothesis testing begins with a confirmation of indicators that make up each variable in the research model. The conformity test of the structural equation model is based on the cut-off values as used in the confirmatory factor analysis (CFA). The result of examination of suitability level of structural model of causality relation of quality, flexibility, responsive, and efficiency aspects to business competitiveness was presented in the following table.
Table 3
Test Result Goodness of fit indices Overall Model
Source: Research findings
The test result on several criteria of suitability of the structural model shown in the table shows that from 6 (six) criteria of goodness of fit indices, there are 4 qualified criteria, while the other 2 criteria are CFI and TLI is not good (marginal). However, based on the theory / principle of parsimony theory, that if one of the criteria has met, then the model is acceptable and no longer needed to be modified (Hair et al., 2011; Solimun, 2012).
Therefore, it can be concluded that the model is acceptable and can be used to estimate and analyze the results of further research. Furthermore, the result of the structural model of influence between variables in this study was presented in the figure below.
Figure 2
Structural Model Result
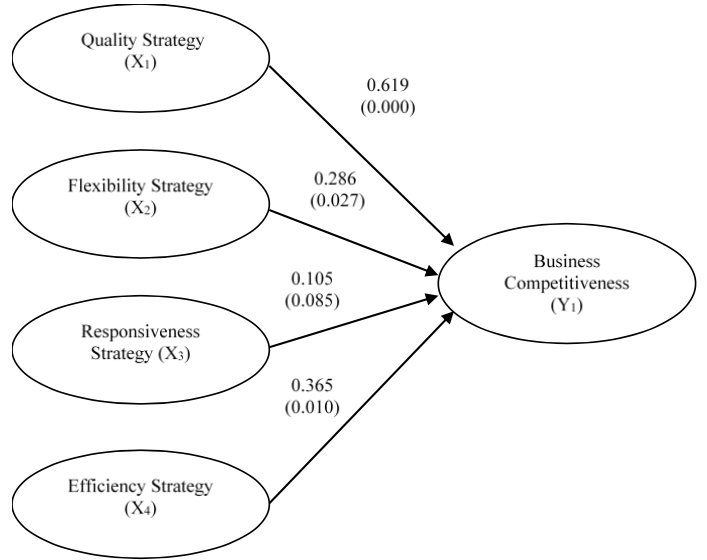
Based on the figure of the structural model above, then, it can be presented the results of hypothesis testing of this study as shown in the following table.
Table 4
Research Hypothesis Testing Results
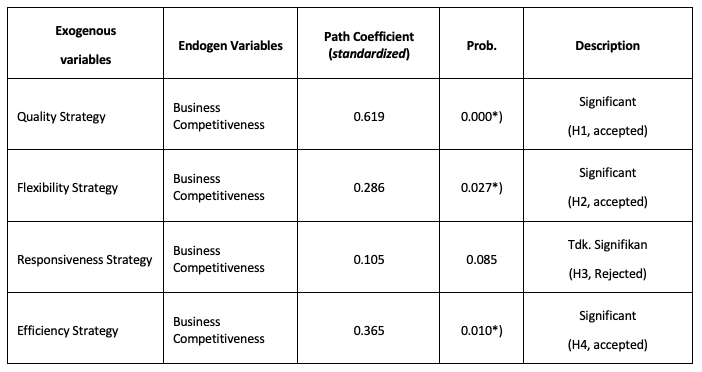
Source: Research findings
*) significant at α ≤ 0.05
Based on the results of hypothesis testing in the above table, it can be seen that there were 3 hypotheses accepted in the study, namely hypothesis-1 (H1), hypothesis-2 (H2), and hypothesis-4 (H4). Whereas hypothesis-3 (H3) was rejected. The results showed that the quality strategy has a significant effect on business competitiveness. More qualified the product will produce the higher competitiveness of the company. Then, flexibility strategy has a significant effect on business competitiveness. High flexibility in delivering products can lead to increased product competitiveness in the market. Responsive strategy has no significant effect on business competitiveness. It is an indication that rate of responsiveness of passion fruit industry is still low on changing consumer tastes, thus affecting competitiveness.
In addition, efficiency strategy has a significant effect on business competitiveness. The more efficient in operation of the company, the business competitiveness will be better. The results of this study are consistent with Ritonga (2005); Hani (2007), and Irmawati (2007) stated marketing planning variables that involving all members of the supply chain have the greatest impact on the company's supply chain management strategy. Then, variable of customer satisfaction gives the bigger contribution to both performance and competitiveness of the company. These findings were consistent with Gunasekaran et al. (2004) and Jie et al. (2008) found that quality, flexibility, and responsiveness have a positive and significant effect on competitiveness.
Furthermore, the findings of this study also in line with Munizu and Hamid (2018) that competitiveness and performance of the firms can be improved through both creativity and innovation of supply chain members (suppliers, companies and customers). Related to these findings, Chopra and Meindl (2007) stressed the important of understanding both concept and implementation of supply chain strategy to managers for getting best performance.
Quality strategy has a significant effect on business competitiveness. Product quality is one of important factor for improving business competitiveness of company. Flexibility strategy has a significant effect on business competitiveness. Therefore, flexibility strategy must be adopted by passion fruit companies for getting best business competitiveness. Then, efficiency strategy has a significant effect on business competitiveness. Managing business operation in efficient ways is very important to companies in achieving better business competitiveness. Whereas, responsive strategy has no significant effect on business competitiveness.
The results of this study provide sufficient information and data for managers of passion fruit industry in South Sulawesi to formulate appropriate strategies in improving the competitiveness of their business. In addition, some improvements need to be made by managers of company, especially on responsive strategy indicators.
Aramyan, L.H., Ondersteijn, C.l.M., Kooten, O. van, Oude Lansink, AO.J.M. (2006). Performance indicators in agrifood production chains. Quantifying the agrifood supply Chain (Wageningen UR Frontis series 15), pp. 47 - 64.
Bowersox, D. J., Closs, D. J., Stank, T. P. (2000). Ten Mega-Trends That Wil Revolutionize Supply Chain Logistics. Journal of Business Logistics, 21 (2), pp.1-16.
Chopra, S and P. Meindl. (2007). Supply Chain Management: Strategy, Planning, and Operation. USA, Pearson Prentice Hall Inc.
Demirbag, M., Ekrem T., Mehmet T., and Selim Z. (2006). An analysis of the relationship between TQM implementation and organizational Performance: Evidence from Turkish SMEs. Journal of Manufacturing Technology Management 17 (6). pp. 829-847.
Gunasekaran, A., Patel, C. and Mc Gaughey, R.E. (2004). A framework for supply chain performance measurement. International Journal of Production Economics, 87 (3). pp. 333-347.
Hair Jr., Yoseph F., Rolph E. A., Ronald L. P., William B. (2011). Multivariate Data Analysis, 6th edition, New Jersey, USA, Prentice-Hall Inc.
Hani. (2007). Supply Chain Analysis of Coconut Fruit (case study of old coconut supply chain in Bogor municipality). Faculty of Agricultural Technology, Bogor Agricultural University: Bogor.
Heizer, J., and Render, B. (2010). Operations Management, Jakarta: Salemba Empat Publishing.
Indrajit, R. E and R. Djokopranoto. (2006). Supply Chain Management Concept: A New Way of Looking at Supply Chain Supply Chain, Jakarta: Grasindo Publisher
Irmawati. (2007). The Influence of Supply Chain Management to Performance at PTPN VIII Gunung Mas Bogor. Faculty of Economics and Management, Bogor Agricultural University: Bogor.
Jie, F., Kevin A. P., Roger J., and Rodney C. (2008). Supply Chain Performance Indicators for Australian Beef Industry: An Empirical Analysis, International Journal of Production Economics, 8 (3). pp. 133-147.
Lau, H.C.W. W.K. Pang. C.W.Y. Wong. (2002). Methodology for Monitoring Supply Chain Performance: a Fuzzy Logic Approach. Logistic Information Management. Vol 15 (4). pp 271 – 280.
Munir, A. R., & Bata Ilyas, G. (2017). Extending the Technology Acceptance Model to Predict the Acceptance of Customer toward Mobile Banking Service in Sulawesi Selatan. International Journal of Economic Research, 14(4), 365-375.
Munizu, M. and Hamid, N. (2018). Mediation Effect of Innovation on the Relationship between Creativity with Business Performance at Furniture Industry in Indonesia. Quality: Access to Success Journal. Vol.19 (165). pp. 98-102.
Pujawan, I.N. (2005). Supply Chain Management. Surabaya, Guna Widya Press.
Ritonga, O.S. (2005). Analysis of Potato Commodity Marketing with Supply Chain Management Approach (SCM) in Semarang City, Central Java Province. Faculty of Agriculture, Bogor Agricultural Institute: Bogor.
Simci-levi, D., P. Kaminsky dan E. Simchi-Levi. (2000). Designing and Managing the Supply Chain: Concepts, Strategies and Case Studies. New York, USA, McGraw-Hill Inc.
Solimun. (2012). Multivariate Analysis, Structural Equation Modeling (SEM), LISREL and AMOS, FPMIPA Universitas Brawijaya Malang, UB Press.
Sugiyono. (2012). Statistics for Research. Bandung: Alfabeta Press.
Van der Vorst, J.G.A.J.A.J.M. Beulans. (2002). Performance Measurement in Agri Food Supply-Chain Networks. International Journal of Agro-food chains and networks for development, 1 (1), pp. 13-24.
1. Department of Management, Faculty of Economics and Business, Hasanuddin University, Indonesia. Contact e-mail: kas.damang@gmail.com
2. Department of Management, Faculty of Economics and Business, Hasanuddin University, Indonesia. Contact e-mail: armayah@fe.unhas.ac.id
3. Department of Management, Faculty of Economics and Business, Hasanuddin University, Indonesia. Contact e-mail: sumardi@fe.unhas.ac.id
4. Department of Management, Faculty of Economics and Business, Hasanuddin University, Indonesia. Contact e-mail: m3.feunhas@gmail.com
5. Department of Management, Faculty of Economics and Business, Hasanuddin University, Indonesia. Contact e-mail: arazak.munir@gmail.com
6.Department of Management, Faculty of Economics and Business, Hasanuddin University, Indonesia. Contact e-mail: maatpono@yahoo.com