![]() ISSN 0798 1015
ISSN 0798 1015

![]() ISSN 0798 1015
ISSN 0798 1015
Vol. 40 (Number 6) Year 2019. Page 20
KUMAR, Arya 1; BISWAL, Saroj K. 2; SWAIN, Prafulla K. 3
Received:14/10/2018 • Approved: 27/01/2019 • Published 18/02/2019
ABSTRACT: The Indian financial market recently observed volatility due to its economy. The value of rupees is reduced in Forex Market in comparison to the dollar, adding to it is the price hike in the inflation rate, gold, and oil. This paper identifies the cause and effect relationship amongst, forex, crude oil, stock markets and gold. The analysis is carried out from January 2010 to June 2018. The analysis incorporates the Granger Causality test under Vector Autoregressive (VAR) environment. The result states that none of the variables i.e. Gold, Oil, and Forex influence each other, however, the Sensex has a granger causes due to Gold, Oil, and Forex which says that any variation in Gold, oil and forex precedes the growth of Sensex in two and four weeks. |
RESUMEN: El mercado financiero indio recientemente observó volatilidad debido a su economía. El valor de las rupias se reduce en el Mercado Forex en comparación con el dólar, lo que se suma a la subida del precio en la tasa de inflación, el oro y el petróleo. Este documento identifica la relación de causa y efecto entre, el mercado de divisas, el petróleo crudo, las bolsas y el oro. El análisis se lleva a cabo entre enero de 2010 y junio de 2018. El análisis incorpora la prueba de causalidad de Granger en el entorno vectorial autorregresivo (VAR). El resultado indica que ninguna de las variables, es decir, Oro, Petróleo y Forex, se influencian entre sí, sin embargo, el Sensex tiene una causa mayor debido al Oro, Petróleo y Forex que dice que cualquier variación en Oro, Petróleo y Forex precede al crecimiento de Sensex en dos y cuatro semanas. |

Indian financial markets have faced a volatile situation in the recent past. A frequent weakening of Indian currency is observed against the dollar in FOREX markets. It raises the value of gold, oil, and rate of Inflation that force RBI to intervene and curb the inflation by its hike in policy rates. It is not new to see that any change in one market affects the other market but the degree of impact and co-movements of the different market may vary which needs to be examined. The mutual interrelation and interaction among the financial markets have been tested and proven over a period of time, with varying degree of effects. In past, gold was paid in exchange for oil purchases. Even today, huge revenues earned from oil sales due to price rise, surplus mostly gets invested into gold1. Gold acts as a hedging instrument against high inflation, during the times of recession and uncertain economic conditions, as demand for gold is high with limited supply. Historically, gold and silver standards were used to set the currency values; the value of the US dollar was linked to this bimetallic standard. Later, the dollar was valued in terms of gold standards. Introduction of Breton wood system brought an exchange rate system which is fixed; participating countries had to preserve the value of the currency in terms of US dollar, which had a fixed rate of $35 per ounce. Due to increased supply of dollar in relation to demand caused the value of the dollar to fall and it became difficult for the countries to maintain their exchange rates within a narrow margin against the dollar, this led to the end of Breton wood agreement in the 1970s. Then Smithson agreement in 1971, similar to Breton woods agreement, allowed the value of participating currencies to fluctuate in greater range against the dollar compared to Breton woods agreement that allowed the currencies to fluctuate in a narrow range against the dollar. But this agreement also failed in 1973 making the same mistake as that of Breton wood agreement. As no more agreements were made, the free-floating system was adopted to value currencies. The underlying factor that drives forex markets today under free float system is demand and supply for the currency2.
In last 15 years, Indian currency is found to be depreciated in comparison to the dollar when India progressed towards the market-determined rate of exchange since 1993. However, India has seen period i.e. 2003 to 2005 and during 2007-08 when the value of Indian currency appreciated in comparison to the dollar with the huge inflow of capital. Depreciation in the value of the currency was observed during 1997, 2008, 2011 and 2012. In the year 1997, India witnessed a huge deficit in current accounts, rise in interest rates, and a slow economic growth. The fall of Indian currency during 2008 was due to outflows of capital and declaration in exports. During 2012 and 2013 the fall in the value of rupees was due to the reduction of capital flows. Especially, in 2017 and 2018 has been a period of anxiety as the rupee has been depreciating drastically against the dollar, raising a concern to the economists, policymakers, traders, investors, and academicians. When an economy feels that currency is devaluating/ appreciating beyond heights, government interferes and tries controlling these fluctuations by increasing or curbing the money supply in the market. These fluctuations in the exchange rate affect the profitability of companies importing/ exporting goods overseas and thereby affecting its market share. And due to this, the stock index on which these companies are listed is also affected. The inflow/ outflow of FDI and FIIs into the economy depend on the appreciation/depreciation of the currency and thereby affecting the volatility in stock markets. Even Oil price increase affects the company’s profitability as, the cost of energy consumption increases, thereby affecting the stock market returns indirectly. When the stock market becomes highly volatile, risk-averse investors opt for gold as a safe investment avenue. Since 2013, the Indian rupee was the biggest loser among Asian currencies in terms of its value, because of its Current Account Deficit which touched its record high and Fiscal Deficits. In the past few months, India’s exports had slowed down due to less demand for its goods/ services from two most important consumer markets - US and Europe markets. On the other hand, huge imports of gold and crude oil increased the CAD of the country. To understand these complex relations, the study tries to find out the causal relationship between the variables.
(Patro, Wald, & Yangru, 2009) a study is carried on the devaluation of the currency, which states that currency devaluation is depended on local stock markets even there lies a significant abnormal return negatively a year before the devaluation announcement. The value of the dollar in the equity market comes down than that of the currency devaluation, and in comparison to the stock market of developing country the devaluation is affected more negatively.
(Samanta & Ali, 2012) the analysis is carried on Dow-Jones Industrial Index to study the world World Gold price, World Oil price, US Stock price co-movements, which shows none of them move simultaneously. The result shows the gold and stock prices moves on their own whereas the rate of exchange and prices of oil moves due to other variables. (John) Measuring the degree of relation between the nominal Australian / United States rate and prices of Indexed Commodity which shows a negative correlation and dual causality. While a strong cause and effect are found from prices of the commodity to the exchange rate of AUD/USD.
(Wang, Ching-Ping, & Tzu-Ying, 2014) the analysis is carried on stock markets in China, Germany, Japan and Taiwan to ascertain the co-integration existence between prices of gold, oil and dollar rates vs. various currencies. The result of such variables shows stable relations in long-term. While the output gives no existence of a co-integration relation between the variables and no long-term stable relationship is observed between the indices of U.S. stock market and prices of Oil, exchange rate, gold, and the index of U.S. Stock Market. In addition, a two-way feedback relation is identified in prices of gold, stock, and oil through causal relation test of Taiwan.
(K. S. Sujit and B. Rajesh Kumar, 2011) the study is done to identify the changes in other variables. The stock market has less impact on the exchange rate. The study states that out of two, one model has a weak relation between the variables in long term.
(Larry A. Sjaastad) the study carries the relationship between the prices of gold and some of the major exchanges. The data considered for the analysis is from January 1991 through June 2004 of the Spot and forward prices of gold. The exchange rates of forwards and spot are considered between the U.S. Dollar, the Japanese yen, and the UK pound. The data is collected from IMF. A true rise and fall of exchange rates against US dollar have affected the denomination in prices of gold. The country with a major gold producer in the world shows no significant impact on the gold prices throughout the world. The study states that nowadays gold is not a store of value like early period against the inflation.
(Deepti Gulati, Monika Kakhan 2016) by using the Granger causality and co-relation an attempt has been made to establish the relationships among Indian stock market and exchange rates for a series of data from 2004 to 2012. The objective of the research is to find out the two side relation between foreign exchange rates and closing stock price. Evaluation of INR/ $ is made against Nifty50 and Sensex. From the study, it is found that there exists no cause and effect relation in between Nifty50 and Sensex and INR/$. Further analysis confirms the correlation between Sensex and Nifty50 which is less positive. Finally it is concluded that the stock market and the exchange rate has no relation and the fluctuation in price is due to other factors.
(Jana Simakova) the study comprises the market specification of commodity trading and finding the relation between gold and oil price. Vector error correction model and the Johansen co-integration test are conducted between the variables to understand the asymmetric co-integration relationship. The result of the analysis states a positive correlation and long-run relationship between oil prices and gold, the output also confirms the relationship between the variables that there exist causal relation. Interestingly by conducting the correlation analysis, it is found that the inflation rate, interest rates industry and gold mining companies stock prices affect the prices of oil and gold.
(Nicholas Apergis 2016) the analysis consists of precious metals i.e. silver and gold, the stock market and several other macroeconomics factors to identify the character of spillovers volatility. The analysis is carried on G7 countries for a period from 1981 to 2010. The result is concluded by using the FAVAR model (Factor-Augmented Vector Auto Regression) that the prices of gold and silver are affected more due to various factors of macroeconomics while there exist less impact of financial markets. Hence, it's confirmed that investors are more prone to macroeconomics environment rather than financial market while dealing with the precious metals.
(Lucia de las Nieves Morales 2008) a study is made on six counties of Latin America and a European economy to identify the spill over volatility in between several exchange rates and stock returns. The analysis includes a period from 1998-2006. The analysis divides the study as pre and post Euro introduction. The result states that the volatility of exchange rates affect the volatility stock returns through the EGARCH model. But there is no significant spillover volatility from stock market returns and exchange rates.
(Desislava Dimitrova 2005) a study is conducted using short-run model, open economy and multivariate model to understand the link between exchange rates and prices of the stock market. The result gives rise to the rising trend in the stock market during the short run which may lead to a depreciation in currency while the fall in the stock market is due to weak currency. The analysis is carried out for a period from 1990 to 2004 in the US and UK. The study confirms that there exists a negative link when exchange rates are the leading variable and it is found to be positive when stock prices are the leading variable.
(Syed Abul Basher, Alfred A. Haug, Perry Sadorsky 2014) a study is conducted using the VAR model to find the existence of a relation between prices of oil and stock and relation between exchange rates and prices of oil. The output states that a rise in prices of oil affects the prices of stock negatively while the rise in prices of stock leads to rising of prices of oil. The study says that the oil price has a negative relation to the unexpected rise in the supply of oil while the prices of oil have a positive relation to an unexpected rise in demand.
The paper tries to identify the causal relationship amongst forex, gold, stock market and oil. From the World Gold Council, the weekly gold spot prices are used in terms of dollar, from OPEC the oil spot prices is withdrawn from the website of IMF the data of Exchange rate (rupee/dollar) is taken lastly from the BSE the data of closing price of Sensex is considered. The period considered for analysis is from January 2010 to June 2018. For the analysis, the methods used are Granger Causality test under Vector AutoRegressive (VAR) environment.
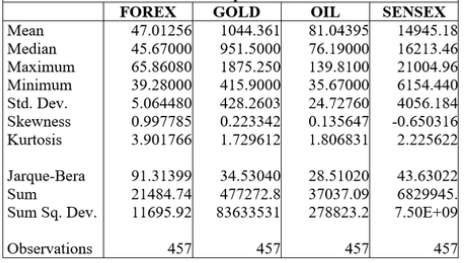
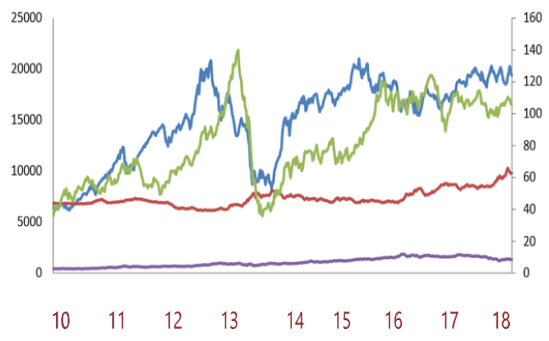
From the above table, it can be noticed that gold and Sensex has a high standard deviation when compared to Forex and Oil indicating higher variability. The figures for skewness and kurtosis reveal that the variables are non-symmetrical in nature and also are not mesokurtic. The following graph shows the time series of Sensex, Oil, Gold and Forex Prices for a period from January 2010 till June 2018. It is evident from graph 1 that gold and forex were less volatile than Sensex and oil. Oil prices had reached its peak in mid-2013 and its lowest in early 2014 and since then it has been fluctuating within this range. Sensex almost followed the same trend as oil prices. Whereas rupee value saw comparatively higher fluctuations in 2010 – 11 and since then it has been increasing. Less variation was seen in respect of gold prices for the period under observation.
Table 1
Descriptive Statistics
------
Graph 1
Time Series of Sensex Oil, Gold and Forex
-----
Table 2
Pairwise Granger Causality Tests
Granger Causality Test (Pairwise)
Test Sample: 1/03/2010 7/23/2018
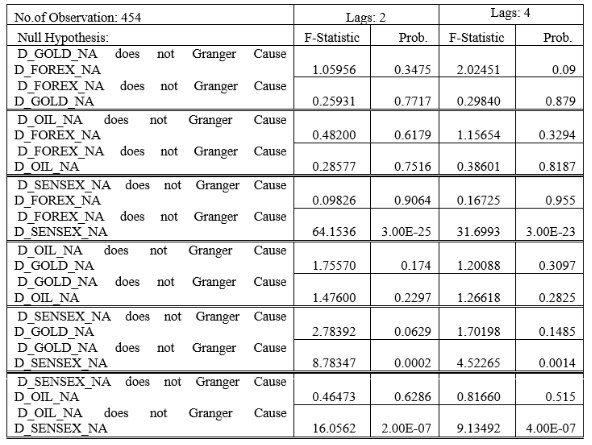
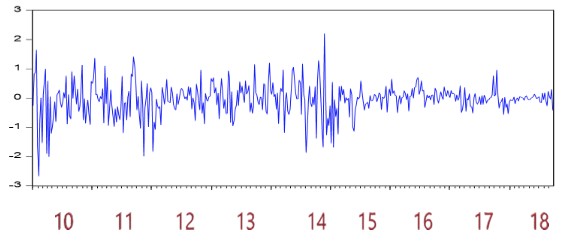
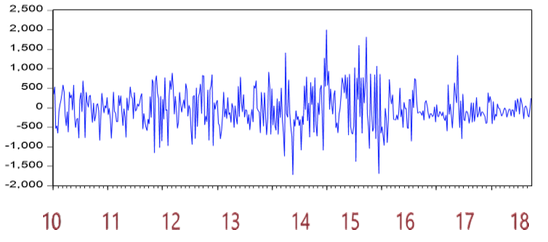
A time series helps to forecast another time series (Granger Causality, 1969), the past value of one variable helps to identify the current value of one variable. It is essential that the series to be stationary for Granger Causality Test and hence the variables are taken at First Level difference (shown in the above charts). In spite of the change in lags, the results remain the same. It can be seen from the above table that Forex does not contribute towards the development and forecasting of gold and oil. On the other hand, changes in forex precede the Sensex development in two and four weeks. Gold, Oil, and Forex do not influence each other. Gold, Oil and Forex Granger Causes Sensex independently, which means Gold, Oil, and Forex changes precede the Sensex development in two and four weeks. We run an Ordinary Least Square Model with Sensex as dependent and Oil, Gold and Forex as independent variables to test the extent of influence on Sensex and arrive at the following equation –
D_SENSEX_NA = 369.0547*D_FOREX(-1) + 59.66827 *D_FOREX(-2) + 0.463473*D_GOLD(-1) + (-0.517527)*D_GOLD(-2) +18.24898 *D_OIL(-1) + 9.773664 *D_OIL(-2) + (-0.084335) *D_SENSEX(-1) + 0.117085*D_SENSEX(-2) + (-43.20742)
Graph 2
Gold Prices at First Difference
d_GOD NA
-----
Graph 3
Forex Rate at First Difference
d_FOREX NA
-----
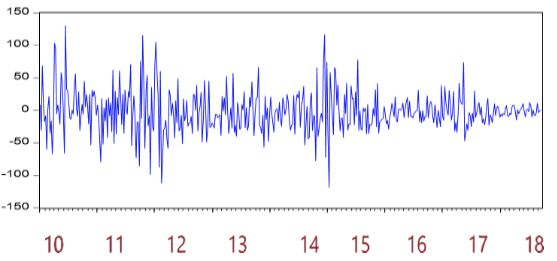
Graphic 4
Sensex at First Difference
d_SENSEX NA
From the above findings, the study concludes that forex granger causes Sensex, as the exporting/ importing companies listed on BSE Sensex are affected by fluctuations in rupee against dollar, thereby affecting their profitability and in turn reducing the stock returns (Sensex returns). At the time of high volatility in the stock market, high inflation in the economy or during recession investors moves from the stock market to gold, thereby increasing the price of gold. As seen in past few months since Jan 2013, gold prices in international markets reduced, the reason being US economy recovery causing the dollar to get stronger against the rupee. But gold imports in India did not reduce, affecting the economy’s CAD causing the exchange rate to fluctuate and in turn, affecting the stock market (Sensex) returns. In other words, gold granger causes Sensex. Also oil prices granger cause Sensex, as oil price increase/ decrease, the cost of energy consumption by companies rises/ reduces, affecting the cash flows of companies listed on BSE (Sensex) and thereby resulting in increase/ decrease in stock market returns. By and large, this study concludes that Sensex is caused by Oil, Gold, and Forex. Further research can be done on various other macroeconomic factors to identify the relationship between these variables.
Harri, L. N. (2009, August). The Relationship between Oil, Exchange Rates, and Commodity Prices. Journal of Agricultural and Applied Economics.
http://www.gold.org/download/value/stats/statistics/xls/gold_prices.xlsArdian
Huang, M.-L. W.-P.-Y. (2010). Relationships among Oil Price, Gold Price, Exchange Rate and International Stock Markets. International Research Journal of Finance and Economics (Issue 47 (2010).
J. L. (n.d.). THE RELATIONSHIP BETWEEN COMMODITY PRICES AND THE AUSTRALIAN DOLLAR.
Kumar, K. S. ((2011)). STUDY ON DYNAMIC RELATIONSHIP between GOLD PRICE, OIL PRICE, EXCHANGE RATE AND STOCK MARKET RETURNS. International Journal of Applied Business and Economic Research, Vol. 9, No. 2,
Patro, D. K., Wald, J. K., & Y. W. (2009). Currency Devaluation and Stock Market Response: An Empirical Analysis.
S., S. K., & R. K. (2011). STUDY ON DYNAMIC RELATIONSHIP between GOLD PRICE, OIL PRICE, EXCHANGE RATE AND STOCK MARKET RETURNS. International Journal of Applied Business and Economic Research, Vol. 9, No. 2, (2011): 145-165.
Sadorsky, S. A. (September 2010). Oil Prices, Exchange Rates and Emerging Stock Markets. University of Otago Economics Discussion Papers No. 1014 (ISSN 1178-2293).
Samanta, S. K., & A. H. (2012). Co-Movements of Oil, Gold, the US Dollar, and Stocks. Scientific Research, Modern Economy, 2012, 3, 111-117.
Šimáková, J. (n.d.). Analysis of the Relationship between Oil and Gold Prices.
Sjaastad, L. A. The Price of Gold and the Exchange Rates: Once Again.
Wang, M.-L., C.-P. W., & T.-Y. H. (2014). Relationships among Oil Price, Gold Price, Exchange Rate and International Stock Markets. International Research Journal of Finance and Economics, ISSN 1450-2887 Issue 47 (2010).
1. Research Scholar, Faculty of Management Sciences, Siksha O Anusandhan (Deemed to be University), aryantripthathy@yahoo.com
2. Associate Professor, Faculty of Management Sciences, Siksha O Anusandhan (Deemed to be University), sarojkantabiswal@soa.ac.in
3. Professor, Faculty of Management Sciences, Siksha O Anusandhan (Deemed to be University), prafullaswain@soa.ac.in