![]() ISSN 0798 1015
ISSN 0798 1015

![]() ISSN 0798 1015
ISSN 0798 1015
Vol. 40 (Number 7) Year 2019. Page 6
PINKOVTSKAIA , Iuliia S. 1; BALYNIN, Igor 2; ARBELAEZ CAMPILLO, Diego F. 3; ROJAS BAHAMON, Magda J. 4
Received: 19/10/2018 • Approved: 04/03/2019 • Published 04/03/2019
2. Methods and techniques of scientific research
3. Results of scientific research
ABSTRACT: The article presents the results of the assessment of changes in the sectoral structure and number of employees of small enterprises in the Russia. Authors have developed models that describe the distribution by regions of the country of specific values of the number of employees per enterprise. The development was based on information characterizing the indicators of the number of jobs replaced per enterprise in 2015-2016 on aggregates of enterprises located in each of the regions of Russia. |
RESUMEN: El artículo presenta los resultados de la evaluación de los cambios en la estructura sectorial y el número de empleados de las pequeñas empresas en Rusia. Los autores han desarrollado modelos que describen la distribución por regiones del país de valores específicos del número de empleados por empresa. El desarrollo se basó en la información que caracteriza los indicadores del número de empleos reemplazados por empresa en 2015-2016 en agregados de empresas ubicadas en cada una de las regiones de Rusia. |

The importance of the problem of accelerated development of small enterprises (hereinafter - SE) in all regions of Russia is defined in the relevant Federal strategy for the period up to 2030 (The strategy for the development, 2016). One of the goals of the strategy is to increase the share of workers in small and medium-sized enterprises to 35 percent of the total number of employed people. Given the above, a study of the level of development of small business and, in particular, its current structure and number of employees seems relevant.
In recent years, a number of works by domestic authors have been published, devoted to the study of the structure of small business in certain regions. The greatest interest among them are articles by Sitnikova E.V., Olabina V.V., Pidojmo L.P. about Kursk region (Sitnikova et al., 2016), by Abdullina S.N., Safiullina K.G., Gataullina L.R. about Republic of Tatarstan (Abdullina et al., 2016), by Dubynina A.V., Demyanov D.G. about Chelyabinsk region (Dubynina et al., 2015), by Makhmudova M.M., Korolev A.M. about Tyumen region (Makhmudova & Korolev, 2015), by Rakhmanova M.S., Schneider V.V. about Primorsky Krai (Rakhmanova & Schneider, 2018). Trends in the development of enterprises in Russia in the context of Federal districts and large municipalities are considered in the article by Zilberstein O. B., Shklyar T.L. Avtonomova S.A., Shilina M. G. (Zilberstein et al., 2018). The works (Sorokina, 2016; Zakirova, 2015) considered the sectoral features of the activities of small enterprises. At the same time, the key performance indicators of small enterprises were previously considered (without regional specification) in 2011-2013 (Balynin, 2013), and then small and medium enterprises (Pinkovetskaia & Balynin, 2018). At the same time, unfortunately, to the integrated analysis of the existing number and number of employees of the SE, up to now, not enough attention has been paid.
For small enterprises, in accordance with the current Russian legislation (On the development of small and medium businesses, 2007) are legal entities with up to 100 employees. In addition, the criteria are the share of state and municipal property in the authorized capital and the marginal values of the proceeds from the sale of goods (works, services), as well as the book value of assets.
The purpose of the study, the results of which are presented in this article, was to study the sectoral structure of small business, as well as to determine patterns that are characteristic of the current number of employees employed in one small enterprise across Russian regions. At the same time, the following tasks were solved: the main types of economic activities in which small enterprises were most widely used were identified, for each of them an assessment was made of the distribution of the number of employees in small business enterprises by region, as well as changes in these indicators in 2016 compared to 2015.
One of the important indicators of business activity is the specific number of employees per enterprise. This indicator is of great practical importance, since it is necessary for solving a wide range of small business development tasks. It is used in justifying the estimated need for labor resources, in planning and forecasting the development of the business sector in the regions.
As shown in the paper (Pinkovetskaya, 2015), modeling the distribution of the relative values of indicators characterizing the activities of the aggregates of enterprises formed on a territorial basis, it is advisable to carry out using the density functions of the normal distribution. This article presents the methodology and tools for assessing the parameters of such functions, as well as the requirements for the source data that were used in the research process.
The functions developed in the process of modeling make it possible to identify patterns characteristic of the current values of the number of employees of small enterprises, and in particular, the average values of specific indicators, as well as their differentiation by regions of Russia.
The study was based on data on the number of small enterprises and the number of employees employed in them in 2015 and 2016. These data were taken based on the results of official statistical observations of the activities of the SE in Russia (Federal State Statistics Service, 2017). The data characterizing the aggregate of SE located in 82 regions of the country, including 22 republics, 9 territories, 46 regions, 1 autonomous region, 1 autonomous region and 3 cities of federal significance were taken into account.
In fig. 1. presents the dynamics of changes in the number of small enterprises in the Russian Federation in 2011-2015. in the context of economic activities: agriculture (TEA A), fishery, fish farming, (TEA B), mining (TEA C), manufacturing industries (TEA D), production and distribution of electricity, gas and water (TEA E), building (TEA F), wholesale and retail trade (TEA G), hotels and restaurants (TEA H), transport and communication (TEA I), financial activities (TEA K), real estate transactions (TEA L), education (TEA M), health care (TEA N), provision of communal, social and personal services (TEA O).
Figure 1
Dynamics of the number of small enterprises in terms of types of economic activity in 2011-2016.
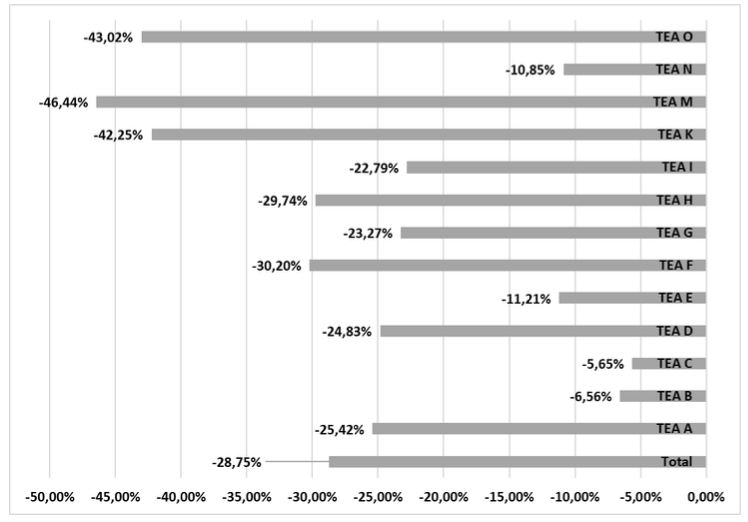
The analysis showed that in all types of economic activity the number of enterprises decreased. So, in particular, the greatest changes were revealed in education (-46.44%), the provision of other communal, social and personal services (-43.02%) and real estate operations, leasing and the provision of services (-42.25%). At the same time, the smallest changes were recorded in mining (-5.65%), fishing and fish farming (-6.56%).
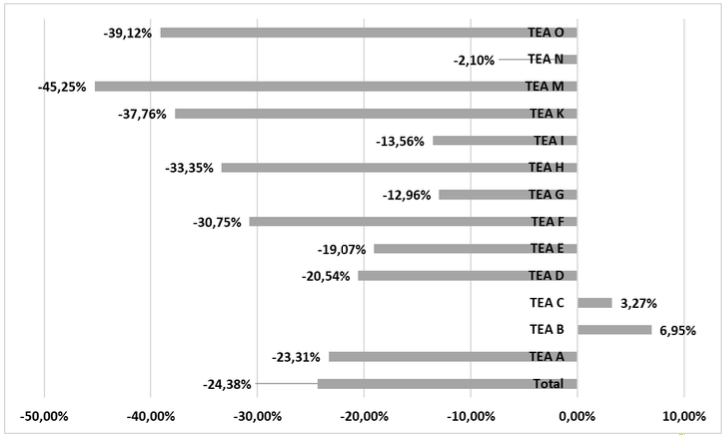
Figure 2 presents the dynamics of changes in the number of employees in various types of economic activity. It is important to note that against the background of a decrease in the number of people employed in small businesses by 24.38%, growth was recorded in two types of economic activity: in fisheries and fish farming (by 6.95%) and mining (by 3.27%).
Figure 2
Dynamics of the number of number of employees in terms of types of economic activity in 2011-2016.
A fragment of empirical data on the example of small enterprises specialized in manufacturing industries located in six regions is given in table 1. In this table, along with the number of SE and the number of employees employed in them (listed in columns 3 and 4 of table 1) are also presented in the column 5 the results of calculations of the number of employees per enterprise in the relevant region.
Table 1
Fragment of empirical information on small manufacturing enterprises in six regions
No. |
Regions of Russia |
Number of workers, thousand people |
Amount small enterprises, thousand |
Number of employees per enterprise, pers. |
1 |
Belgorod region |
17,6 |
2,5 |
7,0 |
2 |
Bryansk region |
11,6 |
1,4 |
8,3 |
3 |
Vladimir region |
27,8 |
3,0 |
9,3 |
4 |
Voronezh region |
21,8 |
3,0 |
7,3 |
5 |
Ivanovo region |
25,3 |
3,2 |
7,9 |
6 |
Kaluga region |
16,6 |
2,1 |
7,9 |
|
… |
… |
… |
… |
Source: compiled and calculated by the authors
The data on the number of small enterprises and the number of their employees in Russia, as well as the existing structure of these indicators by type of economic activity in 2016, are shown in Table 2. For comparison, similar data for 2015 is presented in parentheses.
Table 2
Characteristics of small enterprises
No. |
Types of economic activity |
Amount small enterprises, thousand |
Weight,% |
Number of workers, thousand people |
Weight,% |
1 |
2 |
3 |
4 |
5 |
6 |
2 |
Всего |
2770.6 (2222.4) |
100.0 (100.0) |
11040.1 (11330.7) |
100.0 (100.0) |
3 |
Agriculture |
61.3 (56.2) |
2,2 (2.5) |
474.5 (417.7) |
4.3 (3.7) |
4 |
Fishing, fish farming |
4.8 (4.2) |
0.2 (0.2) |
25.7 (23.8) |
0.2 (0.2) |
5 |
Mining |
10.3 (8.6) |
0.4 (0.4) |
57.7 (60.2) |
0.5 (0.5) |
6 |
Manufacturing industries |
245.8 (210.5) |
8.9 (9.5) |
1609.6 (1716.7) |
14.6 (15.2) |
7 |
Production and distribution of electricity, gas and water |
15.7 (13.7) |
0.6 (0.6) |
145.3 (158.1) |
1.3 (1.4) |
8 |
Construction |
336.0 (262.7) |
12.1 (11.8) |
1403.1 (1361.4) |
12.7 (12.0) |
9 |
Wholesale and retail trade |
1032.1 (801.8) |
37.3 (36.1) |
3183.7 (2974.9) |
28.8 (26.3) |
10 |
Hotels and restaurants |
79.4 (67.5) |
2.9 (3.0) |
444.5 (487.0) |
4.0 (4.3) |
11 |
Transport and communication |
215.4 (153.5) |
7.8 (6.9) |
690.4 (724.3) |
6.3 (6.4) |
12 |
Real Estate Operations |
600.7 (503.8) |
21.7 (22.7) |
2322.1 (2657.0) |
21.0 (23.4) |
13 |
Education |
9.9 (8.1) |
0.4 (0.4) |
23.2 (22.9) |
0.2 (0.2) |
14 |
Health care |
42.6 (37.5) |
1.5 (1.7) |
276.8 (310.4) |
2.5 (2.7) |
15 |
Provision of community, social and personal services |
75.0 (60.9) |
2.7 (2.7) |
287.1 (324.9) |
2.6 (2.9) |
Source: compiled and calculated by the authors
Analysis of the data given in Table 2 shows that for the period from 2015 to 2016 there was a significant (almost 25%) increase in the number of small enterprises. At the same time, there was a decrease of 2.6% in the number of employees. The increase in both the number of SE and the number of employees was observed only in such activities as wholesale and retail trade, construction, agriculture, as well as fishing and fish farming. The distribution of the number of enterprises and the number of employees for the period considered in the table has not undergone significant changes. The most widespread in Russia were commercial enterprises, which accounted for more than a third of all small enterprises. A significant proportion are also enterprises specialized in real estate operations (about 22%). The specific weight of transport and communication enterprises, processing industries and construction are in the range from 7% to 12%. These same activities dominate the structure of the number of employees of small enterprises. In total, these five types of economic activity accounted for 87.8% of enterprises in 2016 (87% in 2015) and 83.4% of workers employed in small businesses in 2016 (83.3% in 2015). Thus, the total share of MPs of these five types of activity has remained almost unchanged over the year.
The share of MPs related to each of the eight other activities is significantly less. Taking this into account, we further consider the specific number of employees per small enterprise belonging to the five main types of economic activity: wholesale and retail trade, real estate, transport and communications, manufacturing, and construction.
At the next stage of work, the authors developed models describing the distribution by regions of the country of specific values of the number of employees per enterprise, established both in all small enterprises as a whole and in five main types of economic activity. The development of these models was based on information characterizing indicators of the number of jobs replaced per enterprise in 2015 and 2016, on the aggregate of enterprises located in each of the regions of Russia.
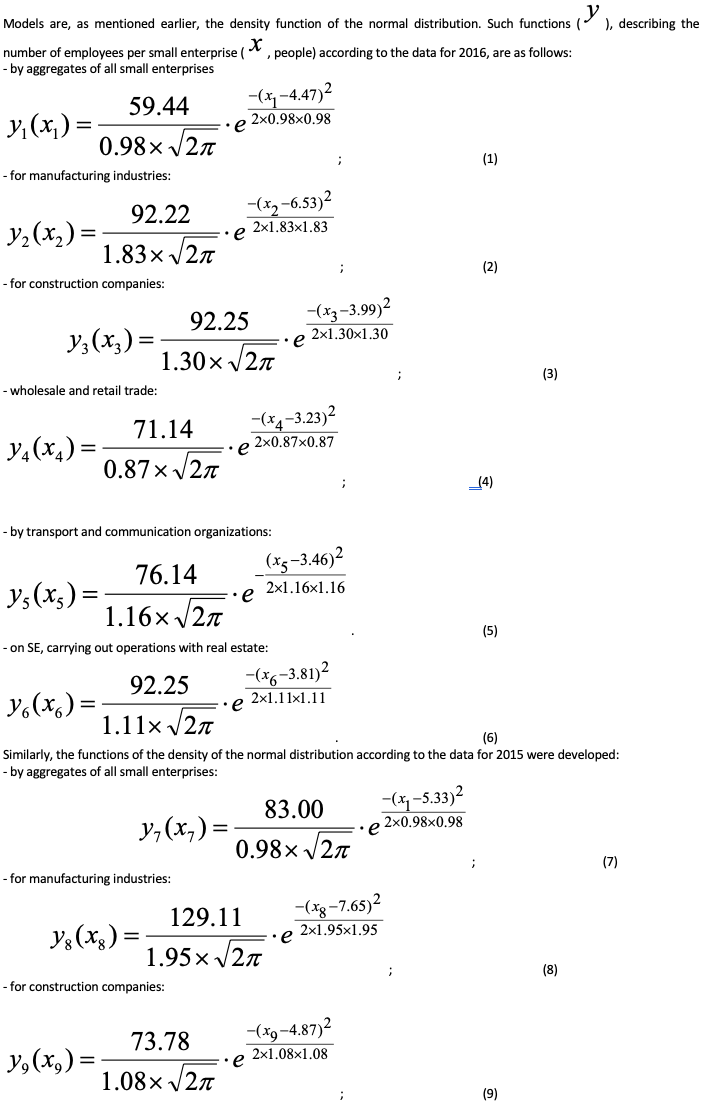
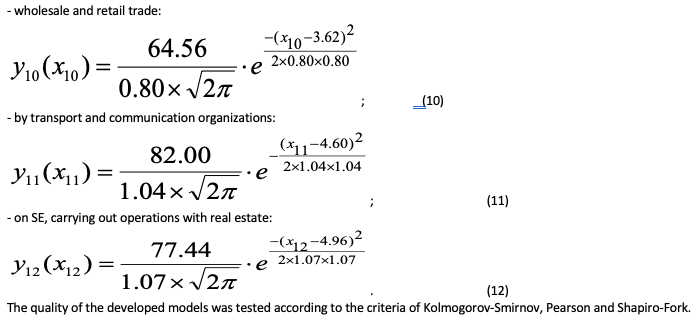
Table 3
Estimated values of statistics
Number of function |
Estimated value by quality criterion |
||
Kolmogorov-Smirnov |
Pearson |
Shapiro-Wilk |
|
1 |
2 |
3 |
4 |
(1) |
0.02 |
0.65 |
0.98 |
(2) |
0.03 |
2.11 |
0.97 |
(3) |
0.07 |
3.82 |
0.95 |
(4) |
0.05 |
2.05 |
0.96 |
(5) |
0.05 |
3.04 |
0.95 |
(6) |
0.03 |
1.71 |
0.97 |
(7) |
0.03 |
0.85 |
0.98 |
(8) |
0.03 |
0.85 |
0.98 |
(9) |
0.03 |
0.69 |
0.99 |
(10) |
0.07 |
2.70 |
0.96 |
(11) |
0.04 |
3.45 |
0.95 |
(12) |
0.06 |
1.99 |
0.97 |
Source: compiled and calculated by the authors
The calculated values of statistics by the Kolmogorov-Smirnov criterion (given in the second column of table 3) are in the range from 0.02 to 0.07 and less than the table value, which at a significance level of 0.05 is 0.152. Similarly, a comparison of calculated values from 0.65 to 3.82 (listed in the third column of table 3) with a table value of the Pearson criterion equal to 9.49 showed that they are all less than the table value. Statistics based on the Shapiro-Vilk criterion (listed in the fourth column of table 3) with values from 0.95 to 0.98 exceed the table value of 0.93 at a significance level of 0.01. In addition, a logical analysis of the developed models was carried out, which showed that they well approximate the original data in the entire range of their changes. In general, it can be concluded that, according to all the criteria considered, the functions developed are of high quality and well describe the patterns under study.
Density functions of the normal distribution allow you to determine the average values of the indicators and the intervals of their changes based on the values given directly in the functions. So, the intervals of change of indicators for the majority (68%) of Russian regions are calculated based on the values of standard deviations. At the same time, to calculate the boundaries of the interval, the specified deviation is added and subtracted accordingly to the average value of the indicator.
Average values and intervals of change in the number of employees per one small enterprise according to the data for 2015 and 2016 are summarized in table 4. They are based on the functions of the density of the distribution (1) - (12).
Table 4
The number of employees per SE, people
No. |
Types of economic activity |
2015 |
2016 |
||
average value |
change interval |
average value |
change interval |
||
1 |
2 |
3 |
4 |
5 |
6 |
1 |
aggregates of all small enterprises |
5.33 |
4.35-6.31 |
4.47 |
3.49-5.45 |
2 |
manufacturing industries |
7.65 |
5.70-9.60 |
6.53 |
4.70-8.36 |
3 |
construction companies |
4.87 |
3.79-5.95 |
3.99 |
2.69-5.29 |
4 |
wholesale and retail trade |
3.62 |
2.82-4.42 |
3.23 |
2.36-4.10 |
5 |
transport and communication organizations |
4.60 |
3.56-5.64 |
3.46 |
2.30-4.52 |
6 |
SE, carrying out operations with real estate |
4.96 |
3.89-6.03 |
3.81 |
2.70-4.92 |
Source: compiled and calculated by the authors
The average number of jobs replaced in one small enterprise was about 4.5 people in 2016. The highest rate was observed in the enterprises of processing industries - 6.5 people. For the four other types of activities, the average values of the specific number ranged from 3.2 to 4 people. A high figure for manufacturing industries seems logical, since such SE have more complex and diverse technological processes. It is important to emphasize that even in small enterprises related to manufacturing, in most regions the number of employees per enterprise does not exceed 9 people (column 5 of table 4). This indicates that the number of employees in the absolute majority of SE is far from the maximum statutory value of this indicator - 100 people.
A comparative analysis of the average values of the number of workers employed in one SE shows a significant (up to 25%) decrease in these indicators in 2016 compared to 2015, both in all enterprises and in SE specialized in each of the five main activities. In our opinion, this negative trend was due to the crisis in 2016. The deterioration in market conditions caused a decrease in the number of employees in enterprises. The latter required the combination of different functions by employees, which leads to low efficiency of enterprises, reduced product quality and increased entrepreneurial risk.
The values of the number of employees per enterprise vary significantly in specific regions of Russia, as can be seen from the ranges of changes in these indicators, shown in columns 3 and 5 of table 3. This indicates a significant differentiation of these indicators within the considered sets of enterprises. Therefore, of particular interest is the identification of regions in which the values of indicators of the specific number of employees in the aggregates of small enterprises are respectively less than the lower limit and greater than the upper limit of the intervals. The results of this analysis on the example of the totality of all SE are given below.
In terms of aggregates of small enterprises, the number of employees smaller than the lower limit of the interval (3.49) took place in 2016 in the following regions: Yaroslavl and Novosibirsk regions, republics of Karelia, Ingushetia, Altai and Karachay-Cherkessia, Primorsky and Perm territories, city St. Petersburg.
Of interest are regions in which the number of employees per enterprise is greater than the upper limits of the intervals given in column 6 of table 4. In the aggregates of small enterprises, this situation took place in 2016 in nine regions such as Kaluga, Vladimir, Voronezh, Kursk , Orenburg, Kurgan, Nizhny Novgorod and Lipetsk regions, Republic of Bashkortostan.
Of considerable interest is the comparison of the obtained value of the average number of employees per SE (given in Table 4) with similar indicators for foreign countries. The average number of employees per SE in the regions of Russia almost coincides with that in Canadian enterprises, which in December 2015 was 4.0 people (Key small business statistics, 2016). On average, in the countries of the European Union (EU) the number of employees employed in one enterprise is 5.9 people (Statistics Explained, 2018). This is 25% higher than the corresponding figure for 2016 in Russian regions. For the majority (68%) of the EU countries, the values of the specific number of employees of SE are in the range from 3.85 to 7.51. That is, the lower limit of the interval for EU countries is close to the corresponding value for the regions of Russia (column 6 of table 4), and the upper limit of the interval is 1.3 times larger than the corresponding value for the majority of regions of Russia. At the same time, as noted above, in Russia there are nine regions in which the number of employees per enterprise was close to the level characteristic of most EU countries. This indicates the presence of reserves for the growth of the number of SE employees in our country.
The results of the research, containing scientific novelty, include the following:
1. For the years 2011-2016 the number of small enterprises decreased by 28.75%, and the number of employees by 24.38%. At the same time, it is important to note that despite the decrease in the number of small enterprises, an increase in the number of workers was revealed in two types of economic activity: in fisheries and fish farming (by 6.95%) and in mining (by 3.27%).
2. It is shown that for the period from 2015 to 2016 there was a simultaneous increase in the number of small enterprises and the number of employees only in such activities as wholesale and retail trade, construction, agriculture, as well as fishing and fish farming.
3. In 2016, the five main types of economic activities of the MP were wholesale and retail trade, real estate operations, transport and communications, manufacturing, construction. It was proved that they accounted for 87.8% of MP and 83.4% of workers employed in these enterprises.
4. The possibility of using the functions of the density of the normal distribution as tools for analyzing patterns that characterize the number of employees per MP, as well as by type of activity, was confirmed.
5. The average values of the number of employees per one enterprise have been determined. The trends of these values for the period from 2015 to 2016 are established.
6. The intervals of changes in the number of employees per one enterprise, characteristic of the majority (68%) of the regions of Russia, have been determined. The regions in which the values of the specific number of employees in the aggregates of small enterprises are, respectively, less than the lower limit and more than the upper limit of the intervals.
7. A comparative analysis of the number of employees per enterprise in the regions of Russia and a number of foreign countries was carried out.
The research results can be used when carrying out scientific work related to the justification of the estimated number and number of employees of enterprises, the formation of measures to improve the efficiency of the business sector, as well as the modernization of the economic policy of the Russian Federation in order to stimulate economic growth and welfare of citizens. The functions of the density of the normal distribution given in the article can be used to justify the concepts, plans and programs for the development of small and medium-sized businesses in the regions and municipalities.
The practical significance of the research results is related to the possibility of their use directly by entrepreneurs (especially beginners) in assessing the possibilities of creating enterprises and determining the estimated number of employees. In addition, the results of the work can be applied by departments of regional and municipal government bodies engaged in the formation of projects and programs for the development of entrepreneurship, including on the development of entrepreneurship in those regions and municipalities.
Prospects for further research related to the consideration of the differentiation of the values of the number of employees for the SE sets related to the 8 other types of economic activity. Also of interest is the analysis of indicators by sets of small enterprises located in the municipalities of specific regions.
Abdullina S.N., Safiullina K.G., Gataullina L.R. Small and medium business of the Republic of Tatarstan in a crisis // Kazan Economic Bulletin. 2016. № 4 (24). P. 80-87.
Balynin I. V. (2015), Development of small business in the Russian Federation for 2011-2013, Theoretical & Applied Science. No. 1 (21). P. 184-189.
Dubynina A.V., Demyanov D.G. Structural potential of small and medium-sized businesses: trends and development vectors // Regional economy: theory and practice. 2015. No. 4 (379). P. 47-60.
Federal State Statistics Service. Small and Medium Entrepreneurship in Russia - 2017 [Electronic resource]. URL: http://www.gks.ru/bgd/regl/b17_47/Main.htm
International Labor Conference, 104th Session. Report IV Small and medium-sized enterprises and productive employment. Geneva: International Labor Office (ILO), 2015.
Key small business statistics. Innovation, Canada Small Business Branch, June 2016, [Electronic resource]. URL: www.ic.gc.ca/sbstatistics (access date: 08/21/2018).
Makhmudova M.M., Koroleva A.M. Analysis of the current state of small business in the Tyumen region // Bulletin of Perm University. Vol. "Economy". 2015. № 1 (24). P. 69-78.
On the development of small and medium businesses in the Russian Federation: Federal Law No. 209-FZ of July 24, 2007.
Pinkovetskaia I.S., Balynin I.V. Structure of small and medium-sized business: results of total statistic observations in Russia // Montenegrin Journal of Economics. 2018. Т. 14. № 1. P. 143-158.
Pinkovetskaya I.S. Modeling performance indicators of small and medium-sized businesses in the regions using the density function of the normal distribution // Problems of territory development. 2015. № 6 (80). P. 93-107.
Rakhmanova M.S., Schneider V.V. 2018. Modern status of small enterprise development prospects and problems in Russia. Amazonia Investiga, 7(14), P. 61-72.
Sitnikova E.V., Olabina V.V., Pidojmo L.P. The role of small business in the development of the Russian economy // News of South-West State University. 2016. № 4 (21). P. 89-96.
Sorokina M.V. The current state and development trends of small business in construction // Bulletin of civil engineers. 2016. № 3 (56). P. 304-309.
Statistics Explained. Statistics on small and medium-sized enterprises. [Electronic resource]. URL: http://ec.europa.eu/eurostat/statistics-explained/index.php/Statistics_on_small_and_medium-sized_enterprises (access date: 08.21.2018).
The strategy for the development of small and medium-sized businesses in the Russian Federation for the period up to 2030: Government Decree of June 2, 2016 No. 1083-p // Collected Legislation of the Russian Federation. 2016. № 24. Art. 3549.
Zakirova I.R. Service entrepreneurship in the region at the present stage of development // Modern problems of science and education. 2015. № 1 (part 1). P. 1-8.
Zilberstein O. B., Shklyar T.L., Avtonomova S.A., Shilina M.G. Analysis of russian medium-sized enterprises in the context of federal districts and major municipalities. Amazonia Investiga, 7(14), P. 128-138.
1. PhD, Associate Professor, Department of Economic Analysis And State Management, (Ulyanovsk State University, Ulyanovsk, Russia). pinkovetskaia@gmail.com
2. Senior lecturer at the Department of public finance, Financial (university under the Government of the Russian Federation, Moscow, Russia). igorbalynin@mail.ru
3. Mag. Educación, Esp. Revisoría Fiscal. (Editor Revista Amazonia Investiga ISSN 2322-6307) dfaca@hotmail.com
4. PhD, Educación, (Docente titular IE Jorge Eliécer Gaitán, Colombia). mjulissa@gmail.com