![]() ISSN 0798 1015
ISSN 0798 1015

![]() ISSN 0798 1015
ISSN 0798 1015
Vol. 40 (Number 7) Year 2019. Page 29
HERNÁNDEZ, Leydy J. 1; LÓPEZ, Leyla C. 2; LÓPEZ, Danilo A. 3
Received: 21/08/2018 • Approved: 19/02/2019 • Published 04/03/2019
ABSTRACT: One of the existing problems in the area of medical sciences is related to classifying pathogenic and non-pathogenic human bacteria; however with the emergence of vector support machines it is possible to optimize this task in an automated way by class separation in space called hyperplanes. In this regard, the article evaluates the performance presented when classifying bacteria using the polynomial kernel and Gaussian radial base functions. The results identified a better SVM performance when setting parameters within the biclass classification is performed using a polynomial kernel. |
RESUMEN: Uno de los problemas existentes en el área de las ciencias médicas se relaciona con la clasificación de bacterias patógenas y no patógenas humanas; no obstante con la aparición de las máquinas de soporte vectorial se tiene la posibilidad de optimizar dicha tarea de manera automatizada mediante la separación de clases en el espacio llamados hiperplanos. En este sentido el artículo evalúa el rendimiento presentado al clasificar bacterias utilizando las funciones kernel polinomial y base radial gaussiana. Los resultados permitieron identificar un mejor desempeño de la SVM cuando el ajuste de parámetros dentro de la clasificación biclase se realiza con el uso de un kernel polinomial. |

Most bacteria are harmless to their hosts, but there are some that are pathogenic. Bacteria are grouped into taxonomic categories. Members of these categories have a sequence of orthogonal genes in some cases similar, which may indicate some information about their behavior. Although there has been major progress in understanding bacterial pathogenesis, there is still not enough information about what makes a bacterium a human pathogenic. With the advent of sequencing technologies, the number of complete bacterial genomes has increased dramatically. This information is now available to investigate genetic characteristics that determine pathogenic phenotypes in bacteria (Iraola et al., 2012). This scenario implicitly raises the need to develop possible automated solutions to one of the problems of interest in medicine that is related to discrimination of bacteria in "human pathogenic and non-pathogenic". The above can be carried out by using classification algorithms and gene databases related to virulence, whose values depend on whether they are present or absent in the sequencing pattern. Likewise, the data processing tools, as well as the analysis of results, are very important to reach conclusions about the classification and composition of the genomic base. In this regard, results found when designing a pathogenic biclass bacteria classification system by using Support Vector Machine are socialized. (SVMs) (Rivas et al., 2017).
To classify of bacteria into human pathogenic and non-pathogenic, the cross-validation validation method (Mathworks, 2016) has been used (Sammut and Webb, 2010), which consists of dividing the set of samples into subsets, where only a single subset is evaluated against the other training subsets during each iteration. The test subset changes in each iteration and the performance measures are calculated and finally averaged. This procedure is used for each of the configurations of the SVM coefficients and their respective kernels. Finally, the best results in performance measures will be taken into account to select the kernel and its most appropriate configuration. The general scheme of the SVM biclass model developed is shown in figure 1.
Figure 1
General flow chart scheme
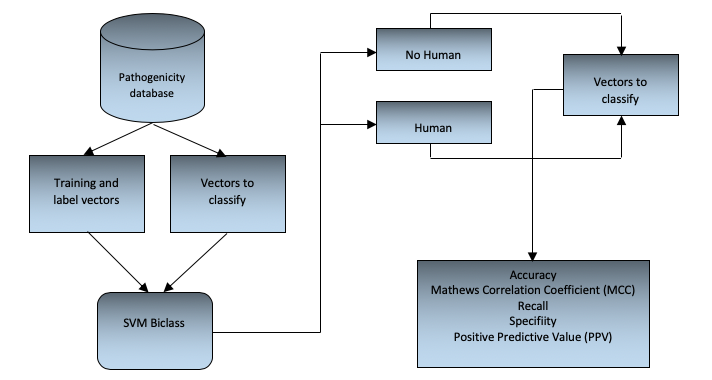
It is important to emphasize that according to the kernel function that is used in the algorithm, there are free parameters that can be adjusted. By varying these parameters (known as the SVM training event) you can find the values so that the generated classifier is the best and thus adequately predict the patterns that you wish to classify (Camacho, 2013). In this sense the SVM tries to find an optimal separation hyperplane, where the margin is the highest among the groups to classify. To implement the SVM we used the Matlab programming language that has the linear kernel, quadratic, polynomial and Gaussian radial base functions implemented; and in order to determine which function had the best performance (from the metrics described in figure 1), each of these kernels was evaluated by adjusting the respective free parameters. To adjust the parameters we used the grid-search method (Chih-Jen, 2003) which consists in the use of a mesh where the values of the SVM parameters are tested and the most accurate configuration obtained when using the cross-validation validation method is selected.
2.1. Performance evaluation variables for SVM classification.
Metrics taken into account for the classification tests in the present project are: Accuracy, Matthews correlation coefficient (MCC), Recall, Specifity, Positive Predictive Value (PPV). These measures are built based on the following values (Classeval-wordpress, 2017):

2.2. Characteristics of the biclass classification database.
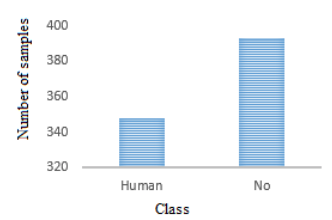
It consists of a set of data comprising a list of 741 bacterial patterns with their corresponding true labels. Each pattern consists of a sequence of 120 genes, which were reduced from a larger set of 814 genes in the work developed in Iraola et al. (2012) to increase the efficiency of both classification performances, as in computer processing. This data set was obtained from the database that accompanies the software Bacfier_v1_0.zip of free distribution, developed by the authors of the work and available in Iraola et al. (2012). Figure 2 illustrates the distribution of samples.
Figure 2
Distribution of samples according to pathogenicity
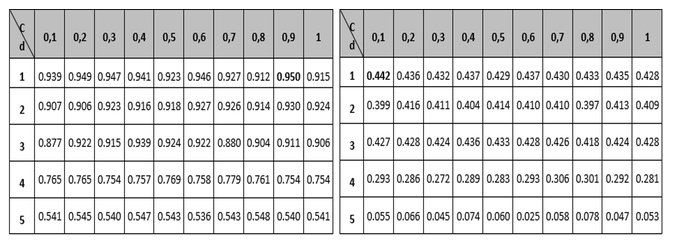
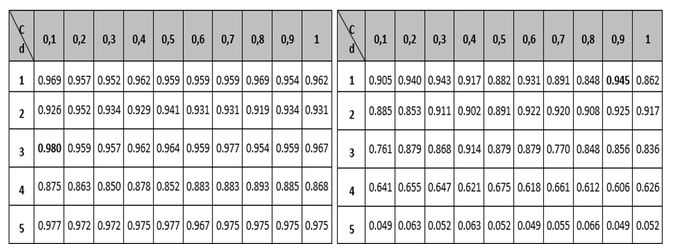
Tables 1 to 3 show the results of the adjustment meshes of free parameters (c, d) found with the polynomial kernel for human pathogenicity classification, and in Tables 4 to 6 the results for the Gaussian radial base (c, γ) kernel function, in accordance with what is established in Camacho (2013). Due to lack of space the results found with the linear and quadratic kernel are not included.
In each case, in order to determine the best performance for the metrics (Accuracy MMC, Recall, Specifity and PPV) the respective free parameters were adjusted; and to adjust these parameters the "grid search" method was used, which consists in the use of a mesh where the values of the SVM parameters are being tested and the configuration with the best precision obtained when using the cross-validation method is selected.
Table 1
Mesh to set the parameters of the Accuracy and
MCC variables for the polynomial kernel function.
---
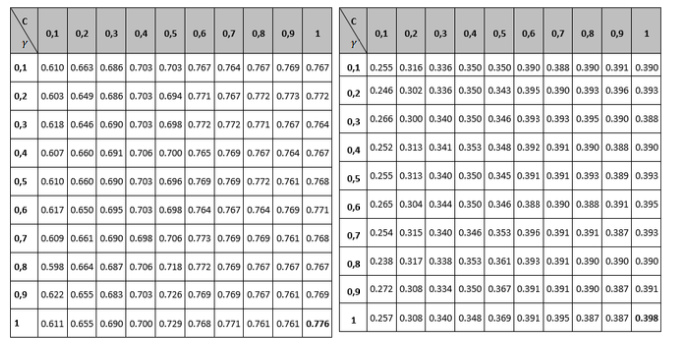
Table 2
Mesh to set the Recall and Specifity variable
parameters for the polynomial Kernel function.
-----
Table3
Mesh for setting PPV variable parameters
for the polynomial kernel Function
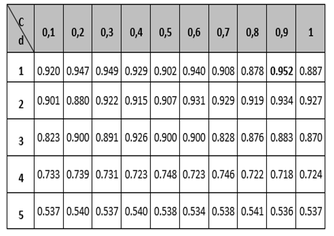
At this point it is important to note that although the polynomial kernel function has more than two free parameters, it was decided to use only parameters c and d, due to the difficulties that would arise to form the mesh (Camacho, 2013). It should be noted that for the different tables the regularization parameter c, is the variable that establishes the relationship between the training error and the complexity of the model (the higher the value of c, the more complex the model and the lower the training error, its value typically varies between 0 and 1); the parameter d, is related to the degree of the polynomial and as its value increases the classification surface becomes more complex and its value in the tests was limited to a maximum of 5 due to the restrictions in the computation processing; and the metric γ, is responsible for controlling the shape of the separation hyperplane.
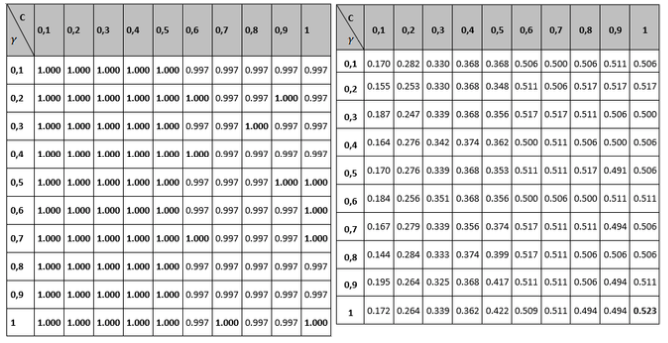
Table 4
Grid to set the Accuracy and MCC variable parameters
for the Gaussian radial basis kernel function.
-----
Table 5
Grid to set the Recall and Specifity variable parameters
for the Gaussian radial basis kernel function
-----
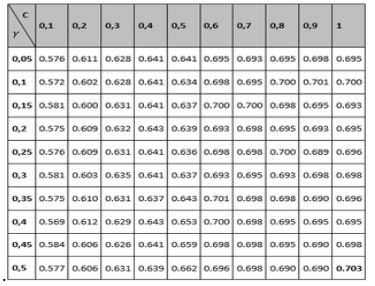
Table 6
Grid for setting PPV variable parameters for
Gaussian radial basis kernel function
In the SVM biclass corresponding to the problem of classifying patterns between the human pathogenic class and non-human pathogenic class, a series of performance measures that have been calculated for each of the configurations of parameters free of SVM and the kernel were taken into account (as seen in Tables 1 to 6), which allowed to determine the best configuration in terms of performance in the classification (López et al., 2017).
Initially when analyzing the conformation of the data set, it can be observed that comparing the number of patterns of the human pathogenic class (348 patterns) with those of the non-human pathogenic class (393 patterns), there is no problem of significant sample imbalance, that does occur in similar approaches of biclass classification as in the case of cancer detection addressed by Laza and Pavón (2009), which has few samples of sick patient class as opposed to the large number of samples of the healthy patient class, and in which the idea is expressed that the global error tries to be reduced by the classifier without taking into account the data distribution. Likewise, the number of samples of the training set is large (741 * 0.9 = 667 patterns for training), which translates into a low variance, and that the number of characteristics is also large, ensuring that there is sufficient discrimination information and low oscillation in the algorithm. By having a low variance and oscillation, a good performance is obtained in the test set. It should also be noted that although the number of features is relatively large, the number of samples is higher, which largely prevents over fitting. Measures or metrics taken into account to measure classifier performance with the "cross-validation" method described above in Figure 1.
In this regard, in the first instance observing the Accuracy measure, shown in the left part of Tables 1 and 4, and corresponding to the classifier global performance measurement, it can be seen that the best configuration corresponds to the polynomial kernel with free parameters and .
The second measure observed globally regarding the classification is the metric called MCC (located on the right side of tables 1 and 4) which relates to the binary classifications quality measurement; it shows that the highest values are in the polynomial kernel, largely corroborating the results obtained with the Accuracy variable.
Comparing the measurements obtained for Recall and Specifity of Tables 2 and 5 metric, are measures focused on one of the classes; for the binary classification problem raised, the human pathogenic class corresponds to the Recall variable and the non-pathogenic human class corresponds to the Specifity metric. The best reported Recall values are those who correspond to the Gaussian kernel (100% Recall), but all of the other performance measure values are not the best, so it can be concluded that the kernel that performs best is the polynomial with a 98% performance for the free parameters configuration (see left part of table 2). Regarding the Specifity variable it can be seen that the best configuration is also the polynomial with a performance of 94.5%.
Finally, the PPV metric is taken into account in the analysis (tables 3 and 6), also called precision, whose best performance is the polynomial configuration with 95.2% performance. According to Bridge Derek, the Recall and PPV measures are focused on the positive class (usually), that for the approach of this research is the human pathogenic class, which is special with respect to the nature of the problem. Similarly, sensitivity is the proportion of examples of the positive kind which are correctly classified, and the positive predictive value (PPV) is the proportion of examples of the positive class assigned to this class which are properly classified. According to (Ng, 2015), the two measures are robust in terms of influences that can be derived from the imbalance of classes should this occur in a significant way, since these measures give a better understanding of the predictor algorithm performance, because if in some case the situation arises that the classifier predicts few or no true positives, the sensitivity would give a low value, which would indicate a bad classification on the class and therefore a low performance of the classified. The results described above indicate that in terms of evaluating the classification performance, the best kernel is the polynomial, and that the best configuration of parameters within it is y , since most of the best metrics are in that configuration. Regarding the computational cost, it was established that the polynomial kernel is not the most adequate, since it needs a greater number of iterations than the Gaussian kernel to carry out the classification.
Taking as a reference the results found in the investigation, it was concluded that biclass SVMs are a good bacteria system classifying by pathogenicity when the kernel configuration is polynomial; however, it has the disadvantage of requiring higher data processing capacity compared to using a Gaussian radial basis kernel. For this reason it is interesting to continue evaluating other types of models or methodologies such as those based on deep learning, Bayesian networks, Anfis systems in order to maintain or improve bacteria classification performance but seeking to reduce the number of iterations required for data processing.
Camacho, F (2013). Classification system of antibacterial peptides using vector support machines. Thesis, Universidad Industrial de Santander. Faculty of Engineering and Information Systems, Bucaramanga.
Chih-Jen, L (2003). A practical guide to support vector classification, Department of Computer Science, National Taiwan University. [On line], recovered from: http://ntur.lib.ntu.edu.tw/bitstream/246246/20060927122852476378/1/freiburg.pdf
Classeval-wordpress (2017). Basic evaluation measures from confusion matrix. [On line], recovered from: https://classeval.wordpress.com/introduction/basic-evaluation-measures/
Iraola, G., Vazquez, G., Spangenberg, L., Naya, H (2012). Reduced Set of Virulence Genes Allows High Accuracy Prediction of Bacterial Pathogenicity in Humans. PLoS ONE, Volume 7, No. 8. https://doi.org/10.1371/journal.pone.0042144.
Laza, R y Pavón R (2009). Bayesian classifier of MedLine documents from unbalanced data. Master’s Thesis, Universidad de Vigo, Spain.
Rivas, T., López, D., Gualdron, E (2017). Characterization of primary users in cognitive radio wireless networks using Support Vector Machine, Indian Journal of Science and Technology, Volume 10, No. 32, pp. 1-12. https://doi.org/10.17485/ijst/2017/v10i32/93796
López, D., Hernández, L., Rivas, T (2017). SVM and ANFIS as channel selection models for the spectrum decision stage in cognitive radio networks, Contemporary Engineering Sciences, Volume 10, No. 10, pp. 475-502. https://doi.org/10.12988/ces.2017.7438.
Mathworks, Matlab (2016). Cross-validated support vector machine regression model. [On line], recovered from: https://www.mathworks.com/help/stats/regressionpartitionedsvm-class.html?searchHighlight=crossvalidatedmodel&s_tid=doc_srchtitle
Ng, A (2015). Machine learning, Stanford University, Video lectures. [On line], recovered from: https://es.coursera.org/learn/machine-learning
Sammut, C y Webb, G (2010). Encyclopedia of Machine Learning. Ed: Springer, pp. 1031, New York. ISBN 978-0-387-30164-8.
1. Estudiante de Doctorado en Ingeniería, Docente-Investigador de la Unidad de Ingenierías, en el Programa de Tecnología en Logística Empresarial. Corporación Universitaria Minuto de Dios - UNIMINUTO. leydy.hernandez-v@uniminuto.edu.co
2. Magister en Psicología, Profesora en la Facultad de Ciencias Humanas y Educativas en el Programa de Psicología. Universidad de Boyacá. leycarlopez@uniboyaca.edu.co
3. Doctor en Ingeniería. Profesor en la Facultad de Ingenierías en el Programa de Ingeniería Eléctrica. Universidad Distrital Francisco José de Caldas. dalopezs@udistrital.edu.co