![]() ISSN 0798 1015
ISSN 0798 1015

![]() ISSN 0798 1015
ISSN 0798 1015
Vol. 40 (Number 10) Year 2019. Page 6
VOROZHBIT, Elena G. 1; VYSKREBENTSEVA, Anna S. 2 & LASKINA, Maria V. 3
Received:13/11/2018 • Approved: 11/03/2019 • Published 31/03/2019
ABSTRACT: One of the managers’ tools is margin analysis allowing to identify the optimal proportions between variable and fixed costs, minimize business risks increasing with reduction of sales. In the article on the basis of the actual data of the enterprise, the analysis is performed and management decisions concerning the product range at incomplete loading of production capacities are proved. Making informed management decisions is an important factor in improving the efficiency of the baking industry with a multi-product production. |
RESUMO: Uma das ferramentas dos gerentes é a análise de margem, permitindo identificar as proporções ideais entre custos variáveis e fixos, minimizando os riscos, aumentando com a redução das vendas. Com base nos dados reais, a análise é executada e as decisões de gestão acerca da variedade de produtos no carregamento incompleto de capacidades de produção comprovamse. Tomar decisões de gestão informadas é um fator importante para melhorar a eficiência da indústria de panificação com uma produção de vários produtos. |

In modern market conditions the enterprise independently carries out planning of the activity, including planning of profit, expenses, the range of products. Margin analysis or break-even analysis plays an important role in planning and making informed management decisions.
The method of this type of analysis is based on the division of costs depending on the change in production volume into fixed and variable. In practice, the allocation of costs to constant and variable will depend on the characteristics of the enterprise, the accounting policy adopted, the objectives of the analysis.
Margin analysis allows us to estimate the relationship between such indicators as production volume, costs and profit. The main indicator in this analysis is marginal income (marginal profit) – the difference between revenue and variable costs.
When planning a production program, it is necessary to focus on the indicator of marginal income, rather than profit, which is calculated as the difference between revenue and total cost. In the conditions of incomplete utilization of production capacities, the removal from production of loss-making products on the basis of full costs often leads to loss-making of other groups, that is, an even greater deterioration in the financial situation.
The calculation of margin income in the planning of assortment and profit, allows the company's management to make the right management decisions, to respond more quickly to changes in production conditions and the environment. At the same time, products with a positive marginal income contribute to the coverage of fixed costs, and, consequently, the growth of profits.
In the context of developing market relations, effective management of production activities of the enterprise is increasingly dependent on the level of its information support. The main source of information for management decision-making is, as a rule, accounting. From the point of view of the formation of the cost of production (works, services), the Russian accounting rules provide for two options for calculating the cost of production: full and truncated cost. Thus, according to paragraph 9 PBU 10/99 "Expenses of the organization " "... commercial and management costs may be recognized in the cost of products sold, goods, works, services in full in the reporting year of their recognition as expenses for ordinary activities". This option should be fixed in the accounting policy of the organization.
In the method of accounting for total costs, the cost of goods sold will be greater than in the method of accounting for reduced costs, since in the first case all General production and General expenses, both variable and fixed, are included in the production cost, and they are involved in the calculation of the unit cost of production.
When using the domestic version of the calculation of incomplete (truncated) cost of production (works, services) it is necessary to deduct General economic (management) costs that do not participate in the calculation of the cost, and directly written off the financial result.
In accordance with the International financial reporting standard (IAS) 2 "Reserves", the costs associated with the sale of products (works, services), as well as with the management of the organization, should not be capitalized (included in the cost of inventories at the end of the reporting period), they relate to the expenses of the period.
The experience of economically developed countries shows the effectiveness of using the marginal method of accounting or the method of accounting for variable costs for management reporting. The need for a clear division of costs between fixed and variable parts of them pointed back in 1903 (Hess, 1903).
In the method of accounting for variable costs (margin accounting) in the calculation of the cost of production units take into account only the variable part of the costs, and all fixed costs (General production and General) are attributed to the period. They are not allocation will be determined on remains of unfinished production, finished products and cost of products sold and completely written off reducing profit (Kerimov, 2001). This option of calculation without special additional calculations provides the necessary information in the market conditions about the trends in the behavior of costs in terms of changes in production.
When describing this system in the domestic literature on accounting, the term "accounting of limited, incomplete or reduced cost" is often found. The main indicator of this system is the marginal income, which is used to determine the threshold of cost-effectiveness of production, set the price of break-even sales, built as-assortment policy of the enterprise, etc. (Sheremed, 2014).
This method is now being increasingly used in domestic accounting practice. It is characterized by a high degree of integration of accounting, analysis and management decision-making. We formulate the main features of this method, the positive aspects and problems associated with its application.
The main feature of this method, which is based on the classification of fixed and variable costs, is that the cost of industrial production is taken into account and planned only in terms of variable costs. Fixed costs are collected in a separate account and debited directly to the financial results account at specified intervals.
An important feature of this method is that, thanks to it, it is possible to study the relationship between the volume of production, costs (cost) and profit (Kerimov, 2000). If the volume of production is determined, thanks to this analysis, it is possible to calculate the amount of costs and the sales price of the product, so that the enterprise makes a profit. With the help of the analysis data it is easy to form different variants of the production program, product prices, production structure. Thus, "margin analysis" allows us to get an answer to the question what we will get if one or more parameters of the production process change. Margin analysis is a powerful tool for managers to understand the relationship between product price, level of production, direct costs per unit of output, total fixed costs, mixed costs and profit. In addition, it is a key factor in the process of making the necessary management decisions, for example, determining the volume of production, assortment and price policy, marketing strategy, product competitiveness, etc.
The source of information for the study was the actual data of the baking industry, on the basis of which the margin analysis was carried out.
We will analyze the profitability of individual product groups on the basis of full cost and using the method of "margin analysis" on the basis of reduced cost. This method is applicable to the conditions existing company is a small bakery business with four types of industries: – bread; - baked goods; cakes; confectionery products. The calculations are presented in table 1.
The distribution of overhead costs by product groups is based on direct variable costs (the distribution base is fixed in the accounting policy).
Table 1
The data on the basis of full cost
Pro-Duk-living groups |
Volume of production in the planes, kg |
Revenue |
Variable costs |
Fixed costs |
Cost of sales |
Profit |
|||||
on 1 kg, RUB |
total, thousand rubles |
on 1 kg, RUB |
total, thousand rubles |
on 1 kg, RUB |
total, thousand rubles |
on 1 kg, RUB |
total, thousand rubles |
on 1 kg, RUB |
total, thousand rubles |
||
А |
3729 |
45 |
168 |
24 |
89 |
8 |
31 |
32 |
121 |
13 |
47 |
В |
2967 |
42 |
125 |
18 |
53 |
6 |
19 |
24 |
72 |
18 |
53 |
С |
990 |
94 |
93 |
60 |
59 |
21 |
21 |
81 |
80 |
13 |
13 |
D |
578 |
345 |
199 |
260 |
150 |
91 |
52 |
351 |
203 |
-6 |
-3 |
result |
8264 |
|
585 |
|
353 |
|
123 |
|
476 |
|
109 |
Source: compiled by the authors
Profit calculation on the basis of the total cost showed the profitability of groups A, B and C, and loss D. Total loss of confectionery products amounted to 3 thousand. If you follow this calculation, then the company can get rid of losses and increase profits in 3 thousand roubles, removing production products D.
Consider the consequences of eliminating D production as unprofitable. For this purpose, we will make a new calculation, based on the fact that the fixed costs related to the production of D are unrecoverable and can not be avoided. The calculation is presented in table 2.
Table 2
Calculation of profit amount by elimination of unprofitable production
Pro-Duk-living groups |
Volume of production in the planes, kg |
Revenue |
Variable costs |
Fixed costs |
Cost of sales |
Profit |
|||||
on 1 kg, RUB |
total, thousand rubles |
on 1 kg, RUB |
total, thousand rubles |
on 1 kg, RUB |
total, thousand rubles |
on 1 kg, RUB. |
total, thousand rubles |
on 1 kg, RUB |
total, thousand rubles |
||
А |
3729 |
45 |
168 |
24 |
89 |
15 |
54 |
39 |
144 |
6 |
24 |
В |
2967 |
42 |
125 |
18 |
53 |
11 |
32 |
29 |
86 |
13 |
39 |
С |
990 |
94 |
93 |
60 |
59 |
36 |
36 |
96 |
96 |
-2 |
-2 |
result |
7686 |
|
385 |
|
202 |
|
123 |
|
325 |
|
60 |
Source: compiled by the authors
The table shows that the attempt to improve the range of products by eliminating the production of D, led to the fact that the loss-making was the production of C. the resulting result is associated with an increase in fixed costs in the cost of the remaining products. Let us analyze the profitability of production D in terms of marginal income.
Table 3
Production analysis D
Indicators |
on 1 kg, RUB |
total, thousand rubles |
Revenue |
345 |
199 |
Variable costs |
260 |
150 |
Marginal profit |
85 |
49 |
Source: compiled by the authors
Thus, the production D is unprofitable: the implementation of one kg of product brings to the enterprise was 85 RUB. of marginal profit, to the same extent contributes to the formation of profit.
In the conditions of incomplete capacity utilization, the decision on removal from production of the product, losing the result of the calculation of the full cost, does not always hold true. If this product brings a positive margin income, then its removal from production will only worsen the financial position of the enterprise. The solution of this issue on the basis of full cost calculation leads to negative consequences.
Using margin analysis to make decisions about the product range allows you to calculate the critical volume of production (break-even point) with the existing structure.
The break-even point is the sales volume at which the company has no profit or loss. If the actual sales volume is below the break-even point, the company suffers losses, and if above the break-even point, the company makes a profit (Savitskaya, 2016).
In terms of a lot of product production break-even sales in real terms can be determined by the following formula:
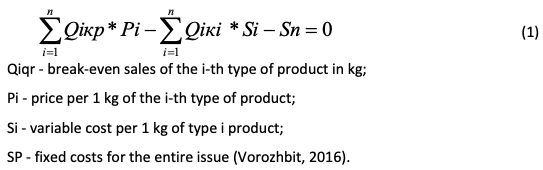
We will use the data in table 4 to perform the calculations.
Table 4
Data for calculation of critical volume of production
Indicators |
А |
B |
C |
D |
result |
1.Volume of production in the planes, kg |
3729 |
2967 |
990 |
578 |
8264 |
2. Price, RUB. |
45 |
42 |
94 |
345 |
526 |
3. Revenue, thousand rubles |
168 |
125 |
93 |
199 |
585 |
4. Variable costs per 1 kg, RUB |
24 |
18 |
60 |
260 |
362 |
5. Total variable costs, thousand rubles |
89 |
53 |
59 |
150 |
353 |
6. Fixed costs, thousand rubles |
|
|
|
|
123 |
7. The profit margin for 1 kg, RUB |
21 |
24 |
34 |
85 |
164 |
8. Margin profit for the entire issue, thousand rubles |
78 |
71 |
34 |
49 |
232 |
9. The share of contribution margin to sales revenue ratio |
0,467 |
0,571 |
0,362 |
0,246 |
0,397 |
Soursce: compiled by the author
To solve the equation, the critical volume of production D (confectionery) is taken as x, then using the data on the volume of production (row 1 of table 4), we denote the critical volume of production A (bread) - 6.45 x,
B (bakery products) – 5.13 x,
C (gingerbread) – 1.71,
Substitute the values into the formula:
6.45 x*(45-24) +5.13 x*(42-18) + 1.71 x*(94-60) + x*(345260) -123000 =0
401.91 x= 123000
X = 306 kg, the critical volume of sales of the group D;
A (bread) - 1974 kg;
B (bakery products) - 1571 kg;
C (gingerbread) - 524 kg;
Thus, if the bakery company produces 1974 kg of bread, 1571 kg of bakery products, 524 kg of gingerbread and 306 kg of confectionery products, the proceeds from the sale of these products will fully cover the cost of production, i.e. the company will have no profit or loss. Compare the break-even sales volume with the actual and determine the financial strength of the enterprise in kg and thousand rubles.
Table 5
The calculation of the stock of financial strength
Indicators |
А |
B |
C |
D |
result |
1.Volume of production in the planes, kg |
3729 | 2967 | 990 | 578 | 8264 |
2.Break-even point, kg |
1974 | 1571 | 524 | 306 | 4376 |
3. Break-even point, thousand rubles |
89 | 66 | 49 | 106 | 310 |
4. Stock of financial strength, kg |
1755 | 1396 | 466 | 272 | 3888 |
5. Stock of financial strength, thousand RUB |
79 | 59 | 44 | 94 | 275 |
Soursce: compiled by the author
As the table shows, the greatest financial strength in kg has bread 1755 kg and the smallest – pastry – 272 kg. In General, the confectionery shop, the financial stability amounted to 3888 kg or 275 thousand.
The margin of financial strength as a percentage is determined by the formula:

Thus, if the market conditions change unfavorably, the company can reduce its revenue by 47% before reaching the break-even point.
An important element of margin analysis is an operational lever that shows the level of entrepreneurial risk. The effect of operating leverage is manifested in the fact that any change in revenues from the sale of always necessarily lead to greater variation in profits. The strength of the operating lever will depend on the amount of fixed costs: the higher the level of fixed costs, the greater the impact of the operating lever.
Calculate the effect of the operating lever by the formula:
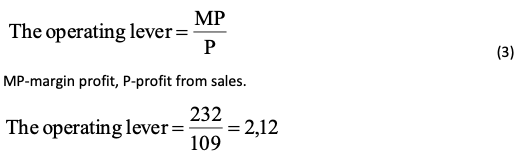
The operating lever shows that if the revenue changes by 1%, the profit increases by 2.12%. With favorable market conditions, the high value of the operating lever allows the company to increase its profits. However, in the conditions of economic instability, with a decrease in the effective demand of consumers of products, the high value of the operating lever significantly worsens the financial results of the enterprise. This is due to the fact that each percentage decrease in revenue leads to an even greater drop in profits and the entry of the enterprise into the loss zone.
The understanding of the mechanism of operating lever manifestation allows purposefully managing the ratio of fixed and variable costs in order to improve the efficiency of the enterprise. This management is reduced to a change in the value of the operating leverage ratio at different trends in the commodity market and stages of the life cycle of the enterprise.
Thus, the use of margin analysis tools in making management decisions will help the management of enterprises of the baking industry:
- substantiate management decisions in case of incomplete capacity utilization;
- to carry out the selection of product groups that bring the greatest profit;
- make decisions on the volume of production of certain types of products;
- to determine the critical volume of production;
- determine the margin of financial strength,
- to assess the level of entrepreneurial risk.
Application of the margin analysis method at the enterprises of the baking industry is possible only under the condition of using the accounting of "marginal (variable) costs".
Hess H., (1903) Manufacturing. Capital Costs, Profits and Divisions. - The Engineering Magazine -1903. vol. 26, No. 3, pp.100-102.
Kerimov V. E., Komarova N. N., Epifanov A.A, (2001) The organization of management accounting system "direct-cost" // Audit and financial analysis. -2001. - № 2, pp. 80-82.
Kerimov V. E., Roenicke O. A., (2000) Analysis of the ratio "cost–volume–profit" // Management in Russia and abroad. - 2000.- №4.-pp. 120-132.
Order of the Ministry of Finance of Russia of 06.05.1999 N 33n (edition of 06.04.2015 )" about the statement of the provision on accounting "expenses of the organization" PBU 10/99"
Savitskaya G. V., (2016) Analysis of economic activity /textbook. - M, RIPO, 2016, pp.174-177.
Sheremet A. D., (2014) Management accounting. - M.: ADFBC PRESS, 2014, p.10.
The international financial reporting standard (IAS) 2 "Stocks" (it is put into force in the territory of the Russian Federation by the Order of the Ministry of Finance of Russia of 28.12.2015 N 217n)
Sukiasyan A. A., (2015) Ufa: Publishing house: "OMEGA SCIENCE", pp. 40-42.
Vorozhbit E. G., Vyskrebentseva A. S., Laskina, M. V., (2016) Assortment management and profit based on marginal analysis / Internet journal of the sociology of Science. 2016. Vol. 8. No. 1 (32), рр.2-6.
1. Altai State University. Department of Economics, Associate Professor, Barnaul, Russia, vorozhbit@mail.ru
2. Altai State University. Department of Economics, Associate Professor, Barnaul, Russia, vasfas@mail.ru
3. Altai State University. Department of Economics, Associate Professor, Barnaul, Russia, laskina@mail.ru