![]() ISSN 0798 1015
ISSN 0798 1015

![]() ISSN 0798 1015
ISSN 0798 1015
Vol. 40 (Number 10) Year 2019. Page 10
BURLUTSKIY, Sergiy V. 1; BURLUTSKA, Svitlana V. 2; MARHASOVA, Victoriya G. 3 & SAKUN, Oleksandra S. 4
Received: 15/11/2018 • Approved: 15/03/2019 • Published 31/03/2019
ABSTRACT: The Ukraine has been continuing to incur losses as a result of an economic recession and armed conflict in the Luhansk and Donetsk regions. Result of this rise of destabilization and real terms of the operation of the national economy was the distortions of its investment and consumer subsystems. The findings presented here indicate that level of fluctuation can change over time, because the mechanisms that shape national socio-economic system may themselves evolve and change. |
RESUMEN: Ucrania ha continuado incurriendo en pérdidas como resultado de una recesión económica y el conflicto armado en las regiones de Luhansk y Donetsk. El resultado en este incremento de la desestabilización y los términos reales del funcionamiento de la economía nacional fueron las distorsiones de sus subsistemas de inversión y consumo. Los hallazgos presentados aquí indican que el nivel de fluctuación puede cambiar con el tiempo, porque los mecanismos que conforman el sistema socioeconómico nacional pueden evolucionar y cambiar por sí mismos. |

The Ukrainian economy has been continuing to incur financial losses due to reduced business activity, increase the overall risk level of doing business as a result of an economic recession and armed conflict in the Luhansk and Donetsk regions. Result of this rise of destabilization and real terms of the operation of the national economy was the distortions of its investment and consumer subsystems. Academic and political discourse must be directed to resolving such problems by increasing structural and dynamical sustainability all national economy components.
The economists and politicians still does not have comprehensive information regarding the institutional mechanisms responsible for the social-economic stability and ways to strengthen it, despite the significant meaning of this problem for national economy. The problem is compounded by the limitation of knowledge regarding the specifics of institutional interaction of the superstructure with the economic basis and, accordingly, a deficiency in the government strategy aimed at reducing both the frequency and strength of shocks.
Over the past years a key topic in the study of the dynamics of socio-economic systems has been used in diverse contexts. The main economic discourse has concerned system`s ability to respond to shocks, disturbances and perturbations. The growth and spread of such attention has been stimulated by several factors: major natural environmental disasters and terrorism (see, e.g. Rose, 2005; Heltberg, 2009); an importance of an evolutionary perspective within economic geography (see, e.g., Martin, 2014; Plotnikov, 2013); the deep financial and economic global crisis of the over 2008–2010, and the policies of restoring public finances (see, e.g. Augustine et al., 2013; Hamilton, 2012). But the interrelation between phases of economic cycles and parameters of respond to shocks is still not fully described by economic theory and even less understood so by economic policy.
A classic tradition among economists has been to study the economic cycles as phenomena of short-term economic instability. The main question of whether the amplitude of the economic cycle is a determinant of the long-term growth. This research agenda, from our point of view, requires more specifies. It would be realistic to expect that parameters of short-term fluctuations and economic cycles are inextricably connected: amplitude of fluctuation is a determinant of phases of economic cycle.
The aim of the article is a justification of hypothesis about existence the significant relationship between short-term fluctuations and stages of economic cycles.
Any system wholeness in the plane of the fluctuation parameters of its elements within the unstable equilibrium is constantly moving either towards greater integration or association (strengthening wholeness), or in the opposite direction (division, separation, loss of elements). The shocks as impulses break the continuity in the development of the current organizational form of socio-economic system.
The crisis as stage that is following the shocks recover the continuity in the further system development by changing its organizational form due to the addition of another element (elements), or the loss of the element (or elements) or selection from more capacious system. Shocks and crises typically follow one after the other, mediating the gap of continuity of the organizational whole and the emergence of new organizational forms and new interconnections. The dynamism of the national socio-economic system can be identified as a set of conditions – an aggregate of indicators (variables) in a given time, which in a certain way develop (evolve) according to a certain pattern.
The results of this analysis provide sufficient basis for the formation the hypothesis: the national socio-economic system as organic wholeness retains its self-organization and the corresponding system owing to «fluctuation movements» of its elements (parameters) and their interconnections. Theoretical explanation of this hypothesis has empirical verification by means of the research of the socio-economic system behavior of Ukraine. The analysis results of the systems of differential equations (the analogue the Lotka–Volterra equations) and the transformation of the phase space in the temporal mode for individual products indicate the possibility of existence of periodic fluctuations of output, means of production and consumption goods (Burlutski, et al., 2017; Kovalov et al., 2017).
А combination of quantitative and qualitative methods was used in this research. Qualitative methods used to evaluate more subjective elements of the evidence pertaining to the fluctuations hypothesis of the parameter of national economy of Ukraine, such as statements by political parties, diplomatic efforts and international influence, the actions of national banks and government institutions. Quantitative methods, mostly statistics based on selected State Statistics Service of Ukraine macro indicators such Gross Domestic Product, Final Consumption Expenditure, Gross Capital Formation, Exchange Rates etc.
Figure 1 shows the quarterly dynamics of the observed time-series of GDP, FCE and GCF which helps in gaining an initially insight into the possible relation between changing of long-term trends and short-run level of fluctuation. The Quarterly national account data is provided by State Statistics Service of Ukraine. Time series were observed relative to the US dollar. The sample includes 63 quarterly observations for each index for the period from first quarter, 2002 to third quarter, 2017.
Figure 1
Quarterly dynamics of the observed time-series of GDP, FCE and GCF
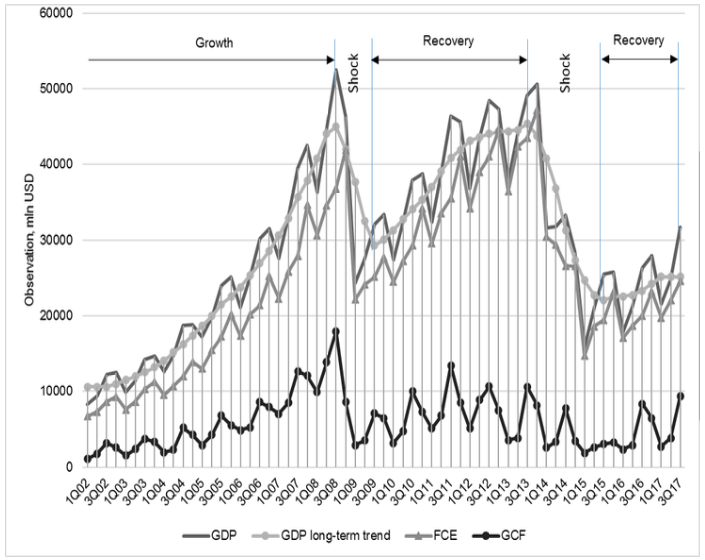
Source: Composed by the authors according to State Statistics Service of Ukraine data
The typical economic cycle is the natural fluctuation of the social-economic parameters between periods of growth and recession. And the Keynesian approach, for example, argues that changes in aggregate demand, spurred by inherent instability and volatility in investment demand, is responsible for generating cycles. But to study the dynamics of behavior national economy of Ukraine we need to observe time-series within non-typical stages. Figure 1 provides types of this stages. At the center of our interest there are phases of shock and recovery. A shock is a complex of unexpected events triggered shifts in normal process of national economy function that, first of all, changes real economic growth. Examples of such shocks are Financial crisis of 2007-2008 and Revolution of Dignity 2014. The basis of theoretical structure of "shock" definition is the implementation of the direct impact of exogenous or endogenous factor to structural relationships of the socio-economic holistic entities. And in this sense, the shocks are mediators (interaction) between the causes of changes in socio-economic systems and the changes under the action of which they arose. A recovery phases is period when GDP picks up from the minimal level reached at the low point after shock. The rate of recovery depends in all on how quickly aggregate demands and real gross capital formation starts to rise after a downturn. Importantly, the analysis of the nature of shocks allow to suggest that impact of exogenous or endogenous factor to the economic system is a necessary condition for the shock destruction of structural relationships. There is only one case of sufficient force of impact is the case then the economic system loses its ability to adequately respond to the destructive influence factors by the instantaneous recover of the equilibrium state (the dynamics). To understand this qualitative leap in the development of socioeconomic system must take into account the fundamental axiom: over time within each socioeconomic system, regardless of its organization degree, fluctuation conversions arise in the process of exchange of economic activities and its results.
For visualizing a time series, we used a centered moving average with window width w=4 quarter. Particularly, the mean of relative level of GDP fluctuation (RLF(GDP)-score) have the following form:
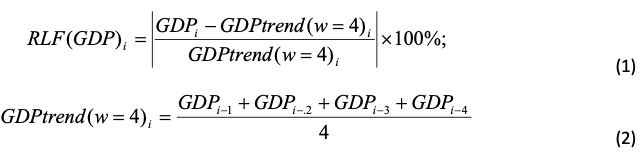
where GDPtrend(w=4) represented a centered moving average with window width w=4 quarter and shows GDP long-term trend; GDPi is quarterly means of gross domestic product. RLF-score for other national macro indicators can be calculated similarly.
A one-way ANOVA was conducted to determine if relative level of fluctuation (RLF-score) was different for groups of observation in different stages of economic cycles. Observation were classified into three groups (stages): growth (n = 27), shock (n = 12) and recovery (n = 24).
Panel A in Table 1 introduces the first four moments. The highest level of fluctuation of GDP for the period examined is in shock stages of economic cycles (14.351%), whereas growth and recovery marked by less levels, 9.994% and 10.181%, respectively. The highest standard deviation of relative level of GDP fluctuation is in shock stages (7.524%), while the lowest standard deviation is found in growth stages (4.612%). There were no outliers in the data, as assessed by inspection of a boxplot for values greater than 1.5 box-lengths from the edge of the box. RLF(GDP)-score was normally distributed for the shock and recovery groups, as assessed by Shapiro-Wilk's test (p > 0.05). The null hypothesis of normal distribution in time series of GDP is rejected for growth stages of economic cycles. There was homogeneity of variances, as assessed by Levene's test of homogeneity of variances (p = 0.141).
Table 1
A one-way ANOVA analysis of RLF(GDP)-score results
RLF(GDP)-score |
Mean, % |
Std.dev., % |
Normality |
Homogeneity of Variance |
||||||
S-W Statistic |
Sig. |
Levence Statistic |
Sig. |
|||||||
Panel A: Summary statistic |
||||||||||
Growth stage |
9.994 |
4.612 |
0.907 |
0.019 |
2.026 |
0.144 |
||||
Shock stage |
14.351 |
7.524 |
0.937 |
0.462 |
||||||
Recovery stage |
10.181 |
6.046 |
0.934 |
0.119 |
||||||
Panel B: Post Hoc Test (Tukey HSD) |
||||||||||
(I) Group |
(J) Group |
Mean Difference (I-J), % |
Std. Err.,% |
Sig |
95% Confidence Interval |
|||||
LB |
UB |
|||||||||
Growth stage |
Shock stage |
-4.357 |
2.011 |
0.085 |
-9.191 |
0.476 |
||||
Recovery stage |
-0.187 |
1.626 |
0.993 |
-4.095 |
3.721 |
|||||
Shock stage |
Growth stage |
4.357 |
2.011 |
0.085 |
-0.476 |
9.191 |
||||
Recovery stage |
4.170 |
2.049 |
0.113 |
-0.755 |
9.096 |
|||||
Recovery |
Growth stage |
0.187 |
1.626 |
0.993 |
-3.721 |
4.095 |
||||
Shock stage |
-4.170 |
2.049 |
0.113 |
-9.096 |
0.755 |
|||||
Panel A in Tab. 1 reports that data is presented as mean ± standard deviation. RLF-score increased from the growth (n=27, 9.994 ± 4.612), to recovery (n=24, 10.181 ± 6.046), to shock (n=12, 14.351 ± 7.524) stages of economic cycles, in that order. But there were no statistically significant differences in RLF(GDP)-score between the different stages of economic cycles, F (2, 60) = 2.641, p = 0.08, ω2=0.081.
Panel B in Table 1 reports the result of multiple comparisons (Post Hoc Test) between groups of observation. Tukey post hoc analysis revealed that the increase from growth to shock stage (4.357, 95% CI (-9.191 to 0.476)) was not statistically significant (p = .085), as well as the increase from recovery stage to shock (4.170, 95% CI (-9.096 to 0.755), p = 0.113), and no other group differences were statistically significant. The group means of RLF(GDP)-score were not statistically significant different (p > 0.05) and, therefore, we cannot reject the null hypothesis and we cannot accept the alternative hypothesis.
A one-way ANOVA analysis of RLF(GCF)-score results are shown in Table 2. Panel A in Table 2 confirms our expectations that level of fluctuation of GFC is more volatile. The highest level of fluctuation of RLF(GFC)-score for the period examined is in shock and recovery phases of economic cycles 38.145% and 33.698%, respectively. Meanwhile growth stages illustrated by less level (22.806%).
Table 2
A one-way ANOVA analysis of RLF(GCF)-score results
RLF(GFC)-score |
Mean, % |
Std.dev., % |
Normality |
Homogeneity of Variance |
||||||
S-W Statistic |
Sig. |
Levence Statistic |
Sig. |
|||||||
Panel A: Summary statistic |
||||||||||
Growth stage |
22.806 |
14.986 |
0.963 |
0.87 |
1.419 |
0.233 |
||||
Shock stage |
38.145 |
23.212 |
0.975 |
0.955 |
||||||
Recovery stage |
33.698 |
20.856 |
0.971 |
0.683 |
||||||
Panel B: Post Hoc Test (Tukey HSD) |
||||||||||
(I) Group |
(J) Group |
Mean Difference (I-J), % |
Std. Err.,% |
Sig |
95% Confidence Interval |
|||||
LB |
UB |
|||||||||
Growth stage |
Shock stage |
-15.338 |
6.608 |
0.040 |
-31.219 |
0.543 |
||||
Recovery stage |
-10.892 |
5.343 |
0.021 |
-23.734 |
1.949 |
|||||
Shock stage |
Growth stage |
15.338 |
6.608 |
0.026 |
-0.543 |
31.219 |
||||
Recovery stage |
4.446 |
6.734 |
0.038 |
-11.737 |
20.629 |
|||||
Recovery |
Growth stage |
10.892 |
5.343 |
0.021 |
-1.949 |
23.734 |
||||
Shock stage |
-4.446 |
6.734 |
0.038 |
-20.629 |
11.737 |
|||||
The highest standard deviation of relative level of GFC fluctuation is in shock stages (23.212%) and the lowest standard deviation is examined in growth stages (14.986%). There were no outliers in the data-series. RLF(GFC)-score was normally distributed for the all phases, as assessed by Shapiro-Wilk's test (p > .05). There was homogeneity of variances, as assessed by Levene's test of homogeneity of variances (p = 0.233). Panel A in Table 2 represented statistically significant differences in RLF(GDP)-score between the different stages of economic cycles, F (2, 60) = 3.474, p = 0.87.
Panel B in Table 2 shows the result of multiple comparisons (Post Hoc Test) between group of RLF(GFC)-score. Tukey post hoc analysis revealed that the increase RLF(GFC)-score from growth to shock phases (15.338, 95% CI (-31.219 to 0.543)) was statistically significant (p = .040), as well as the increase from recovery stage to shock (4.446, 95% CI (-20.629 to11.737), p = 0.038), and other group differences were statistically significant.
Figure 2
The group means of RLF-score
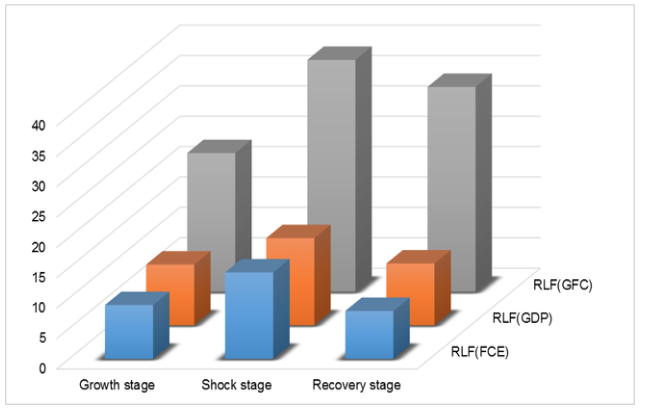
Source: Composed by the authors according to State Statistics Service of Ukraine data
The group means of RLF(GFC)-score were statistically significant different (p > 0.05) and, therefore, we reject the null hypothesis and we accept the alternative hypothesis.
We carried out a one-way ANOVA analysis for the RLF(FCE)-score (the detailed results are not shown because of space constraints). Comparing the results for RLF(GDP)-score and RLF(FCE)-score we have found that descriptive statistic and result of Tukey HSD test are similar.
As we have seen, Figure 2 shows significant difference between values of RLF parameters in each stages of economic cycles, which is especially true for the RLF(GFC)-score. This result implies that gross capital formation level conditional fluctuations have higher influence on long-term trend than final consumption expenditure level conditional fluctuations. The comparison of macro indicators and related RLF-scores has led to the conclusion: there isn`t a significant link between level of fluctuation and absolute value of gross national product components.
For example, the upmost level of GFC volatility happened between 2013 and 2015 (81.617%), i.e. in the shock stage with the 82,418% reduction of quarterly GFC. On the other hand, similar level of reduction of quarterly GFC (82.275%) was connected with the upmost level of GFC volatility (64.927%) which happened between 2008 and 2009. These findings indicate that «fluctuation movements» of social-economic system`s elements (parameters) are more sensitive to destruction of old system connections and emergence of new organizational forms and new interconnections. So flows of investment and consumer expenditures reflects institutional and structural changes in national economy.
In this article, we have focused on the idea of existence the significant relationship between short-term fluctuations and stages of economic cycles. Study covers three major macro indicators and related RLF-scores (GDP, GFC and FCE) within the time span of 15 years. The empirical findings presented here indicate that level of relative fluctuation can change over time, not only because of difference in stages of economic cycles, but because the mechanisms that shape national socio-economic system as organic wholeness may themselves evolve and change. «Fluctuation movements» is not a static characteristic of economic cycles stages, but a dynamic process, has been influenced both by the impact of shocks and by institutional and structural changes in national economy. Within the limitations of the available statistical data used here, the findings in this paper suggest that volatility of investment flow (RLF(GFC)-score) are key influences on the long-term growth and recovery trends of economic cycle phases.
1. Rose, A., Liao, S-Y. (2005). Modelling regional economic resilience to disasters: a computable general equilibrium model of water service disruptions. Journal of Regional Science, 45, 75–112.
2. Heltberg, R., Siegel P., Jorgensen S. (2009). Addressing Human Vulnerability to Climate Change: Toward 'No Regrets' Approach. Global Environmental Change, 19(1), 89-99.
3. Martin, R.L. (2014). Path dependence and the spatial economy: a key concept in retrospect and prospect’, in Fischer, M. M. and Nijkamp, P. (eds): Handbook of Regional Science. Springer, Heidelberg.
4. Plotnikov, D. (2013). Hysteresis in unemployment and jobless recoveries. UCLA, Working paper.
5. Augustine, N., Wolman, H., Wial, H., McMillen, M. (2013). Regional Economic Capacity, Economic Shocks and Economic Resilience. MacArthur Foundation Network on Building Resilient Regions, Working Paper May, Institute of Government Studies, University of California, Berkeley.
6. Hamilton, J.D., Owyang, M.T. (2012). The Propagation of Regional Recessions. Review of Economics and Statistics, 94(4), 935-947.
7. Burlutski, S., Burlutski, Sv., Margasova V. (2017). Resilience indicators for measuring sustainable economic development. Journal of Life Economics, 12(4), 35-48.
8. Kovalev V., Burlutskiy S., Burlutska Sv. (2017). The «resources curse» phenomenon in context of socio-economic transformation of Ukrainian economy, in Głowski, P. and Kvilinskyi O. (eds), Economic transformation in Ukraine: comparative analysis and European experience. Warsaw: Consilium Sp. z o.o., pp.147–155.
1. Doc.Sc. in Economics, Assoc. Prof. Departmen of Enterprise Economy. Donbass State Engineering Academy. Ukraine. E-mail: magistrdr@gmail.com
2. Doc.Sc. in Economics, Assoc. Prof. Departmen of Enterprise Economy. Donbass State Engineering Academy. Ukraine. E-mail: lanavb75@gmail.com
3. Doc.Sc. in Economics, Professor. Department of Accounting, Taxation and Audit. Chernihiv National University of Technology. Ukraine. E-mail: viktoriya.margasova@gmail.com
4. PhD. in Economics, Assoc. Prof. Department of Accounting, Taxation and Audit. Chernihiv National University of Technology. Ukraine. E-mail: sakunalexandra@gmail.com