![]() ISSN 0798 1015
ISSN 0798 1015

![]() ISSN 0798 1015
ISSN 0798 1015
Vol. 40 (Number 10) Year 2019. Page 17
ALEXAKIS Christos 1; IGNATOVA Tatiana 2 & POLYANIN Andrei 3
Received: 03/01/2019 • Approved: 03/03/2019 • Published 31/03/2019
ABSTRACT: The purpose of this paper is to investigate the possibility of short run dynamics among sectorial stock markets of the Moscow Exchange (MOEX). “Causality” tests provide a statistical framework of testing the extent of possible links among equity indices. In addition, we examine the degree of autocorrelation of the indices in order to examine the speed of adjustment to news. Our results indicated that the degree of autocorrelation is close to zero giving support that the Moscow Exchange is an efficient market in the weak form. |
RESUMEN: El propósito de este documento es investigar la posibilidad de dinámicas a corto plazo entre los mercados de acciones sectoriales de la Bolsa de Moscú (MOEX). Las pruebas de "causalidad" proporcionan un marco estadístico para probar el alcance de los posibles vínculos entre los índices de acciones. Además, examinamos el grado de autocorrelación de los índices para examinar la velocidad de ajuste a las noticias. Nuestros resultados indicaron que el grado de autocorrelación es casi nulo, lo que da soporte para que la Bolsa de Moscú sea un mercado eficiente en forma débil. |

The structure of this paper includes a brief description of the Moscow Stock Exchange and the methodology used, the statistical results and finally conclusions and policy implications.
Moscow Exchange is the 22nd largest exchange by total capitalisation of shares traded on international stock markets. It is a result of a merger of Moscow Interbank Currency Exchange and Russian Trade System in 2011. Moscow Exchange went public in February 2013 and is traded on its own trading platform under the ticker ‘MOEX’.
Moscow Exchange hosts trading in equities, bonds, derivatives, currencies, money market instruments and commodities. The Group also includes Russia’s central securities depository «the National Settlement Depository» and the National Clearing Centre, which performs the function of central counterparty. Moscow Exchange ranks among the 10 largest exchange platforms for bonds and derivatives trading. Securities of over 700 issuers are admitted to trading on the equity and bond markets of Moscow Exchange.
Its’ market capitalization in March, 2018 was 646,85 bln adjusted US dollars. With range of capitalization from 949 bln adjusted US dollars in 2010 to 583 bln adjusted US dollars in 2014. A primary currency used by MOEX is Russian Ruble and its’ fluctuations result in capitalization assessment and undervaluation of Russian stock market. Market capitalization to GDP ratio is 30,61% and in comparison with other developed national stock markets it is undervalued. More information and daily trade data could be found on moex.com.
A Fair Game model is derived from the Martingale model:
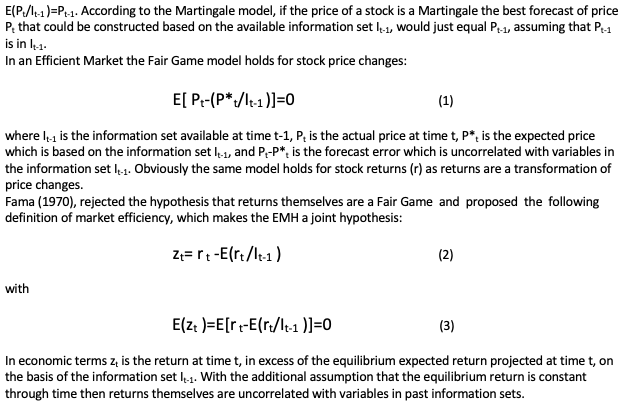
The assumption that the equilibrium return is constant through time is crucial for empirical tests because as LeRoy (1989) classically noted, "On Fama's definition any capital market is efficient and no empirical evidence can possibly bear the question of market efficiency."
Most of the empirical tests for market efficiency usually examine whether known information exists which could help to predict profitably stock returns. Most of the empirical tests for market efficiency usually examine whether known information exists which could help to predict profitably stock returns, as it was done at the beginning of relevant studies by Muth (1961), Osborne (1962), Cootner (1962), Fama (1970), LeRoy (1989), Cutler, Poterba and Summers (1991). While initial studies could not reject the Random Walk hypothesis, later findings are mixed: Alexakis and Pappas (2018), Casarin and others (2008), Dasilas and Grose (2014), Ignatova and Alifanova (2018), Niarchos and Alexakis (2003).
In this study, we will test the market efficiency for the Moscow Stock Exchange. Analytically, we will test for the possibility of predictive statistical relationships between the sectorial indices of the Moscow Stock Exchange in a univariate and a bivariate analysis.
A popular method to examine the existence of a temporal statistical relationship with predictive value between two time series is the Granger “causality” test. Granger’s definition for “causality” is in terms of predictability: A variable X causes another variable Y, with respect to a given information set that includes X and Y, if present Y can be better forecasted by using past values of X than by not doing so.
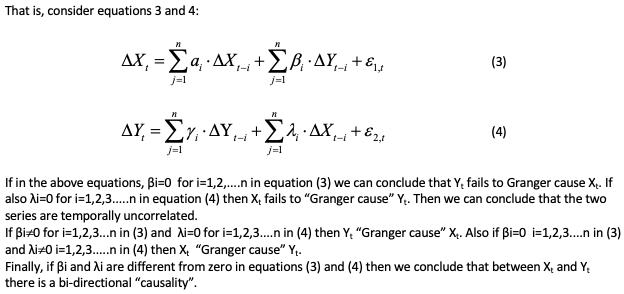
Note that in all the above regressions ε1,t and ε2,t should be white noise and uncorrelated at any lag other than t. It is obvious from the above that the presence of “causality” between two stock price histories implies market inefficiency since one stock price series can be forecasted by the use of another stock price series.
In our statistical analysis we used a dataset of daily closing prices of sectorial indices of the Moscow Stock Exchange (moex.com).
The time period used is from September 15, 2015 to December 29, 2018 with a total of 599 observations for every stock market index. To perform the above analysis, we used the logarithmic transformation of the original closing values series.
The order of integration of a series may be ascertained by the application of a set of tests, commonly known as test for unit roots. We performed the Augmented Dickey-Fuller in order to ensure uncorrelated and homoscedastic residuals in the test regression, Dickey and Fuller (1981). Table 1 presents the Augmented Dickey-Fuller test statistics for the series under examination. The results suggest that each of the series is integrated of order one, I~(1). Thus, econometric analysis will be performed on the first difference transformation of the original series.
Table 1
Unit root tests
Variables |
Basic material |
Energy |
Gas |
Metals |
Minerals |
Oil |
Level |
-2.06 |
-2.38 |
-2.39 |
-1.57 |
-1.68 |
-2.39 |
Difference |
-23.50** |
-24.33** |
-24.23** |
-23.46** |
-23.52** |
-24.23** |
Note: Double star (**) denotes significance at 99% confidence interval
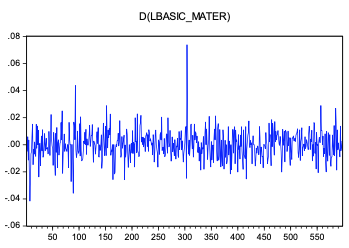
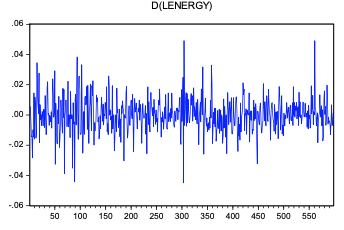
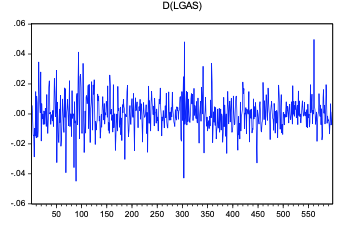
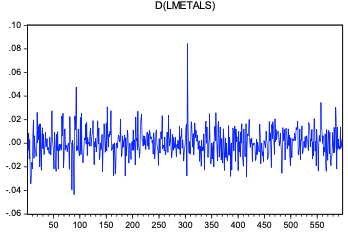
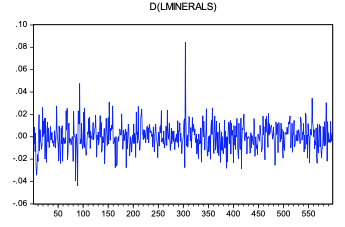
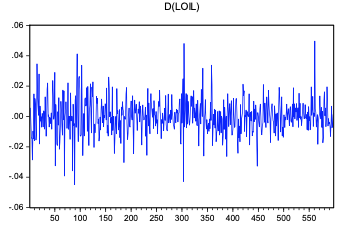
A visual of the series under investigation can be found in Figures 1 to 6. The series are quite volatile from period to period but the picture is close to the picture of a stock price index.
Figures 1 – 6
Sectorial returns of the Moscow stock exchange
Figure 1
|
Figure 2
|
Figure 3
|
Figure 4
|
Figure 5
|
Figure 6
|
Next we estimated the autocorrelation function of the series under investigation. The relevant Q statistics indicate that there is no significant autocorrelation (Table 2). Based on the above statistical results we may say that the examined stock market indices and for the examined period support the Efficient Market Hypothesis.
Table 2
Autocorrelation function
|
Basic material |
Energy |
Gas |
Metals |
Minerals |
Oil |
Lag |
Q statistic |
Q statistic |
Q statistic |
Q statistic |
Q statistic |
Q statistic |
1 |
0.7927 |
0.0017 |
0.0195 |
0.8639 |
0.8730 |
0.0195 |
2 |
0.7937 |
1.2945 |
1.4981 |
0.8880 |
0.8967 |
1.4979 |
3 |
2.0524 |
1.9462 |
2.2496 |
1.6608 |
1.6674 |
2.2488 |
4 |
2.5436 |
1.9737 |
2.3158 |
1.9843 |
1.9896 |
2.3149 |
5 |
7.0713 |
2.0531 |
2.4114 |
5.8507 |
5.8552 |
2.4103 |
As a next step, in order to find any possible “causalities” between the examined stock markets we performed the standard Granger tests. As suggested by the unit roots tests the Granger tests will be performed on the difference transformation of the original series. Table 3 presents the Granger “causality” results. Note, that in order to perform the tests we included lagged terms sufficient to ensure white noise residuals in the regressions but also we took in to account model selection information criteria. In addition, we estimated the models by specifying the residuals to take into account ARCH effects.
Table 3
“Causality” tests
Variable Y |
Variable X |
F statistic |
F statistic |
“Causality” direction |
Basic material |
Energy |
1.47 |
0.84 |
No “causality” |
Basic material |
Gas |
1.41 |
0.84 |
No “causality” |
Basic material |
Metals |
0.74 |
1.24 |
No “causality” |
Basic material |
Minerals |
0.75 |
1.26 |
No “causality” |
Basic material |
Oil |
1.41 |
0.84 |
No “causality” |
Energy |
Gas |
3.46** |
3.34** |
Bidirectional |
Energy |
Metals |
1.46 |
1.77 |
No “causality” |
Energy |
Minerals |
1.46 |
1.78 |
No “causality” |
Energy |
Oil |
3.47** |
3.34** |
Bidirectional |
Gas |
Metals |
1.46 |
1.68 |
No “causality” |
Gas |
Minerals |
1.46 |
1.69 |
No “causality” |
Gas |
Oil |
0.14 |
0.15 |
No “causality” |
Metals |
Minerals |
1.79 |
1.75 |
No “causality” |
Metals |
Oil |
1.68 |
1.46 |
No “causality” |
Minerals |
Oil |
1.69 |
1.46 |
No “causality” |
Note: Double star (**) denotes significance at 99% confidence interval
From the above table, the statistical evidence suggests that between sectorial indices of the Moscow Stock Exchange there are no price linkages, at least in the short run, except the cases, energy-gas and energy-oil.
In this study we proved statistically that the short run dynamics between sectorial indices of the Moscow stock exchange shows efficiency of the market for the period under examination. While univariate and bivariate analysis, autocorrelation analysis and standard Granger “causality” tests were performed, our results for assessment of the situation at the Moscow stock exchange prove that the above efficiency is an element that attracts international investors. Thus, we offer that the Russian Authorities should support and keep the focus on the Moscow Stock Exchange since it can be proved a pillar for the financial development of the Russian economy.
Alexakis Ch. and Pappas V. (2018). Sectoral dynamics of financial contangion in Europe – The cases of recent crises episodes. Economic Modelling, 78, 37-54.
Casarin R., Piva A., Pelizzon L. (2008). Italian equity funds: Efficincy and performance persistence. The UIP Journal of Financial Economics, 0(1), 7-28.
Cootner P.H. (1962). Stock prices: Random walk Vs systematic changes. Industrial Management Review, 3, 24-45.
Cutler D.M., Poterba J.M., Summers L.H. (1991). Speculative dynamics. Review of Economic Studies, 58, 529-541.
Dasilas A. and Grose C. (2014). Performance persistence in fixed interest funds: With an eye on the post-debt crisis period. Journal of International Financial Markets, Institutions and Money, 33, 155-182.
Dickey D.A. and Fuller W.A. (1981). The likelihood ratio statistics for autoregressive time series with a unit root. Econometrica, 49, 1057-1072.
Fama E. (1970). Efficient capital markets: A review of the theory and empirical work. Journal of Finance, 25, 383-416.
Ignatova T. and Alifanova E. (2018). Institutional characteristics of budget financing of public sector. Financial Studies, 2, 20-26.
LeRoy S.F. (1989). Efficient capital markets and martingales. Journal of Economic Literature, XXVII, 1583-1621.
Muth J.F. (1961). Rational expectations and the theory of price movements. Econometrica, 29, 315-335.
Niarchos N. and Alexakis Ch. (2003). Intraday stock price patterns in the Greek stock exchange. Applied Financial Economics, 13(1), 13-22.
Osborne M.F.M. (1962). Periodic structure in the Brownian motion of stock prices. Operations Research, 10, 345-379.
1. ESC Rennes School of Business, France
2. South-Russia Institute of Management – branch of the Russian Academy of National Economy and Public Administration, Russia
3. Middle-Russia Institute of Management – branch of the Russian Academy of National Economy and Public Administration, Russia. polyanin.andrei@bk.ru