![]() ISSN 0798 1015
ISSN 0798 1015

![]() ISSN 0798 1015
ISSN 0798 1015
Vol. 40 (Number 10) Year 2019. Page 22
LIZARZABURU, Edmundo R. 1; NORIEGA, Eduardo 2; OSTOS, Jhony 3 & BERGGRUM, Luis 4
Received: 12/09/2018 • Approved: 22/03/2019 • Published 31/03/2019
6. Evolution of Real Pharma on the market the last 5 years
7. Assumptions of Real Pharma for 2021
10. Some conclusions and recommendations of the top-down analysis
ABSTRACT: The present case study seeks to guide the potential investor through the process of analyzing the financial situation of a company to be able to make an adequate deal for an acquisition or invest. The case intends to follow a top-down analysis structure as follows: a macroeconomic analysis, which covers the gross domestic product, inflation and others; followed by a sectorial study, which comprises the study of competitors, suppliers, clients, and others; and the company’s analysis both from a financial and non-financial perspective. |
RESUMEN: El presente estudio de caso busca guiar al inversionista potencial a través del proceso de análisis de la situación financiera de una empresa para poder hacer un trato adecuado para una adquisición o inversión. El caso pretende seguir una estructura de análisis descendente de la siguiente manera: un análisis macroeconómico, que cubre el producto interno bruto, la inflación y otros; seguido de un estudio sectorial, que comprende el estudio de competidores, proveedores, clientes y otros; y el análisis de la compañía tanto desde una perspectiva financiera como no financiera. |

The Gastrin Group started with two companies named Real Pharma and Extra Pharma, the first one was incorporated to the group in 2003 as an importer of pharmaceutical products, also gave marketing and operates the distribution of the pharmaceutical products that they import for human relief. Their product were designed for cardiovascular system disorders, central nervous disorders, digestive and other important disorders or health complications.
The other company is Extra Pharma that was incorporated five years later (2008) as the laboratory for the manufacture of pharmaceutical products for human consumption with prescription and the free prescription ones.
Both companies together had more than 300 employees distributed in different areas like operations, sales, marketing, administration, and others. The brand for the products that Extra Pharma manufactures is named "Pharmac", this brand has been in the 30 top corporations of the pharmaceutical sector with more sales and activity (without consider size), and also has been recognized with prestige by the market (market share in the private and public sector).
In 2016, the company had high expectations of increasing their sales with a conservative scenario, this increase was calculated in a 15%, and it consider the economic expectations of Peru, a forecast of the sales with a 35% growth (according to 2015), and their position (brand) in the market and knowledge of the pharmaceutical sector.
The group was looking for a regional expansion in America (regional level) like Bolivia, Colombia, Central America and others markets were in evaluation. Also the group in creating important relationships with their stakeholders (mainly the distributors and strategic partners). As Lizarzaburu (2014), the relationships with stakeholders increase the value of the companies and a good management could give significant advantages in the market.
The Gross Domestic Product (GDP) had a growth in the first half of the year (Q1 and Q2) of four percent (4.0%) in comparison of the 2015 growth (in the same time frame). The growth is associated with the variations or dynamism of the main sectors of Peru, which are the following ones:
Mining and Hydrocarbons (18.8%), Trade (2.3%), Transport, Storage, Mail (3.4%), Services (2.43%), Financial and Insurance (2.43%), Public Administration, Defense and Others (4.7%).
Block, J.H., Colombo, M.G., Cumming, D.J (2018), mentioned in their investigation in the Malaysian Property Market that the GDP is an important factor for the dividends payout that is related with the growth of the sector, company and returns. In the Peruvian economy it was expected that during the years 2017 and 2018, the GDP registers a growth of 4.5% and 4.2% respectively.
The investment in the private sector has been slowing down in the first semester of 2016 (approximately in a -4.6%). The Business Confidence Survey explained that there was a favorable trend in the Peruvian market that was composed by the sustainable recovery of production, the growth in employment, incomes and other factors in the public and private sector (mainly projects). The recovery expectations in the survey showed a 5% of growth in the following years.
In the first semester of 2016, the private consumption was increased in a 3.5%, these growth was a consequence of the client’s and consumer’s confidence. The consumer index of August 2016 showed a 66 point mark, which is higher than the last year mark (August 2015 got 62 points). With the growth of the confidence in the market, there’s a projected private consumption (growing) for 2017 and 2018 with a growth of 3.8% for 2017 and for 2018 would be a 4.0%.
In July 2016, a growth in the commerce sector was recorded and it was determined by the increase of the wholesale and retail trade (1.22%). The sale of solid, liquid and gaseous fuels mainly increase the wholesale trade in a 1.24%, also the sale of home appliances, pharmaceutical products, cosmetics and the mid-year celebrations like “Fiestas Patrias” or Independence Day allowed the wholesale trade sector to grew in that proportion. The increase was caused by the better distribution and rotation of sale points and the products portfolio (expansion). However, it decreased the sale of other industries like the electronic equipment, telecommunications (increase of competitors), and others like machinery and equipment.
In 2016 the health sector slightly grew with a 0.43%, which is explained by the increases of the prices in the pharmaceutical products (0.6%), the main products that influence the variations are the followings:
Ophthalmic decongestants 1.3%, Allergy & Antihistamines 1.1%, Analgesics & Antipyretics 1.0%, Laxatives, 0.9%, Antibiotics and Sulfa Drugs 0.8%, Vasodilators Asthmatic and Bronchodilators with 0.8%, Natural products 0.7%, Others 0.4%
Florian Castro (2017) describes the pharmaceutical industry citing h & Dieck (1989), as a big corporation that depends of research and development (R&D) to grow and bring benefits to society. According to Aguilar, Espejo & Navarro (2017), the pharmaceutical industry distinguishes itself as an oligopolistic market, where competition worldwide is controlled by a handful of companies. Kesič & Bertoncelj (2008) mention that the pharmaceutical industry is composed by eleven components, acknowledged as “11-P Chain”: product, patent, price, plance, promotion, payers, providers, physicians, pharmacists, pharmaceutical industry, patients.
Papageorgiou, Rotstein & Shah (2001) mention that pharmaceutical companies have constantly to adapt to the new challenges presented by globalization, diversity and complexity of newly developed drugs, and other factors affecting the business value chain. Chaturvedi et al. (2017) add the growing preoccupation of governments, customers and other stakeholders regarding sustainable practices to the challenges to be faced by the pharmaceutical industry, that consider environmental, economic and social aspects. According to Yeoh & Calantone (2015) after decades of uninterrupted growth, the industry is facing a period of dynamic change and instability, partially because of the toughening competition of generic drugs, shorter patent terms, and increasing R&D costs. Chen, Wang & Ou (2017) mention that pharmaceutical companies also deal with the issue of drug efficacy failure occurring during the process of transportation of the medicines. Vashi & Latkowski (2012) depict pharmaceutical companies as the sponsors of biomedical research that aims to develop new therapies to prevent, stabilize and cure illnesses.
The Peruvian market is composed by different actors and each one has a specific role in the industry of health. In the following Figure there is a summary of the main actors of the pharmaceutical market.
Figure No. 1
Composition of the Pharmaceutical Market
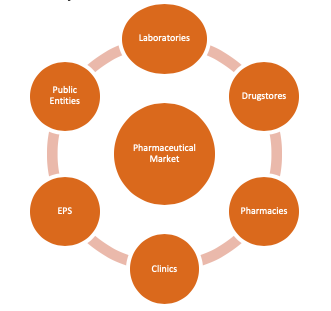
Source: Own Elaboration
1. There are more than 400 pharmaceutical laboratories and almost all of the laboratories are concentrated in Lima, representing the 93% of laboratories in the capital.
2. Drugstores are commercial establishments authorized by the DIGEMID (General Direction of Medicines, Inputs and Drugs) to import and/or marketing pharmaceutical products wholesale (Retuerto Moreno, 2017). In the Peruvian market, distributors and importers often serve as drugstores.
3. Pharmacies are the establishments in which they are dispensed and expand pharmaceutical products with retail and provide optional counseling the customer in their medication for a chemical-pharmaceutical (Retuerto Moreno, 2017).
4. In Peru, the public institutions are formed by the Social Health Insurance also known as EsSalud, also the Ministry of Health (MINSA) have their own establishments, and the Armed Forces and National Police.
Regarding Peruvian Government Legislation concerning the pharmaceutical industry, Phang Romero (2002) commented that it’s characterized by being fragmentary, incomplete and often incongruous, and aimed wrongly to the public sector despite the fact that 87% of the pharmaceutical market served private consumers.
The brand Pharmac has been positioned as an important brand in the pharmaceutical industry of Peru. The brand started in 2003 and its participation in the market has been increasing year past year, creation an interesting market share in the private and public sector, traditional, non-traditional market. The main activity of Real Pharma is the drugstore operations, which consists in the development, management, marketing and distribution of pharmaceutical products for human relief. Their product were designed for cardiovascular system disorders, central nervous disorders, digestive and other important disorders or health complications.
The main customers of Real Pharma are the two most important pharmaceutical chains of pharmacies in the Peruvian market. The two chains are of the Intercorp group and Quicorp group. The clients of Real Pharma are detailed in the client portfolio, which is observed in chart 1.
Chart 1
Client Portfolio
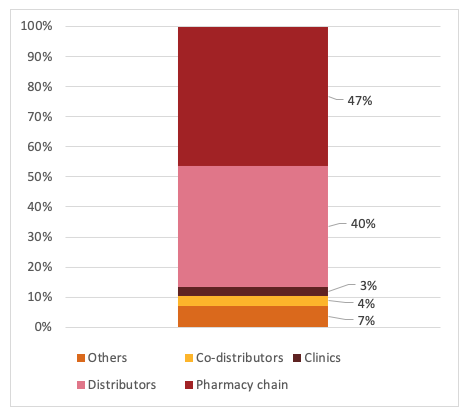
Source: Own Elaboration
Real Pharma has been growing because of their reactions and their plans against the new challenges that the pharmaceutical industry has been giving, also they have been increasing their portfolio of products since 2003, and the growth of their products has been achieved because of their quality standards, guarantees, differentiation and their prices. The company organic structure has been evolving in the years but that did not change their mission of improve people life style and life’s quality.
In the report of the IMS, there has been a growth in the market for Real Pharma, this growth was consider until March of 2016 and compares the actual situation of the company against their previous situation and also with a contrast of the market evolution. In the 5 years, it has shown a growth of sales (six times greater than in 2012) and it passed from 1,169 to 7,359 (both measured in million dollars). According to Burneo, Barriga, Lizarzaburu & Noriega (2017) the growth of companies are an important driver for any financial plan or strategy, which Real Pharma was considering for their future incomes.
Their market share also increased in the 5 years obtaining a 0.75% in the report, the market share create a position between the 30 local and international companies that are consider as the most relevant in Peru (market). According to the report, the company has also positioned as the 5th company of Peruvian capital market (market with more than 450 pharmaceutical drugstores).
Also has been an evolution for Real Pharma in the Peruvian market in volume (units), in the same period of time (2012-2016) the company grow 7 times during the 5 years, this evolution was measured in 2012 with a level of 230 million and in the year 2016 grew until 1,662 million (both units), which represent a market share of 1.19% and gave them a position between the 21 local and international companies that are consider as the most relevant in Peru (market). According to the report, the company has also positioned as the 5th company of Peruvian capital market (market with more than 450 pharmaceutical drugstores).
As was mentioned before, the company have a goal for 2021 that is to consolidate their expansion in Central America, Colombia and Bolivia (exportation expansion). Taking into consideration the current pharmaceutical market and the characteristics of it (stable and with growth perspective), the company estimated a growth (for the corporation) in the followings 5 years it is estimated that the corporation will succeed in the next 5 years under a very conservative scenario, a growth of 21,300 million dollars, and it will give better results for Real Pharm with an expected rate of 12%.
According to Burneo & Lizarzaburu (2016), in the financial evaluation of any company there is an important parts in which companies propose different strategies to achieve their goals. In the case of Real Pharma to achieve the goals for 2021 is with two strategies, the first one would be a medium term that will be accomplished by 2018 and 2019 and the long term that will be for 2021. The strategies or objectives that will be mentioned were considering the competitors in the sector and the evolution of the companies in this sector in all the world.
To improve the gross margin at least 7.5%.
Achieve and consolidate a market share between 0.5% and 0.6% in prescriptions.
To maintain the certifications in BPA, BPM and ISO 9001:2008
To achieve an integrated system through certifications like (OHSAS 18001:2007, ISO 14001:2004 and ISO 26000; as well as the certification in the Good Laboratory Practices).
Improve the gross margin to more than 10%.
Achieve a market share 0.6% and 0.7% in recipes.
To consolidate the policy of Total Quality to maintain their clients or customers that recognize Real Pharma for it.
The company Real Pharma, has good growth prospects for the prospect evaluated. In fact, growth expectations involve spending about 10 million US dollars in gross sales to levels exceeding 17 million US dollars after 2022. This significant growth can be based on the following factors:
Portfolio annual increase for the next 5 years, specialties representing more than 20 million dollars in annual sales.
Increasing penetration in 2% annually.
Launches of new exclusive line of natural products with advantages and pharmaceutical benefits.
Increasing vertical penetration (key accounts) and private clinics, which together represent 20% of the current sale. Vertical penetration means placing more portfolio within a single client.
The work of medical visit and demand generation will be the pillars for the development of brand power in the coming years. Achieving to reach 0.75% of market share in 2021.
The Real Pharma sales costs could be assume as the proportion of the vertical analysis in the years before, however the increase of sales and quality standards should help the gross margins to stay stable or to receive a slight growth.
The explanation mentioned before, represents that that the expected that the ratio of revenues (gross sales) and cost of sales is kept constant at least for the period of assessment. Cost of sales represents 56% of gross income in 20161, so is relevant proportion in relation to the margins of other companies. These costs over the next two years will have lower growth in proportion to income due to reengineer held in the organization to optimize costs, so is expected to achieve a highly competitive gross margin and not to exceed the proportion growth of costs in relation to income, to ensure greater access to investment market penetration.
Regarding the costs of sales and administration, it is planned to assign the same rate as revenue growth path. Obviously, the reader can expect a company seeks to make efficiencies to optimize processes and generate cost savings, but since are planned higher investments in research and development, and enhance sales channels and promotion, it is very likely that these effects are compensated.
However, in the last year, the firm has made a re-engineering costs and expenses to generate improved margins at all levels. For example, staff costs have generated an expected savings of 254 million dollars for next year due to improved efficiencies taken by the commercial area. An assessment of processes and positions where issues such as duplication of functions, lack of segregation of duties, among other reasons for the departure of several workers generating savings identified above was performed. Another significant cost reduction was the decision to dispense with the administrative office was located outside the plant and it meant 135 million dollars per year, the same that will become savings. Note that this step was taken this year.
The following questions must be answered with the case analysis, each question must have their own analysis and all of them must be supported with the case and assumptions if they are needed. The questions are the followings:
Elaborate the Horizontal Analysis of the Balance Sheet for the years 2011-2015 (independently)
Discuss and analysis for the short-term and long-term trends that you can identify in the case.
Elaborate the Vertical Analysis of the Profit & Loss for the years 2011-2015 (independently)
Calculate the liquidity, solvency and profitability ratios (Financial ratios analysis) and their evolution for the years 2011-2015.
Elaborate a Free Cash Flow of the Firm considering the case information and the evolution of the company.
Conclusions and recommendations of the top down analysis with the case and results of the previous questions.
Table 1
Balance Sheet (2011-2015)
Balance Sheet |
Dec-11 |
Dec-12 |
Dec-13 |
Dec-14 |
Dec-15 |
Current assets |
4,919,846 |
7,084,561 |
5,026,673 |
6,951,727 |
7,621,375 |
Non-current Asset |
3,319,810 |
3,825,685 |
4,165,563 |
6,744,484 |
7,039,633 |
Total Assets |
8,239,656 |
10,910,246 |
9,192,236 |
13,696,211 |
14,661,008 |
Current liabilities |
4,553,849 |
6,631,483 |
4,501,518 |
6,135,610 |
6,642,523 |
Non-current liabilities |
1,402,733 |
765,953 |
1,258,897 |
1,663,431 |
2,532,907 |
Total Liabilities |
5,956,582 |
7,397,436 |
5,760,415 |
7,799,041 |
9,175,430 |
Total Equity |
2,283,074 |
3,512,810 |
3,431,821 |
5,897,170 |
5,485,578 |
Total Liabilities and Equity |
8,239,656 |
10,910,246 |
9,192,236 |
13,696,211 |
14,661,008 |
Source: Real Pharma Statements
-----
Table 2
Profit & Loss (2011-2015)
P&L |
Dec-11 |
Dec-12 |
Dec-13 |
Dec-14 |
Dec-15 |
Sales |
5,943,865 |
7,138,362 |
7,282,504 |
7,095,780 |
8,353,753 |
Cost of Sales |
3,282,527 |
3,545,869 |
3,926,251 |
4,132,540 |
4,324,379 |
Gross Profit |
2,661,337 |
3,592,492 |
3,356,253 |
2,963,240 |
4,029,374 |
Costs and Operational Costs |
2,227,577 |
2,395,510 |
2,671,952 |
2,140,098 |
2,677,287 |
Operating Result |
433,760 |
1,196,982 |
684,301 |
823,142 |
1,352,087 |
Financial expenses |
177,535 |
430,879 |
163,758 |
502,249 |
747,564 |
Net Profit |
180,176 |
441,119 |
226,931 |
278,132 |
324,149 |
Source: Real Pharma Statements
Fundamental analysis Peruvian non listed company - Real Pharma. Teaching Notes
As is well known, this type of analysis is designed to show the percentage change that have experienced the main accounts in the statements of results and financial situation in the short and long term to observe, in the first place, significant changes in the recent periods and secondly, the tendency of a period of representative analysis. The importance of this analysis for the current project lies in the observation of the accounts in the last year with respect to the previous one and to the developments that have had these in recent years in order to observe the prospects for long-term growth that have the companies in question and thus to be able to confirm their repayment capacity of the funding to which they are applied.
The analysis will begin in the revision of the main accounts of the statement of situation of Real Pharma based on the period 2011-2015. As it can be seen in the box below, is the horizontal analysis for the period 2011-2015.
Table 3
Horizontal analysis 2014-2015 (%)
Balance Sheet |
Dec-11 |
Dec-12 (1) |
Dec-13 (2) |
Dec-14 (3) |
Dec-15 (4) |
1 |
2 |
3 |
4 |
Current assets |
4,919,846 |
7,084,561 |
5,026,673 |
6,951,727 |
7,621,375 |
44.0 |
-29.0 |
38.3 |
9.6 |
Non-current Asset |
3,319,810 |
3,825,685 |
4,165,563 |
6,744,484 |
7,039,633 |
15.2 |
8.9 |
61.9 |
4.4 |
Total Assets |
8,239,656 |
10,910,246 |
9,192,236 |
13,696,211 |
14,661,008 |
32.4 |
-15.7 |
49.0 |
7.0 |
Current liabilities |
4,553,849 |
6,631,483 |
4,501,518 |
6,135,610 |
6,642,523 |
45.6 |
-32.1 |
36.3 |
8.3 |
Non-current liabilities |
1,402,733 |
765,953 |
1,258,897 |
1,663,431 |
2,532,907 |
-45.4 |
64.4 |
32.1 |
52.3 |
Total Liabilities |
5,956,582 |
7,397,436 |
5,760,415 |
7,799,041 |
9,175,430 |
24.2 |
-22.1 |
35.4 |
17.6 |
Total Equity |
2,283,074 |
3,512,810 |
3,431,821 |
5,897,170 |
5,485,578 |
53.9 |
-2.3 |
71.8 |
-7.0 |
Total Liabilities and Equity |
8,239,656 |
10,910,246 |
9,192,236 |
13,696,211 |
14,661,008 |
32.4 |
-15.7 |
49.0 |
7.0 |
Source: Real Pharma Financial Information
Analysis of short-term trend (2014-2015)
As it can be seen from the table, the main asset accounts have presented a conservative growth between the period 2014 - 2015, both current assets as current liabilities, so that there is a certain consistency in that regard, given that cannot be attributed only this growth to a higher level of accounts receivable. By part of the liabilities, there is a significant growth in the account of non-current liabilities (52.3%), this debt, however, only represents 27% of total liabilities. However, it is a fact to consider, given that this debt has been generated in part by investments in assets that were made during this period to improve the productive capacity of the company. In general, the total liabilities have grown only 17% in this period. Finally, about the equity and liabilities has submitted a growth of 7 per cent for this period.
With regard to the analysis of the statement of results, it can be noted that sales of last year were 17% superior to that of the previous period, while the gross profit grew by 36% and the net in 16.5%, these are good indicative of that there is a consistency in the efficiency of the internal management, given that the net profit obtained is consistent with the growth in gross sales. In addition, it is noted that the growth of the cost of sales is much lower than the level of sales, which shows an efficiency at the level of costs. Finally, the financial charges account was the one that presented a significant growth (48.8%).
Analysis of long-term trend (2011-2015)
About the analysis of the long term for the period in question, it can be highlighted the significant growth of the non- current asset is in more than 110%, mainly explained by the series of investments in plant, machinery and equipment, which the company has made in recent years to sustain its growth in the market. In general, the asset has grown by 77 per cent among the period 2011 - 2015. On the liabilities side, this has grown by more than 50% in this period of analysis, being the non-current liabilities the highest growth with more than 80%, largely explained by the investment in assets mentioned above.
There is however no-lose sight of the fact that the current liabilities also grew more than 45%, which if it would involve certain short-term financial complications. In general, the liability and equity grew by more than 77% for this period, where the net equity of the company as made by more than 140%.
Complementing the analysis of the previous point in relation to the state of results it is noted that the sales, the operating margin (or operating result) and the net profit have presented a very growth trend for the period 2011-2015. In the first case, more than 40% while for the net profit, a growth of almost 80%, which reflects the fact that the income generated by sales are not diluted in the costs or expenses, but that maintain the proportionality according to sales.
Table 4
Vertical analysis
P&L |
Dec-11 |
Dec-12 (1) |
Dec-13 (2) |
Dec-14 (3) |
Dec-15 (4) |
1 |
2 |
3 |
4 |
Sales |
5,943,865 |
7,138,362 |
7,282,504 |
7,095,780 |
8,353,753 |
||||
Cost of Sales |
3,282,527 |
3,545,869 |
3,926,251 |
4,132,540 |
4,324,379 |
55.2 |
49.7 |
53.9 |
58.2 |
Gross Profit |
2,661,337 |
3,592,492 |
3,356,253 |
2,963,240 |
4,029,374 |
44.8 |
50.3 |
46.1 |
41.8 |
Costs & Operational Costs |
2,227,577 |
2,395,510 |
2,671,952 |
2,140,098 |
2,677,287 |
37.5 |
33.6 |
36.7 |
30.2 |
Operating Result |
433,760 |
1,196,982 |
684,301 |
823,142 |
1,352,087 |
7.3 |
16.8 |
9.4 |
11.6 |
Financial expenses |
177,535 |
430,879 |
163,758 |
502,249 |
747,564 |
3.0 |
6.0 |
2.2 |
7.1 |
Net Profit |
180,176 |
441,119 |
226,931 |
278,132 |
324,149 |
3.0 |
6.2 |
3.1 |
3.9 |
The results of the P&L statement, there can be analyzed that the main cost is the sales, followed by the operating expenses with 52% and 32%, respectively. The operating result is 16 per cent, while the net profit reaches 4% on the total sales for the period 2015.
In liquidity ratios, they are all those ratios that reveal the position of cash available to sustain regular operations and its short-term obligations so that the entity does not have to resort to sources of emergency resources, which are highly costly. The liquidity ratios tend to respond to an efficient planning of the operational needs of funds, which responds to an estimation model.
Table 5
Liquidity ratios
Liquidity |
Dec - 11 |
Dec - 12 |
Dec - 13 |
Dec - 14 |
Dec - 15 |
Overall liquidity |
1.08 |
1.07 |
1.12 |
1.13 |
1.15 |
Acid Test |
0.96 |
0.94 |
0.87 |
0.98 |
0.95 |
Working capital |
365,997 |
453,078 |
525,155 |
816,117 |
978,851 |
Source: Own Elaboration
As it can be seen in the graphic, the liquidity of the company has been maintained certainly stable in recent years and it has enabled to the firm the capacity to pay their short-term liabilities. It is important to mention the fact that the constant and significant increase of working capital, which is a good indication of the ability of movement and generation of income by the company.
Chart 2
Evolution of liquidity ratios
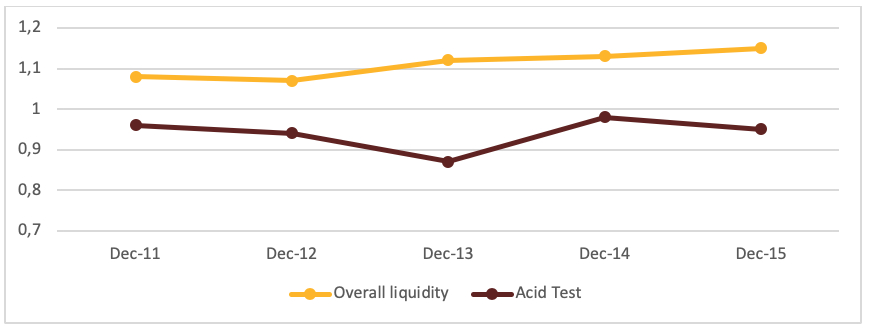
Source: Own Elaboration
The solvency indicators show the capacity of response of a company to its debt, in addition to the quality in its debt structure. Below it is shown the situation of Real Pharma:
Table 6
Solvency ratios
Solvency |
Dec - 11 |
Dec - 12 |
Dec - 13 |
Dec - 14 |
Dec - 15 |
Non-current liabilities/equity |
0.61 |
0.22 |
0.37 |
0.28 |
0.46 |
Financial debt/equity |
2.45 |
1.52 |
1.64 |
1.19 |
1.53 |
Total liabilities/ Equity |
2.61 |
2.11 |
1.68 |
1.32 |
1.67 |
Non-current liabilities/EBITDA |
2.52 |
0.58 |
1.54 |
1.40 |
1.87 |
Financial debt/EBITDA |
10.06 |
4.05 |
6.87 |
5.89 |
6.20 |
Total liabilities/ EBITDA |
10.69 |
5.61 |
7.04 |
6.57 |
6.78 |
Source: Own Elaboration
Increase in its level of debt in relation to its heritage, for example, its current liabilities have grown in 0.28 to 0.46, i.e. the current liabilities are greater relative to the heritage, before was only 0.28 of heritage, but to 2015 comes to represent the 0.46. In the same way, the financial debt has gone from being 1.19 times the heritage to be 1.53 the heritage. This situation can be seen in all indicators of solvency that established relationship between the debt of the company and the heritage. In all cases, debt has grown in relation to heritage. However, there was no evidence of a significant deterioration in the related to the EBITDA, which is indicative that the problem is not income-generating capacity, but debt structure, given that this proportion has increased dangerously due to the high financial costs of having a large part of the debt in current mode and not in modality not current, which means high interest rates.
Chart 3
Evolution of solvency ratios
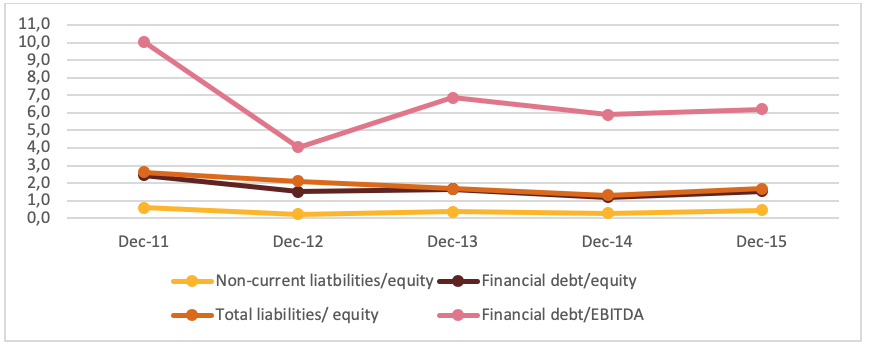
Source: Own Elaboration
The profitability ratios express the firm’s behavior about the generation of value to their investments and shareholders. Then it is shown the main ratios for Real Pharma:
Table 7
Profitability ratios
Profitability |
Dec - 11 |
Dec - 12 |
Dec - 13 |
Dec - 14 |
Dec - 15 |
ROA |
2.19% |
4.04% |
2.47% |
2.03% |
2.21% |
ROE |
7.89% |
12.56% |
6.61% |
4.72% |
5.91% |
Gross Margin |
44.77% |
50.33% |
46.09% |
41.76% |
48.23% |
Operating margin |
7.30% |
16.77% |
9.40% |
11.60% |
16.19% |
Net margin |
3.03% |
6.18% |
3.12% |
3.92% |
3.88% |
Source: Own Elaboration
As can be seen, the firm has submitted an improvement in all its profitability ratios in relation to the period 2014 and has consolidated, in many cases, its sustained growth over the period of evaluation. For example, the ratio of return on assets (ROA) has stabilized between 2 and 2.5 percentage points, while their return on equity (ROE) is around 6%. This is consistent with the permanent increase in sales, as well as its net profit always positive. In the same way, is consistent with the participation of the net profit in relation to total sales, which reflects efficiency in the management of trade and at the level of costs. Margin indicators, as the gross and net operating, reflect this growth and consolidation as shown in the table presented.
Chart 4
Evolution of profitability ratios
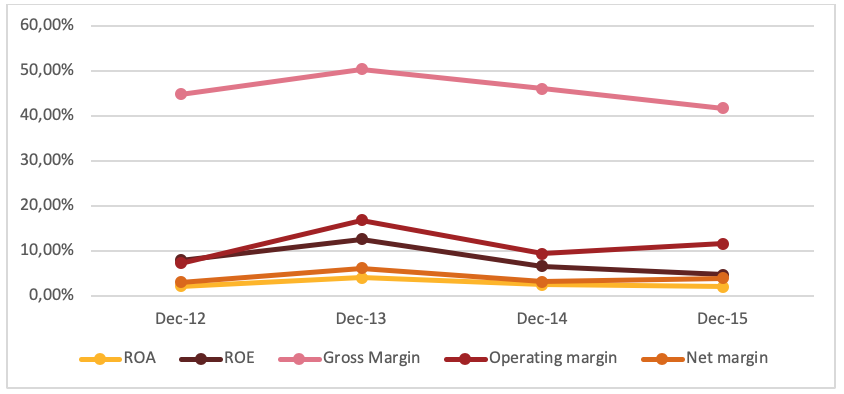
Source: Own Elaboration
Table 8
Profit and Loss Statements
% |
% |
% |
|
Profit and Loss Statement |
2014 |
2015 |
2016 |
Net sales |
|||
Cost of sales |
-58.2% |
-51.8% |
-48.1% |
Gross profit |
41.8% |
48.2% |
51.9% |
Seling expenses |
-17.1% |
-19.3% |
-21.8% |
Administrativa expenses |
-13.1% |
-12.7% |
-12.2% |
Operating result |
11.6% |
16.2% |
17.9% |
Comprehensive financial cost |
-7.1% |
-8.9% |
-12.0% |
Foreign exchange net |
0.1% |
-0.9% |
0.0% |
Utilidad de operación Operating income |
0.0% |
0.0% |
0.0% |
Other income |
2.1% |
0.0% |
0.0% |
Profit before taxes |
6.7% |
6.3% |
5.8% |
Income taxes |
-2.8% |
-2.4% |
0.0% |
Net profit |
3.9% |
3.9% |
5.8% |
Tax-rate |
-42% |
-38% |
-40% |
Source: Own Elaboration
Table No. 9
Growth of Net Sales
Growth |
Growth |
|
(2017-2021) |
(2022-2026) |
|
Net sales (CAGR) |
8.6% |
2.1% |
Source: Own Elaboration
Table 10
P&L Structure
P&L Structure (2017-2026) |
|
Cost of sales |
-52.7% |
Selling expenses |
-19.4% |
Administrative expenses |
-12.7% |
Comprehensive financial cost |
-9.4% |
Source: Own Elaboration
Table 11
Free Cash Flow of the Firm
Free Cash Flow of the Firm (In American Dollars) |
2017 |
2018 |
2019 |
2020 |
2021 |
2022 |
Net sales |
10264 |
11471 |
12821 |
14338 |
16044 |
17970 |
Cost of sales |
-5748 |
-6424 |
-7180 |
-8029 |
-8985 |
-10063 |
Gross profit |
4516 |
5047 |
5641 |
6309 |
7059 |
7907 |
Selling expenses |
-1735 |
-2223 |
-2485 |
-2779 |
-3110 |
-3483 |
Administrative expenses |
-1167 |
-1455 |
-1626 |
-1819 |
-2035 |
-2280 |
Operating result |
1614 |
1368 |
1529 |
1711 |
1914 |
2144 |
Comprehensive financial cost |
-345 |
-385 |
-431 |
-482 |
-539 |
-604 |
Profit before taxes |
1269 |
983 |
1099 |
1229 |
1375 |
1540 |
Income taxes |
-509 |
-395 |
-441 |
-493 |
-552 |
-618 |
Net profit |
760 |
588 |
658 |
736 |
823 |
922 |
Source: Own Elaboration
As the paper structure, conclusions covers first the macro analysis and at the end the micro analysis of the company in analysis. The growth of GDP recorded from January to July of 2016 was 4.0 per cent, compared to the same period. Also, it is expected that during the years 2017 and 2018, the Peruvian economy registered a growth of 4.5% and 4.2% respectively.
The commerce sector in July 2016 recorded a growth of 1.22%, determined by the increase in both the wholesale and retail trade, including pharmaceutical products. With favorable growth perspective, it is estimated that the corporation will succeed in the next 5 years under a very conservative scenario, a growth of USD 21,300,000.
One of the guidelines of the Annual Strategic Plan 2016 is the "restructuring of liabilities", so the company began by adjusting expenses, contributing to improve margins and optimizing costs.
In general, in long term horizontal analysis the liability and equity grew by more than 77% for this period, where the net equity of the company as made by more than 140%. By the side of a vertical analysis, the main cost is the sales. The operating result is 16 per cent, while the net profit reaches 4% on the total sales for the period 2016.
The liquidity of the company has been maintained certainly stable in recent years and it has enabled to the firm the capacity to pay their short-term liabilities. It is important to mention the fact that the constant and significant increase of working capital, which is a good indication of the ability of movement and generation of income by the company.
Debt has increased dangerously due to the high financial costs of having a large part of the debt in current mode and not in modality not current, which means high interest rates.
Finally, the firm as it began a lot of strategies to reduce costs and efficiency so after the buyer inject more equity is seems like it was a very good deal for it.
Aguilar, M. D., Espejo Galindo, A. V. & Navarro Vargas, J. S. (2017). Estimación del poder de mercado de la empresa farmacéutica Pfizer en el mercado privado de medicamentos para el tratamiento de la enfermedad de artritis reumatoide en el Perú. Tesis de pregrado, Universidad Peruana de Ciencias Aplicadas, Perú.
Block, J.H., Colombo, M.G., Cumming, D.J. et al. Small Bus Econ (2018) 50: 239. https://doi.org/10.1007/s11187-016-9826-6
Berggrun, L., Lizarzaburu, E., & Cardona, E. (2016). Idiosyncratic volatility and stock returns: Evidence from the MILA. Research in International Business and Finance, 37, 422-434.
Burneo, K., & Lizarzaburu, E. (2017). Finanzas para economías emergentes (pp. 432). Lima: Pearson Educación del Perú.
Burneo, K., & Lizarzaburu, E. R. (2016). Gobierno Corporativo en Mercados Emergentes: Impacto en la Bolsa de Valores de Lima-BVL. Globalización, Competitividad y Gobernabilidad de Georgetown/Universia, 10(3).
Burneo, K., & Lizarzaburu, E. (2016). In López, Erick (Ed.), Topics in finance (pp. 296). Lima: Pearson.
Cachanosky, N., & Salter, A. W. (2017). The view from Vienna: An analysis of the renewed interest in the Mises-Hayek theory of the business cycle. The Review of Austrian Economics, 30(2), 169-192.
Chen S., Wang C. & Ou, S. (2017). The Key Success Factors of Developing Intelligent Logistics Within Pharmaceutical Industry in Fujian Free Trade Area. Paper presented in the 2017 International Conference on Green Informatics (ICGI), Fuzhou.
Chaturvedi, U., Sharma, M., Dangayach, G. S. & Sarkar, P. (2017). Evolution and adoption of sustainable practices in the pharmaceutical industry: An overview with an Indian perspective. Journal of Cleaner Production, 168(1), 1358-1369.
Edmister, R. O. (1972). An empirical test of financial ratio analysis for small business failure prediction. Journal of Financial and Quantitative analysis, 7(2), 1477-1493.
FARFAN, K. B., BARRIGA, G., LIZARZABURU, E. R., & NORIEGA, L. E. (2017). Financial Ratio Method Peruvian Listed Companies. Revista ESPACIOS, 38(38).
Florian Castro, R. O. (2017). Relación entre promoción farmaceútica y prescripción de medicamentos en Perú. Universidad San Ignacio de Loyola, Perú.
Gul, F. A., & Tsui, J. S. L. (1997). A test of the free cash flow and debt monitoring hypotheses:: Evidence from audit pricing. Journal of Accounting and Economics, 24(2), 219-237.
Jensen, M. C. (1986). Agency costs of free cash flow, corporate finance, and takeovers. The American economic review, 76(2), 323-329.
Kesič, D. & Bertoncelj, A. (2008). Importance of marketing management in the world pharmaceutical industry. Market-Tržište, 20(1), 79-93.
Lizarzaburu, E. R. (2014). Análisis del Modelo Z de Altman en el mercado peruano. Universidad & Empresa, 16(26), 141-158.
Majumder, M. T. H., & Rahman, M. M. (2011). Financial analysis of selected pharmaceutical companies in Bangladesh. European Journal of Business and Management, 3(2).
Papageorgiou, L. G., Rotstein, G. E. & Shah, N. (2001) Strategic Supply Chain Optimization for the Pharmaceutical Industries. Industrial & Engineering Chemistry Research, 40(1), 275-286.
Phang Romero, C. (2002). Reforma del sector salud y la política farmacéutica en Perú. Cuadernos de Saúde Pública, 18(4), 1121-1138.
Retuerto Moreno, K. H. (2017). Análisis de la implementación de la atención farmacéutica en farmacias y boticas en el Perú. Tesis de pregrado, Universidad Interamericana para el Desarrollo, Perú.
Richardson, S. (2006). Over-investment of free cash flow. Review of accounting studies, 11(2-3), 159-189.
Sheela, S. C., & Karthikeyan, K. (2012). Financial performance of pharmaceutical industry in India using dupont analysis. European Journal of Business and Management, 4(14), 84-91.
Vashi, N. A. & Latkowski, J. A. (2012). The ethics of the medical-pharmaceutical relationship. Clinics in Dermatology, 30(2), 188-191.
Vo, X. V. (2018). Leverage and Corporate Investment–Evidence from Vietnam. Finance Research Letters.
Wei, K. J., & Zhang, Y. (2008). Ownership structure, cash flow, and capital investment: Evidence from East Asian economies before the financial crisis. Journal of Corporate Finance, 14(2), 118-132.
Wurgler, J. (2000). Financial markets and the allocation of capital. Journal of financial economics, 58(1-2), 187-214.
Yeoh PL., Calantone R. (2015) Success Factors in Global Product Innovation: An Illustration from the Pharmaceutical Industry. In: Sirgy M., Bahn K., Erem T. (eds) Proceedings of the 1993 World Marketing Congress. Developments in Marketing Science: Proceedings of the Academy of Marketing Science. Springer, Cham
Zurita, S., Castillo, A. & Niño J. (2018). Inflation, tax integration and company valuation: The Latin American case. Journal of Business Research, 2018, ISSN 0148-2963
Miguel Alegre Rubina y Celeste Gaspar Fernández from Universidad Esan, participates in the case.
1. PhD, professor in Esan University – Universidad Esan, Perú. Email: elizarzaburub@gmail.com
2. Profesor in Esan University – Universidad Esan, Perú
3. PhD, professor in Esan University – Universidad Esan, Perú.
4. PhD Luis Berggrun Universidad Icesi