![]() ISSN 0798 1015
ISSN 0798 1015

![]() ISSN 0798 1015
ISSN 0798 1015
Vol. 40 (Number 13) Year 2019. Page 7
PINKOVTSKAIA, Iuliia S. 1; ROJAS-BAHAMON, Magda J. 2 & ARBELÁEZ Campillo, Diego F. 3
Received: 25/09/2018 • Approved: 31/03/2019 • Published 22/04/2019
2. Methodology and design of production function SMEs
ABSTRACT: The purpose of the research is the evaluation of two-factor production functions that describe the dependence of the production volume of small and medium enterprises (SMEs) from the wage of employees and the fixed assets. The data for this research was obtained from the official statistical observation of activities of all SMEs in the 82 regions of Russia for 2015. The study allowed to determine the factors influencing turnover of small and medium enterprises. |
RESUMEN: El propósito de esta investigación es la evaluación de las funciones de producción de dos factores que describen la dependencia del volumen de producción de las pequeñas y medianas empresas (PYME) del salario de los empleados y los activos fijos. Los datos para esta investigación se obtuvieron de la observación estadística oficial de las actividades de todas las PYME en las 82 regiones de Rusia para 2015. El estudio permitió determinar los factores que influyen en la facturación de las pequeñas y medianas empresas. |

Numerous small and medium enterprises (SMEs) are operating in the Russian business sector. In 2015, their number exceeded 5.6 million, and 18 million employees worked for them. At the same time, small and medium enterprises have not yet been developed in Russia; their share is less than 20% of gross domestic product and employees’ number of all enterprises and organizations in Russia. For comparison, it can be noted that in the European Union countries, SMEs have a much larger share in the economy. They provide jobs for about 67% of the working population and produce 58% of gross domestic product (Development of Small and Medium Enterprises, 2015). In Germany these figures are 60% and 48% respectively (Sollner, 2014).
Solving management problems in the national economy requires an understanding of the factors that influence the volume of SMEs production. At the same time, experience shows that it is business sector that is the main driver of regional development, especially in underdeveloped areas, and business sector creates conditions for restructuring of the economy (Mosina, 2016; Safiullin et al., 2016; Chepurenko, 2017; Rakhmanova & Schneider, 2018; Acs et al., 2008; Baumol, 2004; Decker et al., 2014). Thereby, in Russia there is an urgent need for accelerated development of SMEs. Therefore, in recent years, one of the most important problems is to determine the growth reserves of such enterprises in each of the regions. The rationale for these reserves, as well as the resources required for the effective functioning of SMEs, can be based on mathematical models such as production functions.
The experience gained so far has shown the possibility of wide application of production functions in economic analysis and management. Production functions are economic and mathematical models of production processes and they quantify stable natural relationship between the factors describing the cost of capital and labor, and the indicator characterizing the production volume (Douglas, 1967; Kleiner, 1986; Bessonov & Tsukhlo, 2002). Production functions are the basis for modeling the activities of various economic complexes and systems, from separate enterprises and organizations to regions, sectors and the economy as a whole.
The most widespread at the present time are power production functions. Table 1 shows the analysis of the existing methods of evaluation of power production functions on the examples of Russian studies conducted in recent years.
Table 1
Characteristics of Russian studies
Authors |
Factor of capital |
Factor of labor |
Initial data |
Restrictions on the sum of indicators of the degrees |
Object of studying |
1 |
2 |
3 |
4 |
5 |
6 |
Nosov V. V., Aznabaeva A. M. (2016) |
fixed assets |
number of employees |
time series |
no |
BRICS countries |
Sokol A. G., Kutychkin A. V., Petrov A. A. (2017) |
investment in fixed capital |
labor costs |
time series |
yes |
one region- Yugra |
Nikonorov V. M. (2017) |
fixed assets |
number of employees |
time series |
no |
Russian trade sector |
Pshenichnikova S. N., Romanyuk I. D. (2017) |
gross capital accumulation |
number of employees |
time series |
no |
Russia |
Adamaliev K.R., Khalilov M.A. (2016) |
investment in fixed capital |
number of employees |
spatial data |
no |
Russian regions |
Sadovin N.S., Kokotkina T.N.(2017) |
fixed assets |
number of employees |
time series |
no |
Russian regions |
Afanasiev, A.A., Ponomareva O.S. (2014) |
fixed assets |
number of employees |
time series |
no |
Russia |
Antipov V.I. (2012) |
fixed assets |
number of employees |
time series |
yes |
Russia |
Gafarova E.A. (2013) |
fixed assets |
number of employees |
time series |
no |
one region- Bashkortostan |
Baranov S.V. (2014) |
fixed assets |
number of employees |
time series |
no |
Russian regions |
The data given in Table 1 shows that in most cases the economies of Russian regions (5 cases), Russia (3 cases), BRICS countries and trade enterprises located in Russia are the objects of the research. Fixed assets of enterprises and organizations in 7 works, flows of investments in fixed capital in 2 works, gross capital accumulation in 1 article were considered as factors describing capital. In absolute majority of the works (9) the number of employees occupied in the considered productions and only in one case – labor costs were used as labor factors. Initial data in 9 researches represented time series while only in one work spatial data in one year were used. In the works listed in Table 1 in 8 cases no restrictions on the sum of degree in equation were imposed. That is, evaluated the production functions, in which increasing, constant and decreasing returns to scale were allowed.
Scientist`s studies from different countries based on production functions using the data of SMEs have also achieved some progress. In most cases, the factors that determine the volume of production are fixed assets (the cost of all machines, equipment and buildings) and labor costs. Different indicators are discussed in scientific research. Thus, V. Bohórquez and J. Esteves (2008), S. Husain and M. S. Islam (2016) used the number of permanent employees to describe the labor costs. A. Sage and W. Rouse (2011) considered such indicator as total number of the man-hours within a year. In most works observations are based on time series. So, T. Khatun and S. Afroze (2016) show the impact of employees’ number and fixed capital on real GDP in Asian countries such as Bangladesh, India, China, Malaysia and Thailand, based on the use of time series data for 1990-2014. S. Batool and S. Zulfiqar (2013) present the analysis of interrelation of the same indicators on the production volume of small and medium enterprises in Pakistan. It should be noted that studies on the assessment of production functions describing the activity of SMEs in Russia haven't yet gained essential development. At the same time, in the pilot work of I. Pinkovetskaia (2014) method of developing production functions on the data of totalities small and medium enterprises, located in the regions was considered.
Small and medium enterprises located in each of Russia’s regions were considered as a research object. The current law (On the development of small and medium enterprises in the Russian Federation, 2017) has established the main criterion for classifying enterprises as small and medium ones, it is the number of employees engaged in SMEs. The number of employees for microenterprises should not exceed 15 people, for small businesses (without microenterprises) this figure ranges from 16 to 100 people, and for medium enterprises - from 101 to 250 people.
Taking into account the approach accepted in Russian statistics, the volume small and medium enterprises production can be characterized by the total turnover which consists of the cost of goods of their own production and proceeds from the sale of the purchased goods. As the object of the study were considered all SMEs that are located in each Russian region.
In the production functions describing the activity sectors, regions and national economies the initial data is expressed often in monetary form (Modeling of economic processes, 2005). When determining the number of factors of production functions were taken into account the proposal of A. Granberg (Granberg, 1988). He wrote about the feasibility use small number of factors, that is convenient for calculation and interpretation of results. The analysis showed that the greatest impact on the volume of production SMEs have such factors as fixed assets and wages of employees.
The number of employees directly occupied in production processes does not always coincide with the actual labor costs, as often employees are not busy all day (working week). It leads to erroneous indicators in the evaluation of labor factors. Taking this to account, we used as factor of production function such complex indicator as wage. It is more accurately compared with the number of employees, describes the features of labor costs in a specific region (price level, employment and other socioeconomic aspects). In addition, the use of employees' wages as a factor ensures identical dimension of all indicators of production functions. The identical dimension of all indicators of the production function, as shown in the article (Felipe and McCombie, 2012), provides high quality of the relevant models.
The use of empirical data for ten and more years (time series) is complicated by the need to take into account inflation processes. Using time series bases on the assumption that operating conditions of the considered research object for the considered interval of time will be identical or, at least, undergo few changes. This assumption in practice rarely fulfilled. Time series are often limited in length, and dynamics change of indicators experiences especially essential fluctuations because of crisis phenomena in the economy. That is why, in our study used spatial data, which characterize the considered indicators for all SMEs located in each of the regions of Russia in 2015. This approach is due to the following. Criteria for SMEs in recent years repeatedly changed. The current criteria are using from 2008. Because the accounting of SMEs is held once a year simulation using time-series are possible only for 8 years (2008 to 2015). Accordingly, the number of observations is eight, which is less than the minimum allowable value, which is in compliance with sentence (Khodasevich, 2017) would have to be two-factor function at least 16. Therefore, the evaluation functions are constructed according to provisional data, is inappropriate. As an example, spatial data it is possible to bring the paper (Charoenrat and Harvie, 2013).
Therefore, purpose of our research is evaluation of two-factor production functions that describe the dependence of SMEs production volume from fixed assets and employee wages in each of Russian regions.
Our research included the following steps: Collection and procession of initial statistical data. Formation of information arrays based on the data characterizing the sets of SMEs, located in each region. Linearization of the data obtained at the first stage, which characterize independent factors and resulting variables for SMEs. Development of production functions using the method of least squares. Assessment of functions quality. Verification of the developed functions for the presence of autocorrelation, heteroscedasticity and multicollinearity. Consideration of the theoretical and practical results following the analysis of the developed production functions.
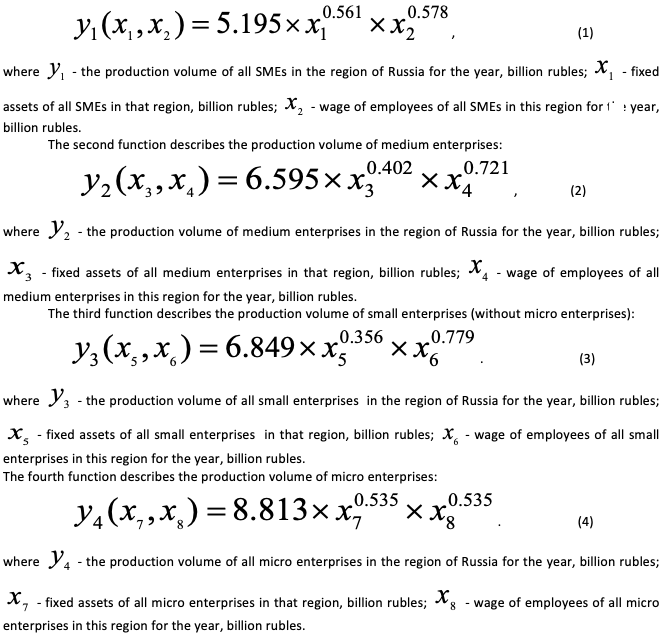
In the course of our research four production functions reflecting dependence of SMEs turnover on fixed capital and employees’ wages in all regions of Russia have been developed. The functions constructed by the authors have the specification similar to the well-known Cobb-Douglas functions. The parameters of production functions were determined using the regression analysis methodology (Pindyck and Rubinfeld, 2013). The first function describes the activity of all SMEs located in each region. Three other functions correspond to three SMEs groups that were formed according to the above-mentioned size categories: medium enterprises, small enterprises (except microenterprises) and microenterprises.
The study used data of the official statistical observation of activities in all Russian SMEs in 2015 (Federal service of state statistics, 2017). This observation is conducted every five years and gives more accurate information than the annual sample surveys of SMEs. The study is based on information of 82 regions of Russia. During the development of production functions we used methods of linearization and ordinary least squares.
The estimation of production functions that reflect the dependence of the production volume of SMEs on the value of fixed assets and wages of employees in the Russian regions is presented. Stated below are the formulas and tables developed by the author.
The first function describes the production volume of all SMEs located in each of the regions:
The quality assessment of the obtained functions was performed using coefficients of correlation and determination, the Fisher-Snedecor test and the Student’s t-test.
The logical analysis of production functions showed that they adequately describe the patterns of activity of the respective sets of small and medium enterprises in the regions throughout the range of values of the factors.
Table 2 presents the estimated values of statistics for testing the quality of all the four production functions provided in the paper.
Table 2
Values of the calculated statistics of functions
Quality assessment |
Calculated values of the functions |
|||
(1) |
(2) |
(3) |
(4) |
|
Coefficient of determination |
0.952 |
0.915 |
0.952 |
0.961 |
Coefficient of correlation |
0.976 |
0.956 |
0.976 |
0.980 |
Calculated value of the Fisher-Snedecor test |
758.443 |
401.803 |
737.317 |
948.787 |
Calculated value of the Student’s t-test on |
9.388 |
13.774 |
12.924 |
13.958 |
Calculated value of the Student’s t-test for the first factor |
5.326 |
4.307 |
3.368 |
5.540 |
Calculated value of the Student’s t-test for the second factor |
5.979 |
7.716 |
8.178 |
5.690 |
Source: Authors
A comparison of calculated values listed in Table 2, with the values of tests presented in the literature, show that the production functions (1)-(4) are of high quality. The correlation coefficients are close to one. The closer the coefficient of determination is to unity, the closer to a functional dependence between production volume and the factors. According to Draper and Smith (1998) the functions are successful when the coefficients of determination are more than 0.8. In our case they are higher than 0.915. The difference between the unit and the coefficient of determination describes the proportion of dispersion that is due to the influence of other factors, which are not included in the functions. That is, it can be concluded that the functions (1)-(4) explain more than 91% of variation in the dependent variables. Accordingly, the other factors (which not considered here) account for no more than 9%. The calculated values of all statistics are much higher than table value of the Fisher-Snedecor test that is 3.98 at the significance level equal to 0.05. All the calculated values of the Student’s t-test are more than the table value, which at the significance level of 0.05 is 1.99. Therefore, functions (1)-(4) are of high quality.
The verification of functions (1)-(4) using Darbin-Watson test showed that there is no autocorrelation, and Breusch-Pagan test showed the absence of heteroscedasticity. There is no multicollinearity that is there is no dependence between the factors, which is confirmed by the VIF test. In the process of initial data approximation using the method of least squares, the residues showing deviations of calculated values from the initial data have been received. Verification of distribution of these remainders for each of the four production functions was conducted on the basis of assessment of histograms graphs, normal distribution functions and tests of normality. Graphs of histograms of residues showed that all of them lumpy in the middle with thin, symmetrical tails. Residues concentrated about zero, because normal distribution functions have mean values near to zero. Tests of Shapiro-Vilk, Pearson and Kolmogorov-Smirnov showed the normality of the distribution of residuals. In general, it can be concluded that the developed functions fully satisfy the econometric requirements and therefore can be used for the interpretation of the studied phenomena.
The developed production functions (1) - (4) prove the influence of the considered factors on the turnover of enterprises relating to the entrepreneurial sector of Russian regions’ economy. Values of degrees for both factors in functions are positive, therefore, it can be stated that the stimulation of small and medium enterprises can be provided with increase in wage costs and growth of fixed assets. Production functions for all considered factor values do not reach their maximum. This is confirmed by the fact that the values of the maximum return on both factors for all functions are positive on the considered ranges of the factors values change. Therefore, it can be concluded that the economy of Russian regions has not reached saturation with products of small and medium enterprises, and they have significant reserves for further development. That is, in all regions there are opportunities to increase the number of SMEs and the number of employees in them.
The sum of the degree values in the coefficients of all production functions (1)-(4) is more than 1, which indicates an increasing return to scale. A similar trend was observed in Asian countries (Khatun and Afroze, 2016). With the increase of both factors (fixed capital investment and employees’ wages), production growth is faster than the factors growth. For example, with the growth of both factors in function (1) by 10% production increases by 11.39%. The accelerated increase in production volumes with the growth of factors is of economic and social importance. For a rapid increase in SMEs production in Russian regions, it is advisable to provide the simultaneous growth of these both factors. It will increase the returns to scale. It should be noted that for the regions with an excess of the working population (on the example of the republics of North Caucasus), the main direction of business development is connected with increase in employment and creation of family business. In regions where there are not enough potential employees (Siberia and the Far East), the main direction of increasing SMEs production is associated with an increase in investment in fixed assets. Cross derivatives of the production functions for each of the two factors are positive for all values of the range of changing factors, therefore the increase in one factor improves conditions for using the other factor. Thus, the growth of employees’ wages increases the return on investment in fixed assets. Conversely, increased investment in fixed capital increases the wages level. The second derivatives of all isoquants are positive. The level of bulge decreases with the growth production volume of SMEs, which indicates an increase in the elasticity of substitutive factors: with the growth of production in entrepreneurial structures, the possibility of replacing one factor with another increases. The factor of employees’ wages in production functions (1)-(3) affects turnover to a greater extent than the factor of fixed assets. In function (4) both factors influence similar.
The use of production functions is possible when solving such a vital problem as ranking the regions based on the efficiency of using resources such as fixed assets and SMEs employees’ wages. At the same time, comparative analysis of the actual turnover of all SMEs in the region and the value of turnover in the same region predicted on the basis of the production function can be used. In our opinion, the relatively great positive meaning of this value (that is, the excess of the actual turnover over the estimated one) indicates good business climate in the region. Accordingly, a large negative meaning of this value allows concluding that there are problems with the business climate in the relevant region.
The scientific importance of this study can be focused on the following aspects:
- Methodical aspects of evaluation of production functions are considered. The problems arising from the use of number of employees engaged in production processes as a labor factor, as well as data generated in the form of temporary series are analyzed. The advantages of choosing employees’ wages and spatial data for one year as a factor in assessing production functions are shown;
- 4 two-factor production functions similar to Cobb-Douglas functions are developed during the research. These functions describe dependence of SMEs turnover on the considered factors for all regional SMEs in general, and for medium enterprises, small enterprises and microenterprises in particular. With the use of a number of tests, high quality of all developed production functions and their good approximation of the initial data are confirmed;
- production functions prove that there are significant reserves for further development of business sector of the economy, namely, in all Russian regions, the saturation with SMEs goods and services has not been achieved. Increase in one of the factors of production function improves conditions of using the other factor. The factor of employees’ wages in all production functions affects the turnover to a greater extent than the factor of investment in fixed assets. An increasing return to scale of small and medium enterprises is observed;
- using production functions, regions of Russia with a high and low level of efficiency in the use of available resources (business climate) are identified.
The practical significance of the research can be realized in the activities of government bodies, in business sector of the national economy, as well as in educational activities.
The new knowledge can be used in scientific research, in educational process while solving problems of small and medium enterprises.
The proposed methodological approach and tools for assessing production functions describing the activities of SMEs in the regions can be used in research on business problems, as well as in justification of the development programs of this sector of the economy at the federal and regional levels. The methodology and tools that were used in the research process can be applied to similar researches in countries with a significant amount of territorial (administrative) units.
The conducted research provides government, regional authorities and other administrative bodies with information on possible ways to increase the production of SMEs. The developed production functions are effective management tools that allow assessing the level of financial and labor resources of SMEs in Russia and particular regions. The results of the work can be used in the current activities of state, municipal and public organizations connected with regulation and support of small and medium enterprises.
The practical significance of the study is the possibility of using the results obtained to justify resources and monitor the business climate. The results of the study can be used by state and regional authorities to monitor the efficiency of fixed assets and labor resources. That is, they can be used to assess the efficiency level of each of the discussed factors and also the revealed imbalance in factors values for each region. The results of the study should ensure the implementation of the Federal Strategy for the Development of SMEs for the period till 2030 (Strategy of SMEs development, 2016).
Further research is connected with assessment of production functions of SMEs, which are specialized in various types of economic activity and located in municipalities of particular regions.
Acs Z., Desai S., Hessels J. 2008. Entrepreneurship, economic development and institutions. Small Business Economics, 31, 219-234.
Adamaliev K.R., Khalilov M.A. 2016. Models of production functions of the regions: calculation of parameters and characteristics, analysis of dependence of output on resources. Fundamental research, 4-2, 339-345.
Afanasiev A.A., Ponomareva O.S. 2014. Production function of national economy of Russia in 1990-2012. Economics and mathematical methods, 50(4), 21-33.
Antipov V.I. 2012. Production function of the Russian economy. Economics, Statistics and Informatics, 5, 101-104.
Baranov S.V. 2014. Economic models of production functions: History and modernity. Economic Science, 10, 53-57.
Batool S., Zulfiqar S. 2013. Analyzing the Input Output Relationship of Small and Medium Enterprises in Pakistan: An Econometric Approach. International Journal of Business and Economic Development, 1(1), 66-73.
Baumol W.J. 2004. Entrepreneurial enterprises, large established firms and other components of the free-market growth machine. Small Business Economics, 23, 9-21.
Bessonov V.A., Tsukhlo, S.V. 2002. Problems of construction of production functions in the Russian Transitional economy. Analysis of dynamics of the Russian transitional economy. Institute of Economy of transition period, 5-89.
Bohórquez V., Esteves J. 2008. Analyzing SMEs size as a moderator of ERP impact in SMEs productivity. Communications of the IIMA, 8(3).
Charoenrat T., Harvie C. 2013. Technical Efficiency of Thai Manufacturing SMEs: A Stochastic Frontier Analysis. Australasian Accounting. Business and Finance Journal, 7(1), 97-122.
Chepurenko A.Y. 2017. Combining a universal concept with national characteristics: support of small and medium enterprises. Issues of state and municipal management, 1, 7-30.
Decker R., Haltiwanger J., Jarmin R., Miranda J. 2014. The Role of Entrepreneurship in US Job Creation and Economic Dynamism. Journal of Economic Perspectives, 28:3, 3-24.
Development of small and medium entrepreneurship. Foreign experience. 2015. SME Bank, Moscow, Russia.
Douglas P. 1967. Comments on the Cobb-Douglas Production Function. The Theory and Empirical Analysis of Production. Columbia University Press. 15-22. National Bureau of Economic Research. Accessed at: http://www.nber.org/chapters/c1474.
Draper N., Smith H. 1998. Applied regression analysis, John Wiley & Sons, New York, USA.
Federal service of state statistic. 2017. Small and medium entrepreneurship in Russia. Accessed at: http://www.gks.ru/wps/wcm/connect/rosstat_main/rosstat/ru/statistics/publications/catalog/doc_1139841601359.
Felipe J., McCombie J. 2012. Problems with Regional Production Functions and Estimates of Agglomeration Economies: A Caveat Emptor for Regional Scientists. Cambridge Centre for Economic and Public Policy. Working Paper no. 725.
Gafarova E.A. 2013. Modeling of regional development on the base of production functions. Naukovedenie, 3, 1-7.
Granberg A.G. 1988. Modeling of the socialist economy. Economics, Moscow, Russia.
Husain S., Islam M.S. 2016. A Test for the Cobb Douglas Production Function in Manufacturing Sector: The Case of Bangladesh. International Journal of Business and Economics Research, 5(5), 149-154.
Khatun T., Afroze S. 2016. Relationship between real GDP and Labour and Capital by applying the Cobb-Douglas production function: a comparative analysis among selected Asian Countries. Journal of Business Studies, XXXVII, 1, 113-129.
Khodasevich G.B. 2017. Working with experimental data processing on computer. Part 2. Processing one-dimensional arrays. Accessed at: http://dvo.sut.ru/libr/opds/i130hod2/index.htm.
Kleiner G.B. 1986. Production functions: Theory, methods, application. Finance and statistic, Moscow, Russia.
Modeling of economic processes. 2005, ed. by M.V. Gracheva, L.N. Fadeeva, Yu.N. Cheremnykh, YUNITI-DANA, Moscow.
Mosina E.A. 2016. Regional small business: the necessary conditions and prospects for development. Social policy and sociology, 15:1(114), 17-23.
Nikonorov V.M. 2017. Refined evaluation of the production function of retail trade of the Russian Federation. Society: politics, economics, law, 9, 32-36.
Nosov V.V., Aznabaev A.M. 2016. Production function in modeling GDP of the BRICS. New University. Series: Economics and law, 10(68), 20-24.
On the development of small and medium enterprises in the Russian Federation: Federal law of 24.07.2007 № 209-FZ. Accessed at: http://www.consultant.ru/document/cons_doc_LAW_52144/.
Pindyck R., Rubinfeld D. 2013. Microeconomics. Pearson, New York, USA.
Pinkovetskaia I. 2014. Some results of modeling volumes of production of entrepreneurial structures. ETAP: economic theory, analysis, practice, 2, 107-126.
Pshenichnikova S.N., Romanyuk I.D. 2017. Analysis of production of Cobb-Douglas production function for the economy of Russia and some countries of Central and Eastern Europe. Proceedings of Southwest state university. Series: Economics. Sociology. Management, 7:3(24), 148-166.
Rakhmanova M.S., Schneider V.V. 2018. Modern status of small enterprise development prospects and problems in Russia. Amazonia Investiga, 7(14), 61-72.
Sadovin N.S. Kokotkina T.N. 2017. Economic analysis of statistical estimates of parameters of multiplicative production functions modeling the gross regional product. Actual problems of economy of modern Russia, 4, 46-50.
Safiullin R.G., Grishina T.P., Malikova E.R. 2016. Territorial dynamics of competitiveness of small entrepreneurship in Russia, Successes of modern natural science, 11-2, 390-395.
Sage A.P., Rouse W.B. 2011. Economic systems analysis and assessment cost, value, and competition in information and knowledge intensive systems, organizations, and enterprises, John Wiley & Sons, New York, USA.
Sokol A.G., Kutychkin A.V., Petrov A.A. 2017. On the use of production functions to simulate the functioning of regional economy. Bulletin of the South Ural state University. Series: computer technology, control, electronics, 17:4, 85-97.
Sollner R. 2014. The economic importance of small and medium-sized enterprises in Germany. Wirtschaft und Statistik, January, 40-51.
Strategy of SMEs development in the Russian Federation for the period up to 2030: the order of the government of 2.06.2016 No. 1083-R. Accessed at: http://www.consultant.ru/document/cons_doc_LAW_199462/f3fa9da4fab9fba49fc9e0d938761ccffdd288bd/.
1. PhD, Associate Professor, Department of Economic Analysis and State Management, (Ulyanovsk State University, Ulyanovsk, Russia). pinkovetskaia@gmail.com
2. PhD, Educación, (Docente Institución Educativa Jorge Eliécer Gaitán, Colombia). mjulissa@gmail.com
3. MSc. Educación, Esp. Revisoría Fiscal. (Editor Revista Amazonia Investiga ISSN 2322-6307) dfaca@hotmail.com