![]() ISSN 0798 1015
ISSN 0798 1015

![]() ISSN 0798 1015
ISSN 0798 1015
Vol. 40 (Number 13) Year 2019. Page 9
SHAIDULLINA, Rimma M. 1 & IKHSANOVA, Faniya A. 2
Received: 19/10/2018 • Approved: 30/03/2019 • Published 22/04/2019
ABSTRACT: The purpose of the article is to demonstrate the possibility of mathematical methods application for solving various problems arising in the implementation of the consumer choice of a tourist product. Using principal component analysis for solving consumer choice problem promotes development of economic science and its practical application. In this article the classification of countries as tourism objects is demonstrated; the conditions influencing the consumer choice are analyzed; the potential market of tourist product consumers is identified. |
RESUMEN: O objetivo do artigo é demonstrar a possibilidade de aplicação de métodos matemáticos para resolver vários problemas decorrentes da implementação da escolha do consumidor de um produto turístico.A utilização da análise de componentes principais para resolver problemas de escolha do consumidor promove o desenvolvimento da ciência econômica e sua aplicação prática. Neste artigo, a classificação dos países como objetos de turismo é demonstrada; as condições que influenciam a escolha do consumidor são analisadas; o mercado potencial de consumidores de produtos turísticos é identificado. |

At the present time there is increasing interest in studying of consumer behavior of economic subjects considering implementation of consumer choice in conditions of limited resources (income, time, etc.). Application of mathematical tools allows you to explain the behavior of the consumer by a mathematical language; to obtain, analyze and meaningfully describe data, and effectively applying them in practice by companies engaged in tourism business.
It should be noted that in modern life tourism is becoming one of the popular types of consumer product (Frolova et al, 2017). The population of different countries travels more and more often. According to statistics, the number of international tourist trips annually grows by 4%. In the ranking of world export products tourism is already the third largest; there are some countries where the share of the tourism contribution to GDP is about 10%. Tourism has a powerful multiplicative effect. The growth of the tourist flow provides an income increase in 53 economy sectors, creating tourist products .
Due to diversity and variety of problems arising during selection of a tourist product, the consumer has to make this choice by trial and error method, irrationally using the limited resources (money income) in conditions of shortage of time (vacation time). Consequently, effective use of information resources and mathematical modeling for consumer optimal solution is needed.
Most economic models are based on the assumption of perfect rationality of individuals, i.e. "all economic entities realize their goals and are able to choose the best solutions to achieve this goals instantly, accurately and with minimal cost" (Kuzminov et al, 2006). In economic theory this principle was introduced by A. Smith through his idea of the "Homo economicus", as a person who maximizes his own profit. "Economic egoism" is considered as a criterion for the rationality of economic activity. Modern economic science has modified this principle: a rational individual maximizes his own profit, which he can determine logically and calculate numerically in conditions of freedom of choice and absolute completeness of information (Furnham and Lewis, 1986). In the theory of consumer behavior, the idea of a rational consumer is based on the following postulates: the hierarchy of preferences, the quantitatively determined levels of relative utility and the lemma of marginal utility.
It should be noted that this axiom of economic theory is criticized by representatives of economic psychology, asserting that the principle of rationality does not correspond to real human behavior, both in the economic and consumer spheres. Psychologists argue that other criteria (hedonism, altruism, social values and norms, etc.) can also serve as criteria for rational economic behavior. In the theory of firm G. Simon also claims that in the process of searching a rational solution, especially in conditions of insufficient or limited information, the choice is made not in favor of maximizing benefits, but in favor of one of the satisfactory variants. The search satisfaction model has become widely used in theoretical and practical studies (Malakhov, 1990).
Nevertheless, we can speak about the truth of the assumption of profit maximizing behavior, because with its help it is possible to construct theoretical constructions that allow us to make relatively effective administrative decisions. And in this context, mathematical tools provide great opportunities. Modern economic theory increasingly relies on mathematical modeling of consumer behavior. Using mathematical language for solving a consumer search problem for an optimal choice of tourist product allows more clearly formulating and describing its behavior in conditions of a wide range of services offered by travel companies.
According to the UNWTO (United Nations World Tourism Organization) position, innovation activity in tourism sphere develops in three ways: 1) the introduction of innovations related to the development of the tourism business; 2) marketing innovations, attracting new customers; 3) modification of the consumer properties of the tourist product . In our opinion, in conditions of a wide choice of tourist products marketing innovations should be aimed at the wide application of complex analysis of the tourist market, the development of ways to systematize information that promote the adoption of optimal solutions for both tourist companies and tourist product consumers.
In our research, we demonstrate the possibility of mathematical methods application to solve various problems arising during realizing consumer choice of a tourist product.
In modern science, solving economic problems requires methods from different sections of mathematics: the basics of linear algebra, mathematical analysis, numerical methods, mathematical statistics, etc. In our study, we made an attempt to apply such mathematical tool as the principal components analysis. This is a novel approach to the problem of the consumer choice of a tourist product.
The basics of the principal component analysis were described in the Pearson’s works at the beginning of the XX century. This method is used to describe the research results presented in the form of arrays of numerical data. It is widely used in many fields: bioinformatics, geology (Mirzadjanzadeh and Stepanova, 1977; Ikhsanova et al, 2016), sociology, political science, econometrics, etc. (Ayvazyan et al, 1989), when researchers need to reduce the dimensionality of data losing the least amount of information.
The calculation of the principal components can be reduced to the calculation of singular decomposition of the data matrix or to the calculation of the eigenvectors and eigenvalues of the original data covariance matrix . Usually, some variables have a strong influence on the overall change in some structure, while others will have little effect and can be neglected when creating a model. The principal component analysis consider a smaller number of functions in comparison with the number of parameters that determine the object structure, but saves a lot of information about the structure. This allows deeper understanding of the essence of the structure.
By calculation of eigenvalues and eigenvectors of the correlation matrix (Mirzadjanzadeh and Stepanova, 1977), we obtained coefficients of the linear decomposition of the principal components that carry information about the aggregate change, the mutual duplication and complementarity of the variables.
Principal components define and rank the variables in groups by their contribution to the overall structure change. The contribution of each principal component is ranked by the variance. Linear combinations that define the principal components (factors) are displayed in decreasing order of eigenvalues.
In this research the following methods were used: theoretical (analysis of economic and sociological literature on the research topic); mathematical (principal component analysis), statistical methods of data processing. The study was conducted on the basis of data obtained from the following sites: www.momondo.ru; www.numbeo.ru; www.tonkosti.ru; www.booking.com; www.gks.ru, www.lenta.ru, www.kp.ru. Calculations were performed by means of Statistica and Microsoft Excel XLSTAT software.
Application of the principal component analysis will be considered on the example of a consumer choice of tourist product satisfying his specific preferences. The consumer solves the country choice problem as a place for vacation and tourism, considering special attributes, which will be considerably important for the tourist. So we selected 25 countries (objects of research), which will be differentiated by 9 parameters, using travel agencies websites (Table 1).
Table 1
Parameters characterizing the objects of research
Parameter |
Characteristic |
P1 |
Flight duration, min. |
P2 |
Air ticket price, rub. |
P3 |
Hotel cost, rub. |
P4 |
Meals cost in a local restaurant, rub. |
P5 |
Cost of one trip on local transport, rub |
P6 |
Cost of a tour in local museum, rub. |
P7 |
Cost of a city sightseeing tour, rub. |
P8 |
Cost of a sport activity, rub. |
P9 |
Availability of beach rest (points) |
Relevant data were collected from the following sites: www.momondo.ru; www.numbeo.ru; www.tonkosti.ru; www.booking.com. Basic parameters of analysis were the following: main tourist activity - excursions with elements of active and beach rest; host place - the capital or major tourist center of the investigated country (for example, Barcelona, Montreal, Sydney, Istanbul); the period of stay is from 02.07.2018 to 11.07.2018 (10 days); prices for air tickets – from Moscow, Russian Federation (there and back) for 2 adults, with no more than 1 transfer, ticket tariff is "optimal"; hotel (2 adults) with 3 stars without meals (hotel choice was made by median price); meals in inexpensive restaurant (for 2 people); transport - one-way ticket (local transport) for two persons; sport activity - fitness club card, third-monthly fee for 2 adults; museum tour price is the tour price in the most significant cultural center in the country (for example, the National Museum); sightseeing city tours - the ticket price for two adults. The parameter "Availability of beach rest" was determined by the location of the investigated place: complete absence of beach rest - 0 points; availability of beach rest only by a sea trip - 5 points; appropriate for beach rest sea coast - 10 points. Used dollar exchange rate was 60 rubles per 1 dollar. Collected data are presented in Table 2.
Table 2
The aggregate of investigated parameters for 25 countries
Country |
P1 |
P2 |
P3 |
P4 |
P5 |
P6 |
P7 |
P8 |
P9 |
Italy |
335 |
19505 |
58200 |
63523 |
2116 |
3399 |
4249 |
7517 |
5 |
Greece |
220 |
13679 |
49600 |
42349 |
1972 |
8498 |
5666 |
3376 |
10 |
France |
317 |
17265 |
90300 |
59266 |
2681 |
7224 |
4532 |
6782 |
5 |
Spain |
340 |
20059 |
88400 |
45523 |
3030 |
5099 |
3187 |
6301 |
10 |
Romania |
252 |
21116 |
23300 |
23194 |
469 |
1384 |
1133 |
4790 |
5 |
United Kingdom |
340 |
16016 |
89700 |
70268 |
3908 |
9323 |
4249 |
7294 |
0 |
Netherlands |
312 |
15367 |
91700 |
63523 |
3992 |
5312 |
4249 |
4176 |
0 |
Germany |
467 |
9688 |
56000 |
33872 |
3956 |
5099 |
2833 |
3579 |
0 |
Czech Republic |
165 |
13312 |
55500 |
21066 |
1299 |
3399 |
1841 |
4551 |
0 |
Sweden |
165 |
13976 |
69600 |
44044 |
5291 |
3399 |
1700 |
5878 |
0 |
Finland |
225 |
12589 |
55100 |
50825 |
4377 |
4249 |
2266 |
6394 |
0 |
Turkey |
190 |
17831 |
27900 |
20417 |
854 |
2546 |
5411 |
4345 |
10 |
United Arab Emirates |
305 |
38302 |
32300 |
29471 |
1635 |
392 |
2405 |
11780 |
10 |
Austria |
215 |
14437 |
49600 |
40740 |
1494 |
325 |
5440 |
1997 |
0 |
Japan |
587 |
35987 |
48300 |
32826 |
1972 |
2027 |
12024 |
10823 |
5 |
China |
470 |
39291 |
33200 |
16160 |
541 |
0 |
2405 |
5279 |
5 |
Indonesia |
812 |
39564 |
21200 |
10822 |
313 |
268 |
7936 |
4823 |
5 |
Thailand |
847 |
33188 |
21400 |
6493 |
1263 |
2164 |
6012 |
8559 |
10 |
India |
537 |
36177 |
19800 |
14140 |
469 |
1686 |
4810 |
3843 |
5 |
Australia |
1320 |
74015 |
55300 |
42601 |
3788 |
2110 |
10461 |
6949 |
10 |
USA |
777 |
36214 |
111400 |
64930 |
3307 |
1988 |
1202 |
8773 |
5 |
Canada |
760 |
62096 |
75900 |
42637 |
3078 |
6518 |
7936 |
3744 |
0 |
Mexico |
990 |
94158 |
26400 |
16124 |
878 |
1315 |
2886 |
3172 |
10 |
Cuba |
720 |
60920 |
69500 |
18036 |
481 |
0 |
2886 |
901 |
10 |
Brazil |
1007 |
100116 |
34200 |
31130 |
1455 |
919 |
2405 |
4903 |
10 |
Table 2 data was processed in the Statistica and Excel XLSAT software. This software allowed to compress this data array, to reveal parameters most influencing specific Fj factor, and also to determine maximum, minimum and average values of P1-P9 parameters. Eventually, the objects of the research were grouped into relatively homogeneous classes.
As a result of the calculations, a correlation matrix, showing influence of the parameters on each other, was obtained. The influence between parameters is determined by the following criterion: the closer the number module to 1, the stronger the relationship between variables (Table 3).
Table 3
Correlation matrix
Variable |
P1 |
P2 |
P3 |
P4 |
P5 |
P6 |
P7 |
P8 |
P9 |
P1 |
1 |
0,848 |
-0,148 |
-0,255 |
-0,135 |
-0,340 |
0,388 |
0,030 |
0,436 |
P2 |
0,848 |
1 |
-0,256 |
-0,328 |
-0,293 |
-0,424 |
0,163 |
-0,096 |
0,505 |
P3 |
-0,148 |
-0,256 |
1 |
0,823 |
0,684 |
0,563 |
-0,124 |
0,091 |
-0,363 |
P4 |
-0,255 |
-0,328 |
0,823 |
1 |
0,748 |
0,633 |
-0,059 |
0,245 |
-0,400 |
P5 |
-0,135 |
-0,293 |
0,684 |
0,748 |
1 |
0,583 |
-0,026 |
0,232 |
-0,483 |
P6 |
-0,340 |
-0,424 |
0,563 |
0,633 |
0,583 |
1 |
0,063 |
0,004 |
-0,329 |
P7 |
0,388 |
0,163 |
-0,124 |
-0,059 |
-0,026 |
0,063 |
1 |
0,176 |
0,113 |
P8 |
0,030 |
-0,096 |
0,091 |
0,245 |
0,232 |
0,004 |
0,176 |
1 |
0,136 |
P9 |
0,436 |
0,505 |
-0,363 |
-0,400 |
-0,483 |
-0,329 |
0,113 |
0,136 |
1 |
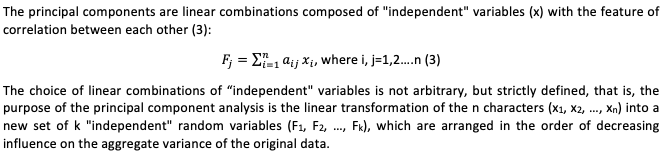
Further, relying on eigenvalues (Table 4) the eigenvectors and principal components were calculated. Table 4 shows that the first three components F1, F2, F3 have λ>1 and give 73.9016% of the total parameters variability. Each principal component contains certain information that reflects certain properties of the tourist route.
Table 4
Determination of eigenvalues and variance of factors
F1 |
F2 |
F3 |
F4 |
F5 |
F6 |
F7 |
F8 |
F9 |
|
Eigenvalue |
3,81 |
1,76 |
1,07 |
0,90 |
0,63 |
0,33 |
0,21 |
0,16 |
0,09 |
Variability (%) |
42,41 |
19,56 |
11,92 |
10,07 |
7,09 |
3,74 |
2,40 |
1,83 |
0,95 |
Cumulative % |
42,41 |
61,98 |
73,90 |
83,97 |
91,06 |
94,81 |
97,21 |
99,04 |
100 |
Variability of the first principle component is determined by vacation conditions, such as cost of the hotel, meals, trips to local museums, availability of beach rest, with an information load of 42.4146%. The second principal component is influenced by factors such as the flight duration, air tickets price, cost of a city sightseeing tour and contributes to 19.5675% of the total information load. The third principal component is characterized by the cost of a fitness subscription, city sightseeing tour and air tickets price and contributes to 11.9195% of the total information load. So, information loads of all these principal components are, respectively, 42.4146%, 19.5675, 11.9195%.
The P4 parameter (meals cost in a local restaurant) with value 0.8508 loads the principal component F1 more than other parameters, the P1 parameter (flight duration) with value 0.7241 mainly loads the principle component F2, the P8 parameter (the cost of fitness subscription) with value 0.7835 mainly loads the principal component F3 (Fig. 1). This means that these parameters have the most significant influence on the distribution of investigated subjects in the relevant principle components.
Figure 1
Influence of parameters on the principle components
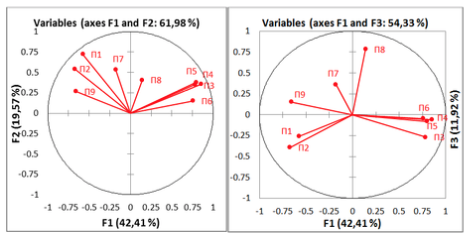
Based on the correlation between the principle components F1, F2 and the influence of parameters on their variability, the following graphic distribution of investigated objects was obtained (Fig. 2).
Figure 2
Graphical distribution of investigated objects on principal components F1, F2
According to our research position, five main groups of the researching objects were distinguished on the basis of their graphical representation on the principle components axes (hence, the groups selection is relatively subjective, which is, basically, not denied in the theory of consumer behavior). The countries in the first group were united according to the following criteria: high levels of such parameters as P1 (flight duration), P2 (air ticket price), P7 (cost of city sightseeing tours), P8 (cost of fitness subscription), i.e. this group of countries is geographically distant from Russia, and, therefore, require expensive air tickets. These are countries such as Australia, Japan, Canada, United States. Second group include Great Britain, France, Spain, Italy, the Netherlands.
This group is characterized by a fairly high cost of hotel accommodation (P3), meals in a restaurant (P4), local transport services (P5), as well as the high cost of museums excursions (P6). Third group countries (Germany, Finland, Sweden, Austria, Czech Republic, Greece) are opposite to the countries of the first group, therefore parameters P1, P2, P7, P8 are minimal, so the leading role in the selection of these countries as a tourism object plays territorial proximity and, consequently, cheap flight price, and relatively cheap hotel price (P3). The countries of the fourth group (India, China, Turkey, Romania) are united by such criteria as cheap hotels (P3), inexpensive meals in local restaurants (P4), cheap local transport (P5) and museum tickets (P6).
Finally, the fifth group of countries (Brazil, Mexico, Thailand, Indonesia, Cuba, the United Arab Emirates) are characterized by very high values of the parameters P1, P2, P7, P8, which brings them closer to the first group. But, at the same time, these countries are different from 1st group because of high value of P9 parameter (availability of beach rest) and cheap hotels (P3). The only exception is Cuba due to high P3 parameter (high hotel cost), obviously because of the underdevelopment of the hotel business in the country.
Thus, using principle components analysis, from initial data, containing 25 research objects characterized by 9 parameters, we have distinguished 5 relatively homogeneous groups employing three factors (principle components), i.e. the dimension of data array was reduced. Selected groups are represented in Fig. 3.
Figure 3
Classification of countries into groups
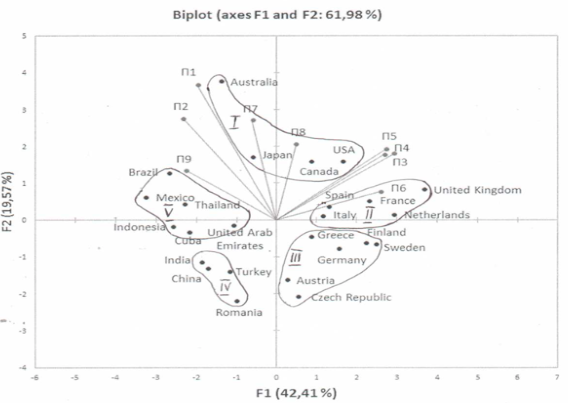
Similar analysis can be done for other principal components combination: F1, F3; F2, F3.
It should be noted that combination of countries into relatively homogeneous groups has some elements of researcher subjectivity. Despite the principle components analysis allows us to show the effect of the most significant parameter on the investigated objects. This means that when choosing a country as tourism object, a consumer can focus on one or another preferences: his income, cost of hotels, flight distance, knowledge of history and culture of the country, exploration of new countries, cheap cultural recreation, availability of beach recreation, etc. On the other hand, the application of this tourist market research method will allow travel companies to influence the consumer choice, offering countries as a tourist object with different criteria.
Thus, using the principal component analysis, we can clearly identify consumer preferences. However, the consumer choice depends not only on his preferences, but also on financial possibilities. As stated above, consumer choice is a choice that maximizes the usefulness function of a rational consumer in conditions of limited resources (money income). The consumer choice is influenced by two important factors: price of a tourist product, i.e. the total cost of a tourist tour, and the consumer income. The data shown in Tab. 2 allow to calculate the full cost of the tourist tour in different countries according to the following principle: the total cost of the tour consists of the air tickets price (P2), the cost of the hotel (P3), the cost of three meals a day, taking into account a 10-day stay in the country (P4); the cost of 10 trips by local transport (P5), the cost of 3 excursions to national museums (P6), the cost of one city tour (P7), the cost of fitness subscription (P8). So total tour cost (TC) equals:
TC=P2+P3+30P×4+10×P5+3×P6+P7+P8 (4)
The results of the calculations are presented in Table 8. It also includes Rosstat data of the number of Russian tourists who have visited these countries in 2016 . However, one should take into account that not only working adults can be tourists, but also their dependents (such as children). In our model we suppose that two tourists, belonging to the employed part of the population, have one dependent. Since our study was based on calculations for two adults, therefore, we will reduce the number of tourists by one third (the fifth column of Table 5).
Table 5
Comparison of the tourist tour price with the actual tourist flow from Russia in 2016
Country |
Total tourist tour price for 2 adults |
Total tourist tour price for 1 person |
Number of Russian tourists in 2016, thousand people. |
Corrected number of Russian tourists in 2016, thousand people |
Romania |
75386 |
37693 |
30 |
20 |
Thailand |
79078 |
39539 |
867 |
578 |
Turkey |
79304 |
39652 |
797 |
531 |
India |
80926 |
40463 |
169 |
113 |
Indonesia |
84926 |
42463 |
75 |
50 |
China |
96876 |
48438 |
1676 |
1117 |
Czech Republic |
100968 |
50484 |
367 |
245 |
Austria |
114032 |
57016 |
183 |
122 |
Germany |
115026 |
57513 |
1057 |
705 |
United Arab Emirates |
116286 |
58143 |
499 |
333 |
Greece |
125140 |
62570 |
782 |
521 |
Finland |
135802 |
67901 |
2894 |
1929 |
Sweden |
143888 |
71944 |
41 |
27 |
Japan |
143958 |
71979 |
47 |
31 |
Mexico |
144934 |
72467 |
72 |
48 |
Cuba |
152724 |
76362 |
45 |
30 |
Italy |
158510 |
79255 |
710 |
473 |
Spain |
171598 |
85799 |
790 |
527 |
Brazil |
175128 |
87564 |
37 |
25 |
France |
188052 |
94026 |
393 |
262 |
Netherlands |
188318 |
94159 |
177 |
118 |
Australia |
195224 |
97612 |
- |
- |
United Kingdom |
200758 |
100379 |
215 |
143 |
Canada |
201910 |
100955 |
- |
- |
USA |
227814 |
113907 |
225 |
150 |
In order to identify correlation between the tourist trip cost and the number of tourists, we will sum up the number of tourists visiting countries in certain price intervals. To make the calculations relevant, we will consider the following objective circumstances. Firstly, since the model is theoretical, we will not take into consideration inflationary processes. Secondly, we will exclude data on such neighboring countries as China and Finland, since most of trips to these countries are not just touristic excursions, but, most likely, business and shopping. Thirdly, it is necessary to take into account that in 2016, due to sanctions imposed on Turkey the number of Russian tourists was sharply reduced. Therefore, it is necessary to take as a basis not the actual number of tourist trips in 2016, but potential Russian tourist’s number; for example, using data for 2015, that is, 3460 thousand people (adjusted number of adults is 2306 thousand people). The following results were obtained (Fig. 4):
Figure 4
Dependence of the number of tourists on the travel tour cost
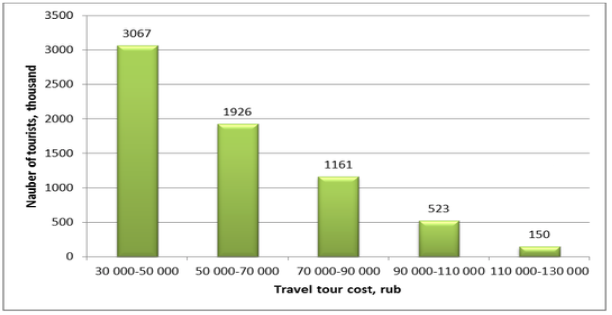
Thus, according to Fig. 5, one can see the inverse relationship between the tourist trip cost and the number of consumers of a tourist product. However, selecting smaller price intervals we can see that there is no more straight dependence. In our opinion, subjective factors start to play more important role in this case. Consumer of a tourist product in the same price range can neglect the economic criterion and focus on his consumer preferences, problems of visa’s application, etc; what corresponds to economic psychologist’s position.
The next limitation that is taken into account in the theory of consumer behavior is the consumer's money income. Average income per capita and the share of Russian population receiving corresponding revenues in 2016, according to Rosstat data , are presented in Table 6. Since the tourist trip payment is mainly made from their money savings, we have estimated available resources for the tourist tour purchase, provided that, according to Rosstat data, the share of people’s savings in 2016 was 11.2% of the total amount of money income. This gave us the opportunity to identify countries available for tourism, corresponding to certain income ranges of the country citizens (Table 6).
Table 6
Potential groups of countries available for tourism, corresponding
to certain ranges of average per capita incomes of Russians
Average income per capita, rub |
Population share, % |
Available resources for tourism (considering average savings as 11.2% of year income), rub. |
Potential groups of countries available for tourism |
|
month |
year |
|||
Less than 30000 |
360000 |
63,8 |
Less than 40320 |
- |
From 30000,1 to 35000,0 |
360000-420000 |
7,2 |
From 40320 to 47040 |
IV, V |
From 35000,1 to 40000,0 |
420000-480000 |
5,6 |
From 47040 to 53760 |
IV, V |
From 40000,1 to 50000,0 |
480000-600000 |
7,9 |
From 53760 to 67200 |
III, IV, V |
From 50000,1 to 60000,0 |
600000-720000 |
5,0 |
From 67200 to 80640 |
I, III, IV, V |
From 60000,1 to 70000,0 |
720000-840000 |
3,2 |
From 80640 to 94080 |
I, II, III, IV, V |
Over 70000 |
840000 |
7,3 |
Over 94080 |
I, II, III, IV, V |
Mathematical modelling in economy allows not only to estimate the current situation in certain markets, but also to make forecasts based on researchers’ objectives. Comparing the preferences of the tourist product consumer, resources which they potentially can use for this product purchase, as well as tourist product actual consumption, it is possible to identify the potential number of consumers that can be attracted by travel companies (Table 7). For this we simplified the model, taking as a basis for calculation not the total population of the country, but the average number of employed in Russia in 2016 (68.389 million people) , suggesting that the main consumers of the tourist product are working citizens. The share of the population receiving certain incomes (from Table 6) and the actual number of Russian tourists in 2016 (from Table 5) were accumulated in Table 7.
Table 7
Identification of potential consumers of tourism products
The income level of Russians, rub. per month |
Share of popu-lation,% |
The maximum number of potential tourists based on the average annual number of employees in Russia in 2016, thousand people. |
The actual number of Russian tourists in 2016, who visited the countries of the groups corresponding to their incomes, thousand people |
Potential tourists reserve, thousand people |
Below 35000 |
7,2 |
4924 |
1302 |
3622 |
35000- 50000 |
13,5 |
9233 |
7458 |
1775 |
50000- 70000,0 |
8,2 |
5608 |
2135 |
3473 |
Over 70000 |
7,3 |
4992 |
617 |
4375 |
Data from Table 7 demonstrate that in each group of Russians with the corresponding per capita income there is an additional tourism potential, demanding an increase in advertising activity effectiveness of travel companies.
Thus, determination of potential tourist product consumer groups serves as the basis for the increase of the marketing policy effectiveness of travel companies, wide advertising of new routes, recreation places and excursions, taking into account the consumer's preferences. Recently, medical tourism has also become a popular tourist product. Using the principal component analysis, it is possible to classify countries by such parameters as the cost of a clinic visit, the cost of medical tests and treatment, plus an extensive cultural program (sightseeing, visiting museums, performances, concerts, restaurants and shopping). New tourist flows can be attracted by gastronomic tourism, where it is also possible to identify parameters for analysis, for example, the cost of dishes degustation, lectures on proper nutrition, and the cost of a cultural and entertainment program. Tourist companies should widely advertise educational tourism, which have such parameters as the cost of foreign language course, the cost of living in a family house of local residents, meals, etc. On the other hand, the consumer himself, using offered research method, can independently select tour parameters, minimizing his expenses.t
Thus, as a result of this research, we can conclude that the active development of tourism market encourages the wide use of mathematics as a researching tool for consumer behavior forecast. Application of the principal component analysis in the theory of consumer behavior in the sphere of tourism makes it possible to determine the relationship between dependent variables (the cost of air tickets, hotels, the duration of the flight, the cost of excursions and sightseeing, etc.) to identify the most influential parameters and obtain a visual representation of the investigated objects distribution. In our example, five relatively homogeneous groups were distinguished using the principal component analysis from the original data array containing 25 research objects characterized by 9 parameters. Classification of countries, of course, is relatively subjective. Nevertheless, the principal component analysis allows us to demonstrate the effect of the most significant parameters on the distribution of the investigated objects. Depending on the task, you can change the objects of research or the necessary parameters. At the same time, the use of mathematical methods specifically in the field of tourism makes it possible to make a consumer choice, based on his financial capabilities, and to identify the potential market of tourist product consumers. Proposed method of the tourist market research can be extended by introducing new parameters influencing consumer choice and by the application of new mathematics and statistics tools in the theory of consumer behavior.
Ayvazyan, S.A., Buchstaber, V.M., Enyukov, I.S., Meshalkin, L.D. Applied statistics. Classification and Dimension Reduction. Finance and Statistics. 1989. P. 607.
Frolova, E.V., Rogach, O.V., Kabanova, E.E., Medvedeva, N.V., Shimanskaya, I.Y. Tendencies and Prospects of Tourism Industry in Russia: Sociological Analysis of Stereotypes among Population during Planning Tourism Trips. European Research Studies Journal. Vol. 20(2), 2017, p. 308-320.
Furnham, A. and Lewis, A. The economic mind: the social psychology of economic behavior. St Martin's Press. 1986. P. 292.
Ikhsanova, F.A., Ignisamova, G.R., Ikhsanov, B.I., Gizetdinov, I.A., Lugmanov, R.R. 2016. Principal component analysis for ranking the objects of oil fields development. Problems of collecting, preparing and transporting of oil and oil products. Vol. 4 (106), 2016, p. 11-20.
Kuzminov, Y.I. Bendukidze, K.A., Yudkevich, M.M. Institutional Economics Course: Institutions, Networks, Transaction Costs, Contracts. Publishing House of the Higher School of Economics. 2006. P. 442.
Malakhov, S.V. Homo economicus and rationality of economic activity (review of foreign studies).Psychological Journal. V.11 (6), 1990, p. 38-46.
Mirzadjanzadeh, A.H., Stepanova, G.S. Mathematical theory of experiment in oil and gas production. Publishing House “Nedra". 1977. P. 230.
1. Department of Humanities and Socio-Economic Sciences, Ufa State Petroleum Technological University, Branch of the University in the City of Oktyabrsky, 452600, Russian Federation, Republic of Bashkortostan, Oktyabrsky city, Devonskaya str.,54A. E-mail: rimmanet58@mail.ru
2. Department of Information Technologies, Mathematics and Natural Sciences, Ufa State Petroleum Technological University, Branch of the University in the City of Oktyabrsky, 452600, Russian Federation, Republic of Bashkortostan, Oktyabrsky city, Devonskaya str.,54A.E-mail: ichs195@mail.ru